Bitcoin Has “Plenty Of Time” Remaining In Bull Cycle, IntoTheBlock Explains Why

Mitrade
Trending Articles
coverImg
Source: DepositPhotos

The market intelligence platform IntoTheBlock has pointed out a Bitcoin pattern that could suggest there is still plenty of time to go in the cycle.


Bitcoin Long-Term Holder Pattern Could Suggest Bull Market Isn’t Over Yet


In a new post on X, IntoTheBlock discussed a pattern that the total holdings of Bitcoin long-term holders have generally followed during bull markets in the past.


The “long-term holders” (LTHs) refer to investors who have been holding their coins for longer than a year (as defined by IntoTheBlock; other analytics firms use a different cutoff) without having sold or moved them on the blockchain.


Statistically, the longer an investor holds onto their coins, the less likely they become to sell at any point. As such, the LTHs, who hold for significant periods, are considered the unyielding section of the market.


The LTHs also display this resilience in practice, as they rarely sell despite whatever may be going on in the wider market. Recently, however, these investors have been participating in a selloff.


Given that this event isn’t exactly a common one, it can be something to note. Below is the chart shared by the analytics firm that shows the trend the combined holdings of the investors in this cohort have followed over the last few years.

Bitcoin Long-Term Holder Holdings


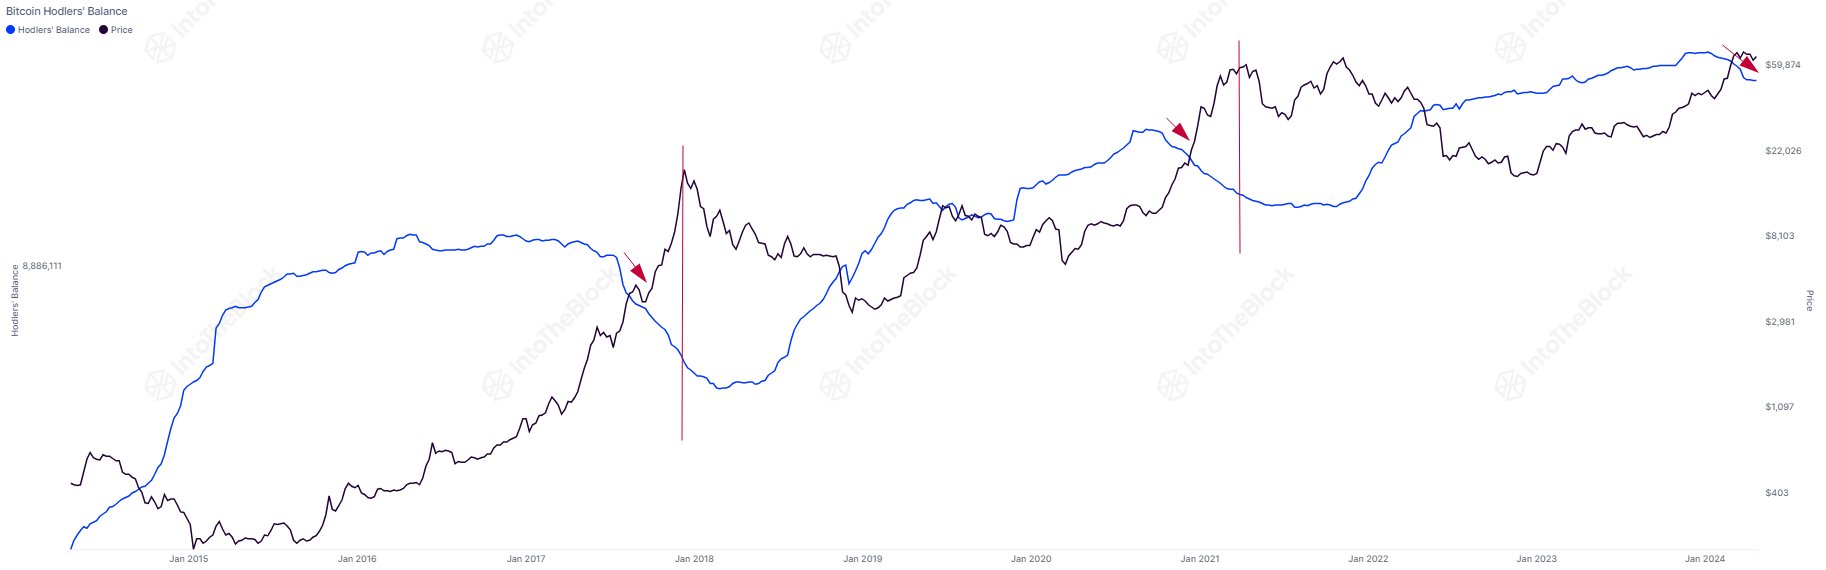
As the graph shows, Bitcoin LTHs accumulated during the 2022 bear market and the 2023 recovery rally, but recently, their holdings have turned towards the downside.


Something to keep in mind is that a one-year delay is naturally attached to buying from this group, as only investors who have held for at least a year can be part of the cohort.


This means that when the LTH holdings go up, it doesn’t suggest that buying is happening in the present but rather that it occurred a year ago, and these coins have matured enough to qualify for the cohort.


However, the same doesn’t apply to selling, as the coins’ age instantly resets back to zero as soon as these investors remove them from their wallets. As such, the recent downtrend would reflect a selloff that is happening in the present.


“Data indicates that these seasoned holders initiated their sales in January and accelerated in late March,” notes IntoTheBlock. Interestingly, the chart highlights that a similar pattern was observed during the last two bull runs.


It would appear that these HODLers tend to start selling when the Bitcoin bull run starts properly and continue to sell beyond the top. Going by this pattern, the intelligence platform suggests, “there is plenty of time remaining when compared to previous cycles.”


BTC Price


At the time of writing, Bitcoin has been floating around $64,400, which is up over 1% in the past week.


Bitcoin Price Chart

Read more

  • December Santa Claus Rally: New highs in sight for US and European stocks?
  • * The content presented above, whether from a third party or not, is considered as general advice only.  This article should not be construed as containing investment advice, investment recommendations, an offer of or solicitation for any transactions in financial instruments.

    goTop
    quote
    Related Articles
    placeholder
    Bitcoin Hits $90K as Crypto Market Surge Wipes Out $120M in Short PositionsBitcoin ascended to $90,000 before a swift correction, impacting both long and short positions.Liquidity maneuvers continue to dominate BTC's short-term price dynamics, with recent sessions squeezing short sellers.
    Author  Mitrade
    Dec 18, Thu
    Bitcoin ascended to $90,000 before a swift correction, impacting both long and short positions.Liquidity maneuvers continue to dominate BTC's short-term price dynamics, with recent sessions squeezing short sellers.
    placeholder
    Bitcoin-to-Gold Ratio Plummets 50% as Gold Breaks $4,000 in 2025In 2025, gold outpaced Bitcoin, slashing the BTC-to-gold ratio by half from 40 to 20 ounces per BTC.
    Author  Mitrade
    Dec 17, Wed
    In 2025, gold outpaced Bitcoin, slashing the BTC-to-gold ratio by half from 40 to 20 ounces per BTC.
    placeholder
    Senate Delays Crypto Market Structure Hearings to Early 2026The Senate Banking Committee has postponed cryptocurrency market structure hearings until 2026, citing ongoing bipartisan negotiations.
    Author  Mitrade
    Dec 16, Tue
    The Senate Banking Committee has postponed cryptocurrency market structure hearings until 2026, citing ongoing bipartisan negotiations.
    placeholder
    Bitcoin Slides 5% as Sellers Lean In — Can BTC Reclaim $88,000?Bitcoin has dropped back below $88,000 after rolling over from $90,500, with price still trading under the 100-hour Simple Moving Average. The sell-off found a floor at $85,151, and BTC is now consolidating near that base, but rebounds are facing pressure from a bearish trend line around $89,000. Bulls need to retake $88,000–$89,000 to ease downside risk; failure to do so keeps $85,500–$85,000 and then $83,500 in play, with $80,000 as the deeper “line in the sand.” Bitcoin (BTC) is back in damage-control mode after a sharp pullback wiped out recent gains. The price failed to reclaim the $90,000–$90,500 band, rolled over, and slid through $88,500 before briefly dipping under $87,000. Buyers did show up around $85,000, but the rebound so far looks more like stabilization than a clear trend reversal. Bitcoin dips hard, finds a bid near $85,000(h3) BTC’s latest move lower began when it couldn’t build follow-through above $90,000 and $90,500. Once that upside stalled, sellers took control and pushed price down through $88,500. The slide accelerated enough to spike below $87,000, but the market didn’t free-fall. Bulls defended the $85,000 zone, printing a low at $85,151. Since then, Bitcoin has been consolidating below the 23.6% Fibonacci retracement of the drop from the $93,560 swing high to the $85,151 low — a clue that the bounce is still shallow and that sellers haven’t fully backed off yet. Structurally, BTC is still on the back foot: It’s trading below $88,000, and It remains below the 100-hour Simple Moving Average, keeping short-term trend pressure pointed downward. Resistance is layered, and $89,000 is the problem area(h3) If bulls try to turn this into a recovery, they’ll have to climb through multiple ceilings in quick succession. First, BTC faces resistance around $87,150, followed by a more meaningful barrier near $87,500. From there, the market’s attention snaps back to $88,000 — the level BTC just lost and now needs to reclaim. A close back above $88,000 would improve the tone, but it doesn’t solve the bigger issue: there’s a bearish trend line on the hourly BTC/USD chart (Kraken feed) with resistance near $89,000, which also lines up with the next technical hurdle. If BTC can push through $89,000 and hold, the rebound could extend toward $90,000, with follow-through targets at $91,000 and $91,500. But until price clears that $88,000–$89,000 zone, rallies are at risk of being sold rather than chased. If BTC fails to reclaim resistance, the downside path is clear(h3) The near-term bear case is simple: if Bitcoin can’t climb back above the $87,000 area and keep traction, sellers may attempt another leg lower. Support levels line up like this: Immediate support: $85,500 First major support: $85,000 Next support: $83,500 Then $82,500 in the near term Below that, the major “don’t break this” level is still $80,000. If BTC slips under $80,000, the risk of acceleration to the downside increases significantly — not because it’s magic, but because it’s the kind of psychological and structural level that tends to trigger forced de-risking. Indicators: momentum still leans bearish(h3) The intraday indicators aren’t offering much comfort yet: Hourly MACD is losing pace in the bearish zone. Hourly RSI remains below 50, suggesting sellers still have the upper hand on short timeframes. So while the $85,000 defense held for now, the market hasn’t flipped bullish — it’s just stopped bleeding.
    Author  Mitrade
    Dec 16, Tue
    Bitcoin has dropped back below $88,000 after rolling over from $90,500, with price still trading under the 100-hour Simple Moving Average. The sell-off found a floor at $85,151, and BTC is now consolidating near that base, but rebounds are facing pressure from a bearish trend line around $89,000. Bulls need to retake $88,000–$89,000 to ease downside risk; failure to do so keeps $85,500–$85,000 and then $83,500 in play, with $80,000 as the deeper “line in the sand.” Bitcoin (BTC) is back in damage-control mode after a sharp pullback wiped out recent gains. The price failed to reclaim the $90,000–$90,500 band, rolled over, and slid through $88,500 before briefly dipping under $87,000. Buyers did show up around $85,000, but the rebound so far looks more like stabilization than a clear trend reversal. Bitcoin dips hard, finds a bid near $85,000(h3) BTC’s latest move lower began when it couldn’t build follow-through above $90,000 and $90,500. Once that upside stalled, sellers took control and pushed price down through $88,500. The slide accelerated enough to spike below $87,000, but the market didn’t free-fall. Bulls defended the $85,000 zone, printing a low at $85,151. Since then, Bitcoin has been consolidating below the 23.6% Fibonacci retracement of the drop from the $93,560 swing high to the $85,151 low — a clue that the bounce is still shallow and that sellers haven’t fully backed off yet. Structurally, BTC is still on the back foot: It’s trading below $88,000, and It remains below the 100-hour Simple Moving Average, keeping short-term trend pressure pointed downward. Resistance is layered, and $89,000 is the problem area(h3) If bulls try to turn this into a recovery, they’ll have to climb through multiple ceilings in quick succession. First, BTC faces resistance around $87,150, followed by a more meaningful barrier near $87,500. From there, the market’s attention snaps back to $88,000 — the level BTC just lost and now needs to reclaim. A close back above $88,000 would improve the tone, but it doesn’t solve the bigger issue: there’s a bearish trend line on the hourly BTC/USD chart (Kraken feed) with resistance near $89,000, which also lines up with the next technical hurdle. If BTC can push through $89,000 and hold, the rebound could extend toward $90,000, with follow-through targets at $91,000 and $91,500. But until price clears that $88,000–$89,000 zone, rallies are at risk of being sold rather than chased. If BTC fails to reclaim resistance, the downside path is clear(h3) The near-term bear case is simple: if Bitcoin can’t climb back above the $87,000 area and keep traction, sellers may attempt another leg lower. Support levels line up like this: Immediate support: $85,500 First major support: $85,000 Next support: $83,500 Then $82,500 in the near term Below that, the major “don’t break this” level is still $80,000. If BTC slips under $80,000, the risk of acceleration to the downside increases significantly — not because it’s magic, but because it’s the kind of psychological and structural level that tends to trigger forced de-risking. Indicators: momentum still leans bearish(h3) The intraday indicators aren’t offering much comfort yet: Hourly MACD is losing pace in the bearish zone. Hourly RSI remains below 50, suggesting sellers still have the upper hand on short timeframes. So while the $85,000 defense held for now, the market hasn’t flipped bullish — it’s just stopped bleeding.
    placeholder
    Macro Analysts: Hawkish Japan Could Push Bitcoin Below $70KAnalysts predict Bitcoin may face further declines towards the $70,000 mark if the Bank of Japan raises interest rates as expected.
    Author  Mitrade
    Dec 15, Mon
    Analysts predict Bitcoin may face further declines towards the $70,000 mark if the Bank of Japan raises interest rates as expected.

    Bitcoin Related Articles

    • Trading Chart Patterns:Ultimate Guide to Price Action
    • How to Day Trade Crypto? Simplest Day Trading Strategy Ever
    • Places that Provide Cheapest Ways to Buy Bitcoin In 2025
    • 10 Best Crypto With Most Potential to Buy and invest in 2025 - Top Picks from Expert Traders
    • Top 10 Bitcoin Mining Apps for Android & iOS During 2024
    • How To Buy Bitcoin In Malaysia? Top 7 Best Crypto Exchanges & Trading Apps

    Click to view more