Bitcoin’s ‘2022 Redux’ Fears Are Superficial, Argues TexasWest Capital CEO

coverImg
Source: DepositPhotos
  • Structural Divergence: While the chart mirrors 2022 optics, analyst Christopher Inks identifies a completed five-wave "washout" rather than the structural breakdown that defined the Terra collapse.

  • Catalyst Mismatch: The current sell-off is characterized as a "degrossing" event (risk reduction) rather than a liquidity crisis, supported by coiled price action in 2-year Treasury notes.

  • The Roadmap: Inks is looking for a multi-week consolidation with declining volume on pullbacks to confirm a "terminal shakeout" rather than a bearish continuation.

Bitcoin’s violent drawdown from all-time highs has crypto Twitter drawing anxious parallels to the 2022 bear market. The visual similarities are undeniable, yet some veteran technicians argue that beneath the surface, the market structure tells a fundamentally different story.

Christopher Inks, CEO of TexasWest Capital, posits that the current price action represents a completed positioning washout rather than the systemic collapse that drove the 2022 unwind.

Wave Structure: Completion vs. ContinuationIn a series of technical updates, Inks challenges the bearish consensus by analyzing the Elliott Wave structure of the decline. "One of the differences between the current drop off the ATH and the 2022 drop... is that we just appear to have completed 5 waves down," Inks noted.
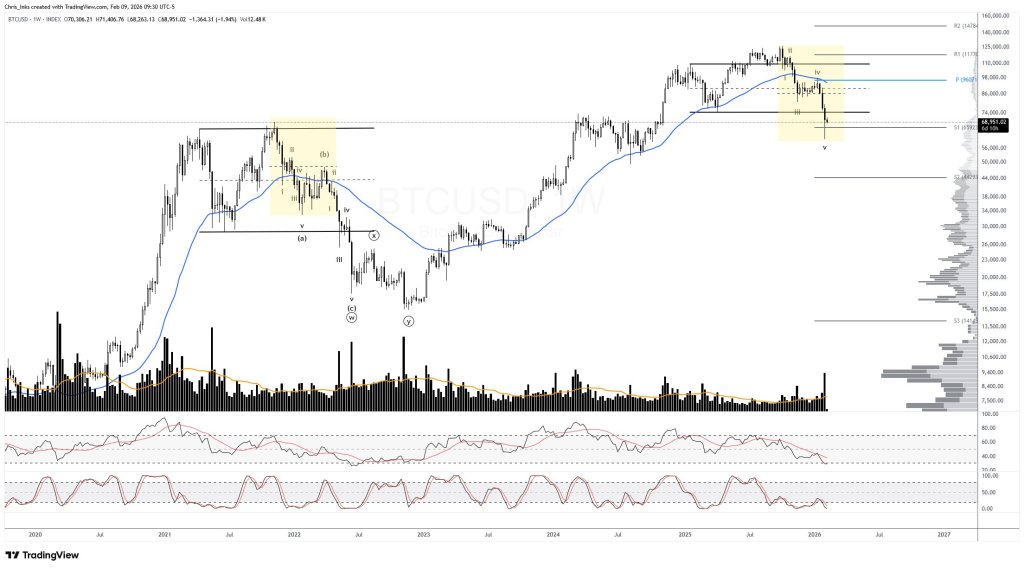
Has Bitcoin completed 5 waves down?

He contrasts this with the 2022 sequence, where the market had already finished a five-wave impulse and a three-wave correction before breaking down further. On his weekly BTCUSD chart, the current move maps as a finished decline into early 2026, implying the next phase is likely corrective or constructive base-building rather than an immediate continuation lower.

Crisis vs. De-grossingBeyond the charts, the macro catalysts differ sharply. The 2022 crash was a reflexive shock triggered by the TerraUSD (UST) depeg—a structural failure that impaired liquidity across the entire ecosystem.

Conversely, Inks frames last week’s selling as "degrossing"—a standard risk-off reduction of exposure. "These are two wholly different market moves," Inks wrote. "If you’re comparing two events then you should compare how they occurred and not just that the price action looks kinda similar."

The Macro ConfirmationSupporting this thesis is the behavior of the bond market. Inks pointed to 2-year Treasury note futures, observing that yields remained "coiled" rather than breaking out, suggesting the crypto sell-off was "pre-resolution positioning rather than post-crisis fallout."

What to Watch: The Base-Building PhaseDespite the constructive structural view, Inks is not calling a definitive bottom just yet. Bitcoin recently failed to reclaim a weekly close inside the prior range near $75,000, leaving the door open for volatility.

For confidence to return, Inks’ roadmap requires patience:

  • Time: The low needs to hold for "the next 2–3 weeks."

  • Volume: He wants to see "declining volumes on the pullbacks."

  • Structure: A higher low on the weekly timeframe and "compression below resistance instead of rejection."

Short-Term OutlookOn the lower timeframes (1-hour chart), Bitcoin is consolidating sideways around a weekly pivot following Friday's sharp recovery. "Takes time to build confidence after something like that," Inks cautioned, advising traders to prefer base-building over a "straight up" V-shaped recovery.
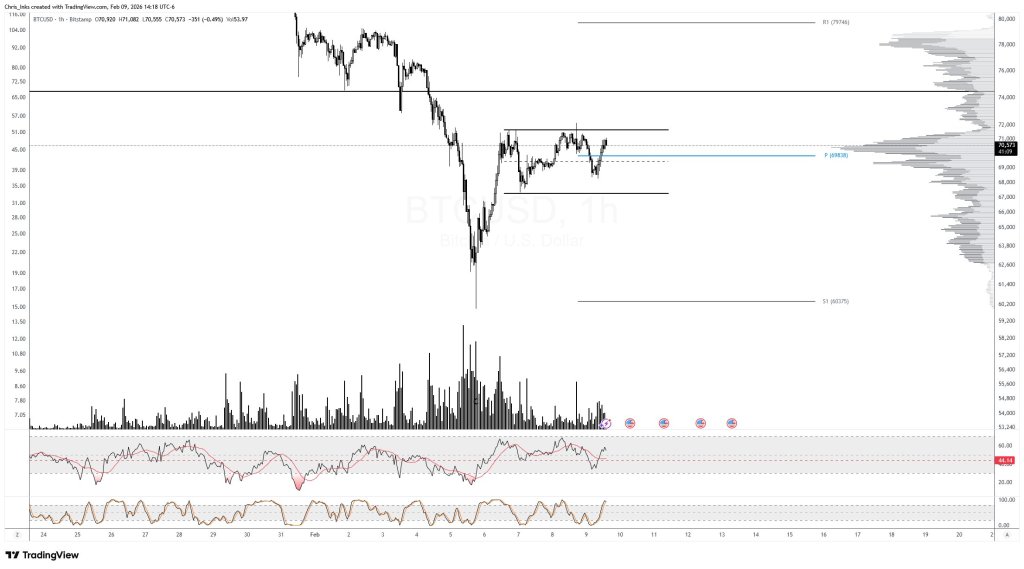
Bitcoin hourly chart

At press time, Bitcoin was trading at $68,639.
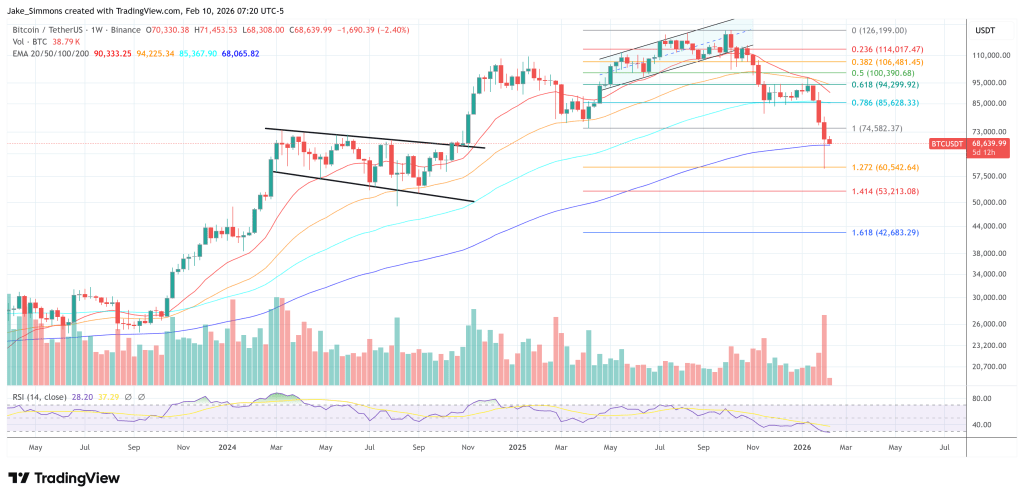
Bitcoin price chart

Read more

  • Spot Gold Breaches Four Key Levels, Putting $3,500 at Risk as Technicals Enter Oversold Alert Zone
  • Note: If you want to share the article 《Bitcoin’s ‘2022 Redux’ Fears Are Superficial, Argues TexasWest Capital CEO》, make sure you retain the original link. For more information, please visit Insights or browse www.mitrade.com.

    The above content was completed with the assistance of AI and has been reviewed by an editor.


    goTop
    quote
    Related Articles
    placeholder
    Bitcoin Plunges 13% in a Week as Market Retreats to $60,000 LevelBitcoin plunged 13% over the past seven days as bullish defense lines crumbled in succession, officially kicking off the battle to defend the $60,000 mark.On November 16, following a viol
    Author  TradingKey
    Nov 16, Mon
    Bitcoin plunged 13% over the past seven days as bullish defense lines crumbled in succession, officially kicking off the battle to defend the $60,000 mark.On November 16, following a viol
    placeholder
    Bitcoin lost its 200-day average — but the exit started three sessions before the CPIBitcoin fell 2.5% to about $73,400 on 11 November, an 11-week low, breaking its 200-day moving average near $73,100. The 24-hour liquidation tally reached $632 to $705 million, roughly 82% of it longs. But spot ETF outflows began three sessions earlier and USDT's market cap has shrunk $6.6 billion in 60 days — the leveraged length left before the inflation print did. A double top at 81,890 and 81,080 leaves a measured target of 69,366.
    Author  Suzie
    Nov 11, Wed
    Bitcoin fell 2.5% to about $73,400 on 11 November, an 11-week low, breaking its 200-day moving average near $73,100. The 24-hour liquidation tally reached $632 to $705 million, roughly 82% of it longs. But spot ETF outflows began three sessions earlier and USDT's market cap has shrunk $6.6 billion in 60 days — the leveraged length left before the inflation print did. A double top at 81,890 and 81,080 leaves a measured target of 69,366.
    placeholder
    Bitcoin ETFs sold $1.28 billion in a week — and BTC is still above 75,000US spot Bitcoin ETFs logged $1.28 billion of net outflows in the week to Nov 6, the largest since late June, with BlackRock's IBIT accounting for $1.21 billion. Yet BTC only fell from $80,405 to $74,940, a 6.8% move. The gap between the fund flow and the price is the story: leveraged longs were flushed, but spot holders did not follow the ETFs out — and $75,000 is the line that decides whether that reading holds.
    Author  Suzie
    Nov 09, Mon
    US spot Bitcoin ETFs logged $1.28 billion of net outflows in the week to Nov 6, the largest since late June, with BlackRock's IBIT accounting for $1.21 billion. Yet BTC only fell from $80,405 to $74,940, a 6.8% move. The gap between the fund flow and the price is the story: leveraged longs were flushed, but spot holders did not follow the ETFs out — and $75,000 is the line that decides whether that reading holds.
    placeholder
    Binance replaced 95% of a $6.3bn hole — Bitcoin is trading the plumbing, not the coinBinance resumed withdrawals on November 1 after a record $6.3bn theft. In the first 9.5 hours, users withdrew $4.64bn and deposited $1.01bn, a net outflow of $3.64bn, or 2.1% of assets. Bitcoin fell to 76,173 and is now 78,473. The market is pricing the exchange, not the supply.
    Author  Suzie
    Nov 02, Mon
    Binance resumed withdrawals on November 1 after a record $6.3bn theft. In the first 9.5 hours, users withdrew $4.64bn and deposited $1.01bn, a net outflow of $3.64bn, or 2.1% of assets. Bitcoin fell to 76,173 and is now 78,473. The market is pricing the exchange, not the supply.
    placeholder
    Bitcoin is back above $80,000 — but 75% of the bounce was shorts, not buyersBitcoin trades at $80,669, back above the $80,000 line after touching $79,145 on October 24. But 75.4% of the last 24 hours of futures liquidations were shorts, CME open interest fell 36,545 BTC in October, and spot ETFs lost $773.5 million on October 22-23. Price is up; positioning is down. Here is why the bounce is a squeeze, and the four things that would make it real.
    Author  Suzie
    Oct 28, Wed
    Bitcoin trades at $80,669, back above the $80,000 line after touching $79,145 on October 24. But 75.4% of the last 24 hours of futures liquidations were shorts, CME open interest fell 36,545 BTC in October, and spot ETFs lost $773.5 million on October 22-23. Price is up; positioning is down. Here is why the bounce is a squeeze, and the four things that would make it real.
    Live Quotes
    Name / SymbolChart% Change / Price
    BTCUSD
    BTCUSD
    0.00%0.00

    Bitcoin Related Articles

    • Bitcoin Leverage And Margin Trading in 2026: The Ultimate Beginner's Guide
    • Gold vs Bitcoin 2026: Which Is the Better Investment?Best Hedge Asset Comparison
    • Best Strategies When BTC Price Drops: From Hedging to Accumulating
    • How to Day Trade Crypto? Simplest Day Trading Strategy Ever
    • Bitcoin Price Prediction 2026-2030: Long-Term Outlook Driven by Data & Macro Cycles
    • Bitcoin Mining Beginner Guide: What Is Bitcoin Mining and How to Mine Bitcoin?

    Click to view more