

Bitcoin Tests $90,000 Levels Amid Speculation Around Trump’s Crypto Summit

- US-Iran Agreement Brought Forward: Pakistani Prime Minister Confirms US-Iran Agreement Has Taken Effect Immediately, Strait of Hormuz Will Reopen Immediately
- WTI hovers around $80.00 as traders await developments on US-Iran peace talks
- Gold rises to weekly high as US, Iran reach peace deal
- Bitcoin network activity hits new high despite stalled prices — CryptoQuant
- WTI Price Forecast: Trades above $75.50 on Iran uncertainty; 200-day SMA holds the key
- Gold Price Forecast: Hawkish Fed Triggers Gold Plunge, Can US-Iran Agreement Push Gold Past $4,360?

Bitcoin (BTC) surged nearly 8% on Wednesday, reclaiming levels above $90,000 after briefly dropping below $80,000 five days ago. This sharp recovery signals renewed bullish momentum as investors react to speculation surrounding Trump’s proposed US crypto reserve plan.
Key technical indicators, such as the DMI and Ichimoku Cloud, suggest that buyers have regained control. Whether BTC can sustain this momentum and push toward $100,000 or face renewed volatility depends largely on upcoming market developments, including the White House Crypto Summit.
Bitcoin DMI Shows Buyers Have Reclaimed Control
Bitcoin’s Directional Movement Index (DMI) shows that the ADX has fallen to 17.5, down significantly from 27.6 just two days ago. A declining ADX indicates weakening trend strength, meaning that the previous downtrend has lost momentum.
At the same time, the +DI has risen to 27.9 from 17.7 yesterday, while the -DI has dropped from 30.5 to 20.5. This shift suggests that bullish momentum is increasing while selling pressure is fading.
Bitcoin is currently attempting to transition from a downtrend to an uptrend, and these movements in the DMI lines indicate that buyers are starting to gain control.
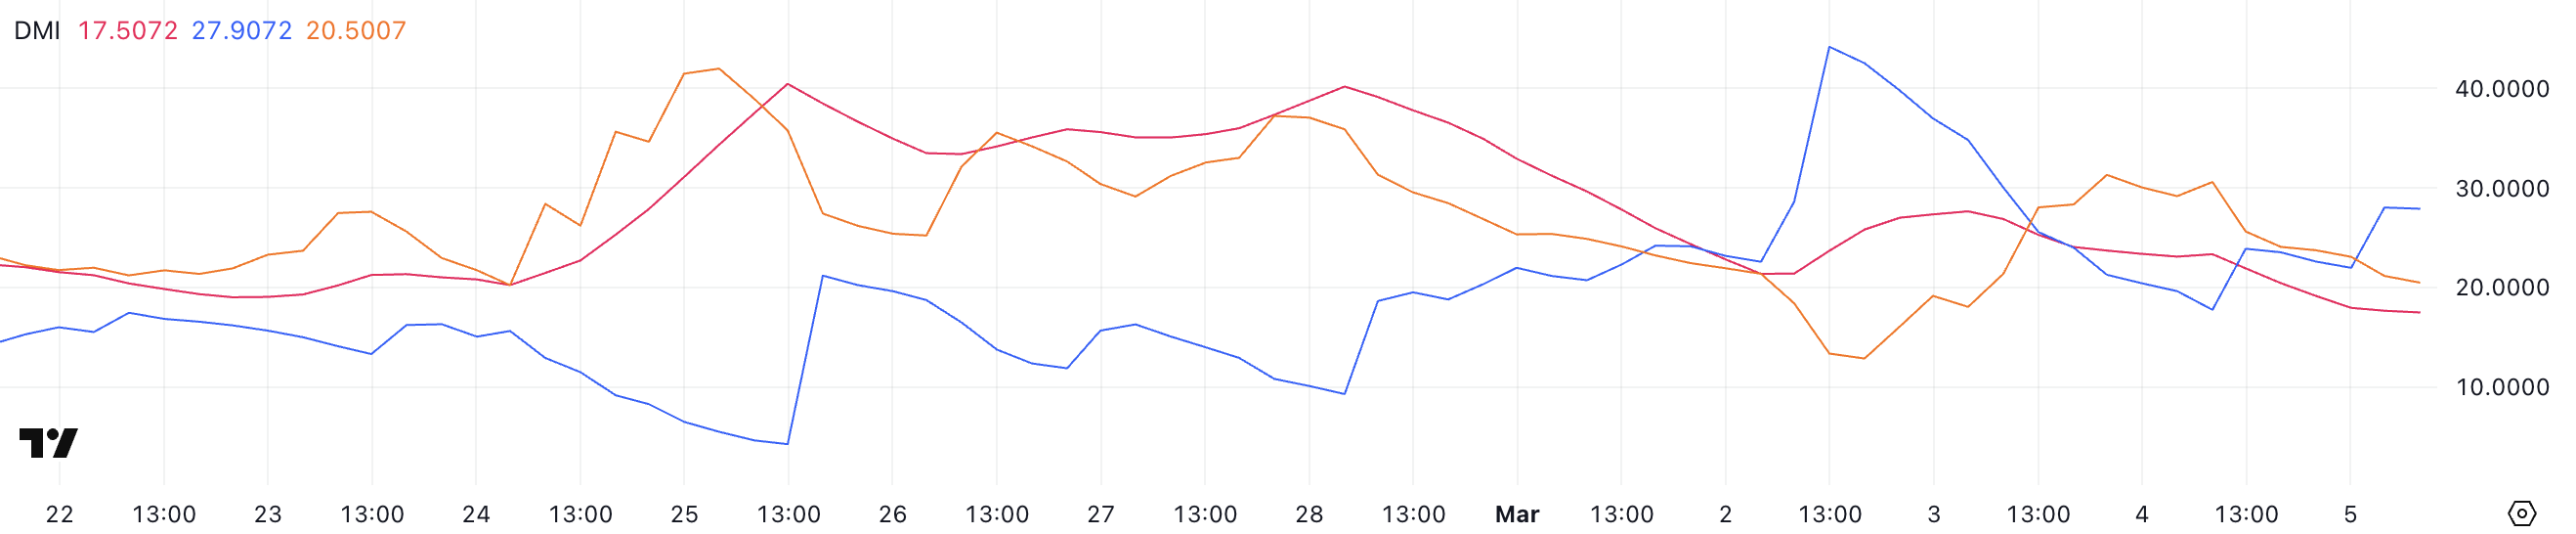 BTC DMI. Source: TradingView.
ADX, or the Average Directional Index, measures trend strength rather than direction. Values above 25 typically signal a strong trend, while values below 20 indicate a weak or indecisive market.
With ADX now at 17.5, Bitcoin’s current price action lacks strong trend confirmation, making its next move critical.
However, the rising +DI and falling -DI suggest that bullish pressure is increasing. If ADX starts rising again alongside a widening gap between +DI and -DI in favor of buyers, Bitcoin could establish a new uptrend.
Conversely, if ADX remains low, price action may stay choppy, lacking the strength needed for a decisive breakout.
BTC Ichimoku Cloud Shows a Shift In Momentum
Bitcoin’s Ichimoku Cloud structure suggests a potential shift in momentum as the price moves above key levels. The price has recently broken above the red baseline, indicating growing bullish pressure. However, it is still interacting with the cloud, which represents a zone of uncertainty where trends often get tested.
The green leading span A is beginning to slope upward. In contrast, the orange leading span B remains relatively flat, showing that the cloud ahead is transitioning into a possible support area.
Additionally, the lagging span (green line) is approaching price action from 26 periods ago, suggesting that Bitcoin is determining whether this breakout has enough strength to continue.
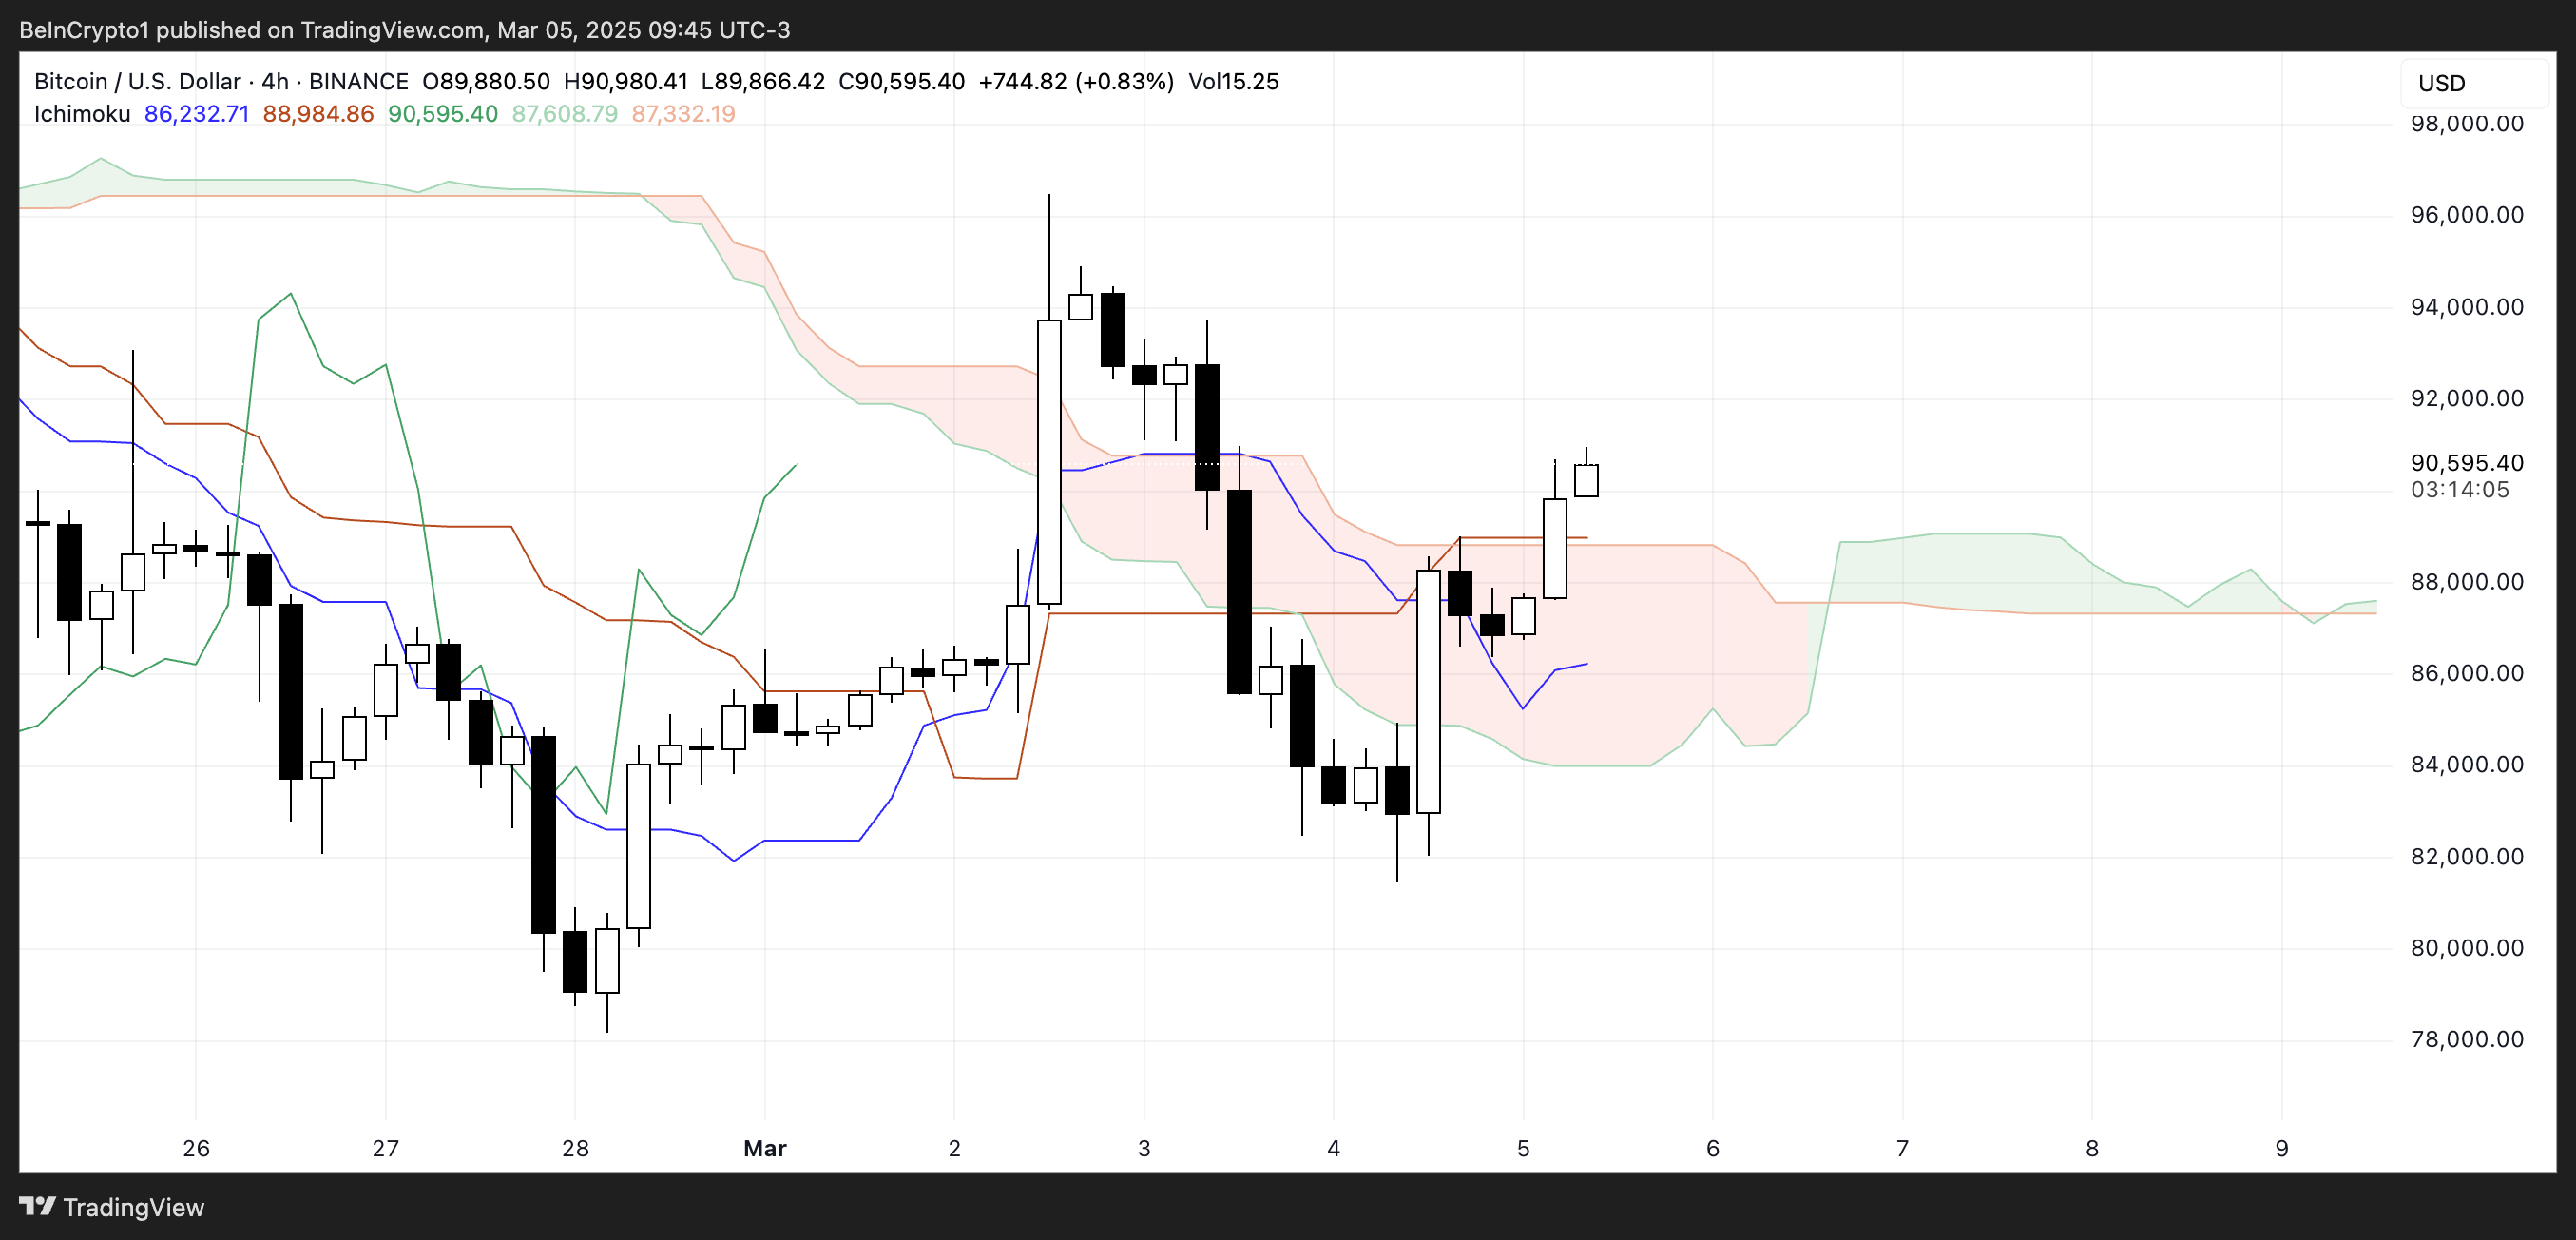 BTC Ichimoku Cloud. Source: TradingView.
The Ichimoku Cloud is a dynamic indicator that highlights trend direction, momentum, and key support and resistance zones. A decisive move above the cloud would confirm a stronger bullish trend, allowing Bitcoin to establish a more defined uptrend.
However, if the price fails to hold above the red baseline and re-enters the cloud, it could indicate a period of consolidation or even a retest of lower levels.
The current setup suggests that Bitcoin is at a critical point. Continued momentum could lead to a breakout, but hesitation near the cloud could result in sideways movement before a clearer trend emerges.
How Will Bitcoin React After the White House Crypto Summit?
Bitcoin has reclaimed the $90,000 level as speculation grows over potential special treatment in Trump’s proposed US crypto reserve plan.
This renewed bullish momentum puts BTC in a position to test key resistance at $94,833. A breakout above this level could potentially lead to a rally toward $99,472.
If bullish sentiment continues to build, Bitcoin could surpass $100,000 for the first time since February 3, marking a significant milestone.
The overall trend will depend on whether buying pressure remains strong enough to sustain the current momentum and push past these critical levels.
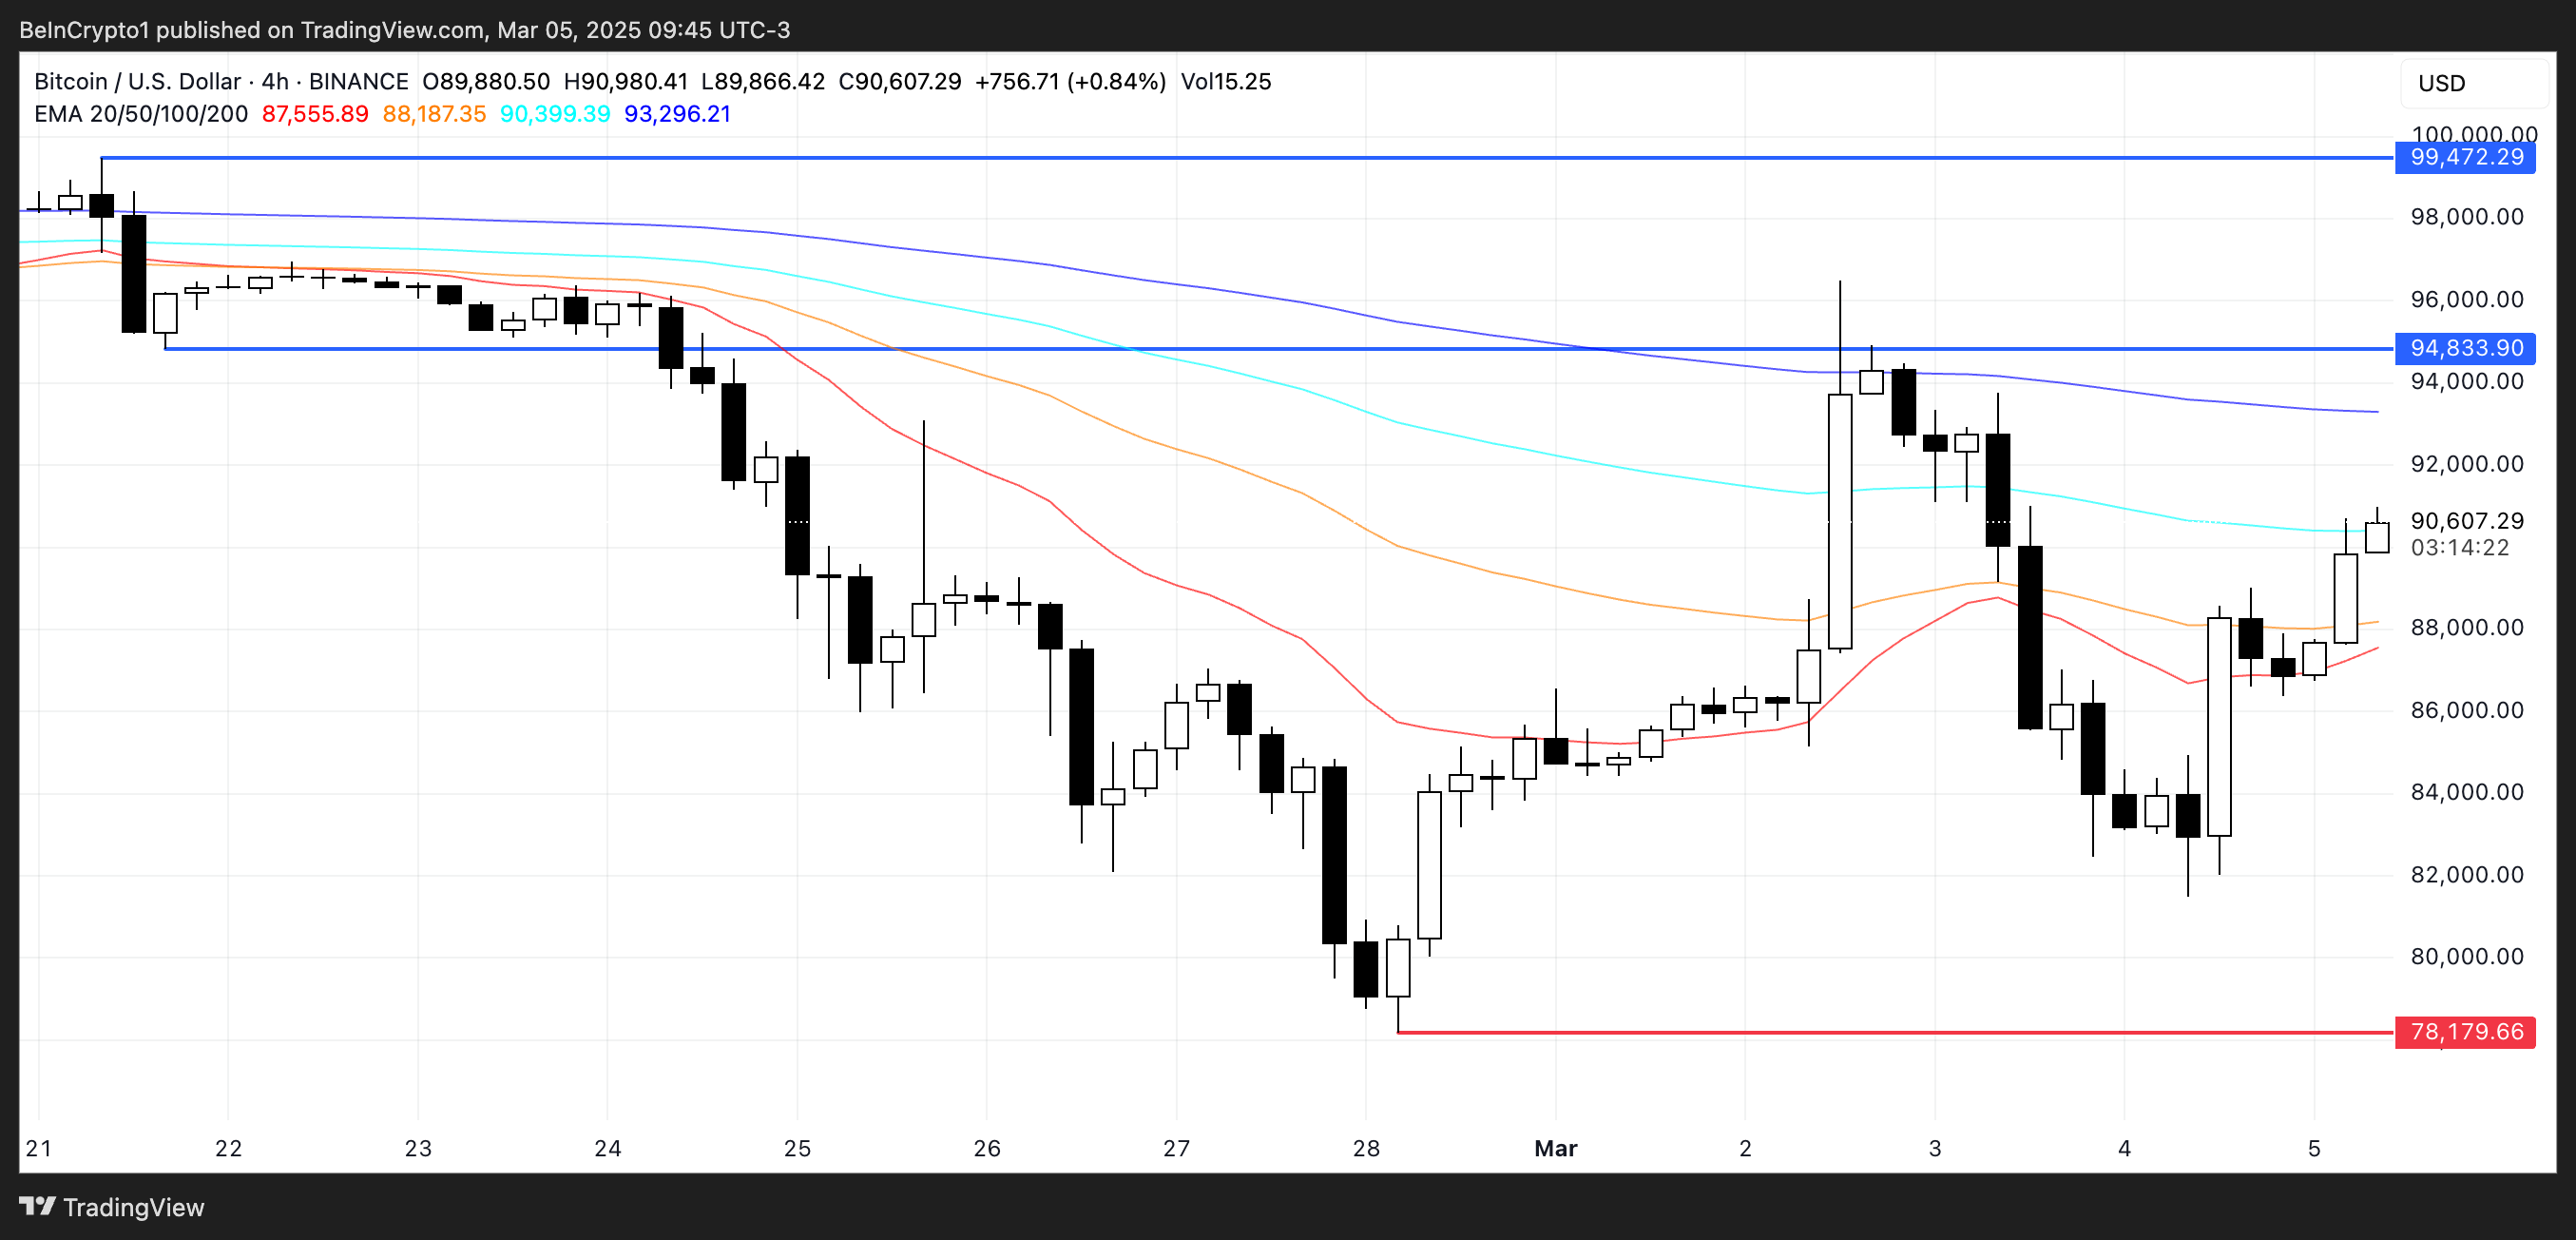 BTC Price Analysis. Source: TradingView.
However, Bitcoin’s recent price action has been highly volatile, with strong swings in both directions over the past few weeks.
Market uncertainty surrounding the upcoming White House Crypto Summit on March 7 adds further risk, as any developments that fall short of investor expectations could trigger a renewed downtrend.
If bearish pressure intensifies, BTC could face a sharp decline, potentially dropping as low as $78,179.
Read more
* The content presented above, whether from a third party or not, is considered as general advice only. This article should not be construed as containing investment advice, investment recommendations, an offer of or solicitation for any transactions in financial instruments.


