Gold price sticks to gains above $2,600 amid some repositioning ahead of US CPI

Mitrade
coverImg
Source: DepositPhotos
  • Gold price stages a goodish recovery from a nearly two-month low touched on Tuesday.

  • Elevated US bond yields and a bullish USD might cap gains for the non-yielding XAU/USD.

  • Traders now look forward to the crucial US consumer inflation figures for a fresh impetus. 


Gold price (XAU/USD) attracts some buyers during the Asian session on Wednesday and for now, seems to have snapped a three-day losing streak to its lowest level since September 20, around the $2,590-$2,589 region touched the previous day. The uptick lacks any obvious fundamental catalyst and could be attributed to some repositioning trade ahead of the US consumer inflation figures. The crucial data might influence expectations about the Federal Reserve's (Fed) rate-cut path and provide a fresh directional impetus to the non-yielding yellow metal. 


Ahead of the key data risk, the US Dollar (USD) enters a bullish consolidation phase following the recent upsurge in its highest level since early May. This, along with fears that US President-elect Donald Trump’s protectionist tariffs will impact the global economy and a generally weaker tone around the equity markets, offers some support to the safe-haven Gold price. The upside for the XAU/USD, however, seems limited amid expectations that Trump's expansionary policies could boost inflation and restrict the Fed from easing its monetary policy aggressively.


Gold price might struggle to capitalize on recovery amid optimism over Trump’s proposed expansionary policies


The US Dollar climbed to its highest level since early May on Tuesday amid optimism over US President-elect Donald Trump’s proposed expansionary policies and dragged the Gold price below the $2,600 mark for the first time since September.


Furthermore, the likelihood of Trump's protectionist tariffs being implemented should put upward pressure on inflation and limit the scope for the Federal Reserve to cut interest rates, which remain supportive of elevated US bond yields.


Richmond Fed President Tom Barkin said Tuesday that inflation might be coming under control, though the path remains uncertain and that the core gauge might give a signal that it risks getting stuck above the central bank's 2% target. 


Separately, Minneapolis Fed President Neel Kashkari noted that any upside surprise in inflation in the weeks leading up to the December FOMC monetary policy meeting could encourage the central bank to pause interest rate cuts. 


The yield on the benchmark 10-year US government bond remains close to a multi-month peak touched after Trump's victory in the US presidential election amid reduced bets for aggressive interest rate cuts by the Fed going forward.


The USD bulls take a brief pause for a breather and look to the release of the latest US consumer inflation figures, which will play a key role in influencing market expectations about the Fed's rate-cut path and provide a fresh impetus.


The headline Consumer Price Index (CPI) is expected to have risen by 0.2% in October and by 2.6% over the past 12 months, up from 2.4% in the prior month, fueling doubts over how much headroom the Fed has to keep cutting rates.


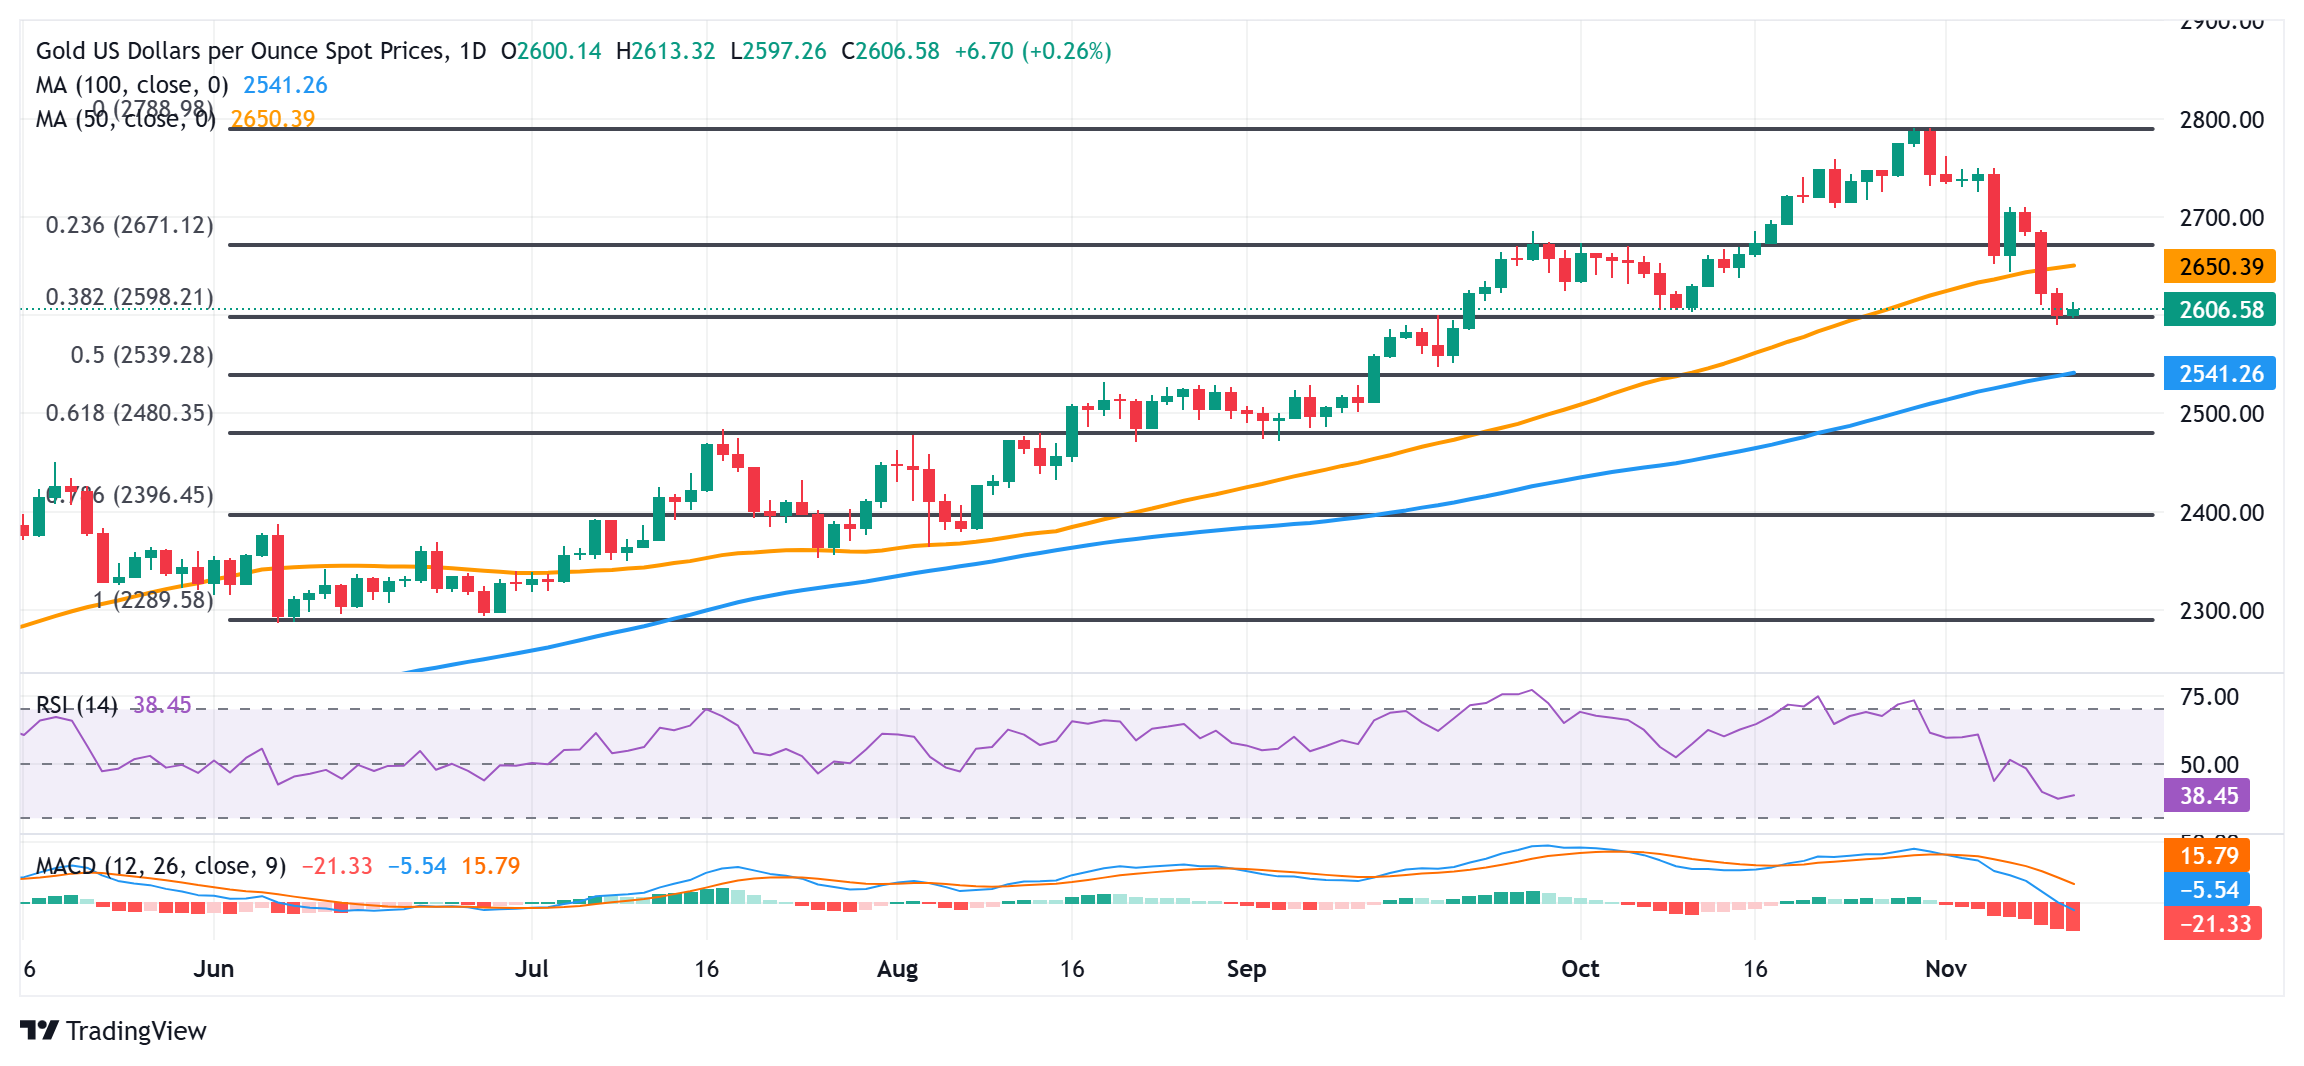
Gold price needs to find acceptance below the $2,600 mark and 38.2% Fibo. level for bears to retain near-term control

fxsoriginal

From a technical perspective, the overnight resilience below the 38.2% Fibonacci retracement level of the June-October rally and the subsequent move-up warrants caution for bearish traders. That said, oscillators on the daily chart are holding deep in negative territory and are still away from being in the oversold zone. This, in turn, suggests that the path of least resistance for the Gold price is to the downside. 


Hence, any subsequent move up could be seen as a selling opportunity and remain capped near the $2,630-2,632 resistance. That said, some follow-through buying could lift the Gold price to the next relevant hurdle near the $2,650-2,655 region, en route to the $2,670 level. This is followed by the $2,700 mark, which if cleared decisively will suggest that the recent corrective fall from the all-time peak has run its course. 


On the flip side, bearish traders need to wait for acceptance below the $2,600 mark and the 38.2% Fibo. level before placing fresh bets. The subsequent fall might then drag the Gold price to the $2,540 confluence – comprising the 100-day Simple Moving Average (SMA) and the 50% Fibo. level. This could act as a strong near-term base for the XAU/USD, which if broken will be seen as a fresh trigger for bearish traders.

Read more

  • US October PPI Preview: Fed Rate Hike Expectations Rise, PPI May Be Key Variable; How Will US Stocks, Dollar, and Gold Move?
  • Gold Extends Slide Below $4,000 as Rising US Inflation, Fed December Hike Bets Pressure Prices
  • * The content presented above, whether from a third party or not, is considered as general advice only.  This article should not be construed as containing investment advice, investment recommendations, an offer of or solicitation for any transactions in financial instruments.

    goTop
    quote
    Related Articles
    placeholder
    Gold Price Forecast: Gold Tumbles Below $3,900 as Trump Says No Need for Iran Deal; Can October PPI Spur a Rebound? As of the Asian session on Friday (November 13), gold prices (XAUUSD) rebounded intraday following Thursday's sharp decline, trading near $3,910. Previously, gold tumbled 2.76% on Thursda
    Author  TradingKey
    4 hours ago
    As of the Asian session on Friday (November 13), gold prices (XAUUSD) rebounded intraday following Thursday's sharp decline, trading near $3,910. Previously, gold tumbled 2.76% on Thursda
    placeholder
    Gold hit a one-year low while central banks bought 321 tonnes — the sellers were never the ones you thinkSpot gold closed at 3,876 on Thursday, down 2.8% and its lowest close in more than a year, with an intraday low near 3,852. The dollar is at a 19-month high of 103.21 and the 10-year yield is at 5.10%, so the price move is easy to explain. What is harder to explain is who sold: central banks bought 321 tonnes in Q3, the PBoC added for a 24th straight month, ETF holdings are near a record 4,256 tonnes, and roughly 95% of the futures selling came from non-reportable and sovereign-type accounts rather than hedge funds. This piece separates the two books that have to balance.
    Author  Irene Q.
    8 hours ago
    Spot gold closed at 3,876 on Thursday, down 2.8% and its lowest close in more than a year, with an intraday low near 3,852. The dollar is at a 19-month high of 103.21 and the 10-year yield is at 5.10%, so the price move is easy to explain. What is harder to explain is who sold: central banks bought 321 tonnes in Q3, the PBoC added for a 24th straight month, ETF holdings are near a record 4,256 tonnes, and roughly 95% of the futures selling came from non-reportable and sovereign-type accounts rather than hedge funds. This piece separates the two books that have to balance.
    placeholder
    US October PPI Preview: Fed Rate Hike Expectations Rise, PPI May Be Key Variable; How Will US Stocks, Dollar, and Gold Move?On Friday (Nov. 13) Eastern Time, the U.S. will release the October Producer Price Index (PPI). Following the October CPI once again exceeding expectations, the market will look to the PP
    Author  TradingKey
    Yesterday 08: 36
    On Friday (Nov. 13) Eastern Time, the U.S. will release the October Producer Price Index (PPI). Following the October CPI once again exceeding expectations, the market will look to the PP
    placeholder
    Gold closed below $4,000 again — the ETF crowd and central banks stayed, the momentum money leftSpot gold is trading near $3,999, its third consecutive lower daily low, after a 5.00% 10-year yield and a 102.85 dollar index raised the odds of a December hike to 87%. But the selling is not coming from the strategic holders: managed-money net longs fell to 324 tonnes, a 21-week low, and Goldman Sachs attributes roughly 95% of five weeks of selling to non-reportable positions. ETFs still hold a record 4,256 tonnes and central banks bought 321 tonnes in Q3. The table below sets the triggers, directions and levels.
    Author  Irene Q.
    Yesterday 03: 20
    Spot gold is trading near $3,999, its third consecutive lower daily low, after a 5.00% 10-year yield and a 102.85 dollar index raised the odds of a December hike to 87%. But the selling is not coming from the strategic holders: managed-money net longs fell to 324 tonnes, a 21-week low, and Goldman Sachs attributes roughly 95% of five weeks of selling to non-reportable positions. ETFs still hold a record 4,256 tonnes and central banks bought 321 tonnes in Q3. The table below sets the triggers, directions and levels.
    placeholder
    Gold Extends Slide Below $4,000 as Rising US Inflation, Fed December Hike Bets Pressure Prices On November 12, gold prices (XAUUSD) extended their recent losses, falling further below $4,000 in early Asian trading to hit an intraday low near $3,968, marking a third consecutive day
    Author  TradingKey
    Yesterday 02: 00
    On November 12, gold prices (XAUUSD) extended their recent losses, falling further below $4,000 in early Asian trading to hit an intraday low near $3,968, marking a third consecutive day
    Live Quotes
    Name / SymbolChart% Change / Price
    XAUUSD
    XAUUSD
    0.00%0.00
    USDOLLAR-F
    USDOLLAR-F
    0.00%0.00

    Gold Related Articles

    • 10 Best Day Trading Platforms for Beginners and Active Traders in 2026: A Practical Guide
    • What is Gold CFD? How to Trade Gold CFD With Mitrade Example
    • ​5 Best Paper Trading Platforms for 2026 (Free Demo Accounts for Beginners & Traders)
    • XAU/USD Gold Price Trend Analysis 2026: Will It Keep Rising?
    • Is Mitrade Right for You? A Complete Guide on How to Start Trading CFDs in 5 Steps
    • How and Where to Buy Gold in Australia? A Complete Guide for Beginners

    Click to view more