




Gold rally maintains its positive momentum intact fuelled by buying from China and safe-haven flows.
The US Dollar’s moderate recovery is weighing on Gold.
XAU/USD’s technical picture remains positive with price action standing above the last two week’s trading range.
Gold (XAU/USD) maintains a mild bullish tone on Tuesday. The tone shift by China’s Politburo, vowing further economic stimulus to support growth, and the resumption of Gold purchases by the People’s Bank of China (PBoC) are acting as a tailwind for the precious metal.
Other sources of support for Gold are the safe-haven flows triggered by the uncertainty in the Middle East, after the fall of Bacher El Asad’s regime in Syria, and the political deadlocks in France and Germany
Finally, growing bets that the Federal Reserve (Fed) will cut rates next week keep US yields close to multi-week lows, and provide additional support to the yieldless metal.
Daily digest market movers: A somewhat stronger Dollar is weighing on Gold’s recovery
China’s PBoC reported buying 160,000 ounces in November after a six-month pause. This has boosted expectations of further Gold appreciation and will likely underpin speculative demand for Bullion.
In Syria, the diverse rebel factions are starting negotiations to form a government while foreign powers like Israel and Turkey take positions. The increasing uncertainty in an already volatile region will underpin demand for the safe-haven Gold.
The US Dollar is trading moderately higher awaiting Wednesday’s Consumer Prices Index (CPI) figures to clarify the Feds’s monetary easing calendar for 2025.
The CME Group’s Fed Watch Tool reveals an 86% chance of a 25 bps Fed cut after the December 17-18 meeting and between two and three more cuts in 2025.
US consumer inflation is expected to confirm that inflation remains sticky above the Fed’s 2% target rate. The headline CPI is expected to have ticked up to a 2.7% yearly rate, from 2.6% in October with the core CPI steady at 3.3% year-on-year.
US Dollar PRICE Today
The table below shows the percentage change of US Dollar (USD) against listed major currencies today. US Dollar was the strongest against the New Zealand Dollar.
USD EUR GBP JPY CAD AUD NZD CHF USD 0.16% -0.11% 0.23% 0.00% 0.58% 0.62% 0.09% EUR -0.16% -0.26% 0.03% -0.16% 0.42% 0.46% -0.07% GBP 0.11% 0.26% 0.29% 0.10% 0.69% 0.72% 0.18% JPY -0.23% -0.03% -0.29% -0.20% 0.38% 0.41% -0.11% CAD -0.01% 0.16% -0.10% 0.20% 0.57% 0.61% 0.09% AUD -0.58% -0.42% -0.69% -0.38% -0.57% 0.03% -0.49% NZD -0.62% -0.46% -0.72% -0.41% -0.61% -0.03% -0.52% CHF -0.09% 0.07% -0.18% 0.11% -0.09% 0.49% 0.52% The heat map shows percentage changes of major currencies against each other. The base currency is picked from the left column, while the quote currency is picked from the top row. For example, if you pick the US Dollar from the left column and move along the horizontal line to the Japanese Yen, the percentage change displayed in the box will represent USD (base)/JPY (quote)
Technical analysis: XAU/USD is hovering right above the previous range top, at $2,660
Gold rally is losing steam, with the US Dollar coming up on Tuesday but it remains steady above the top of the last two week’s trading range, at $2,660.
Above here, the next target would be the $2,690 intra-day level, and the November 24 high, at $2,720. A bearish reaction below the mentioned $2,660 would bring the December 9 low, at $2630 back into focus, ahead of the channel bottom (November 26 and December 5 lows), at $2,605.
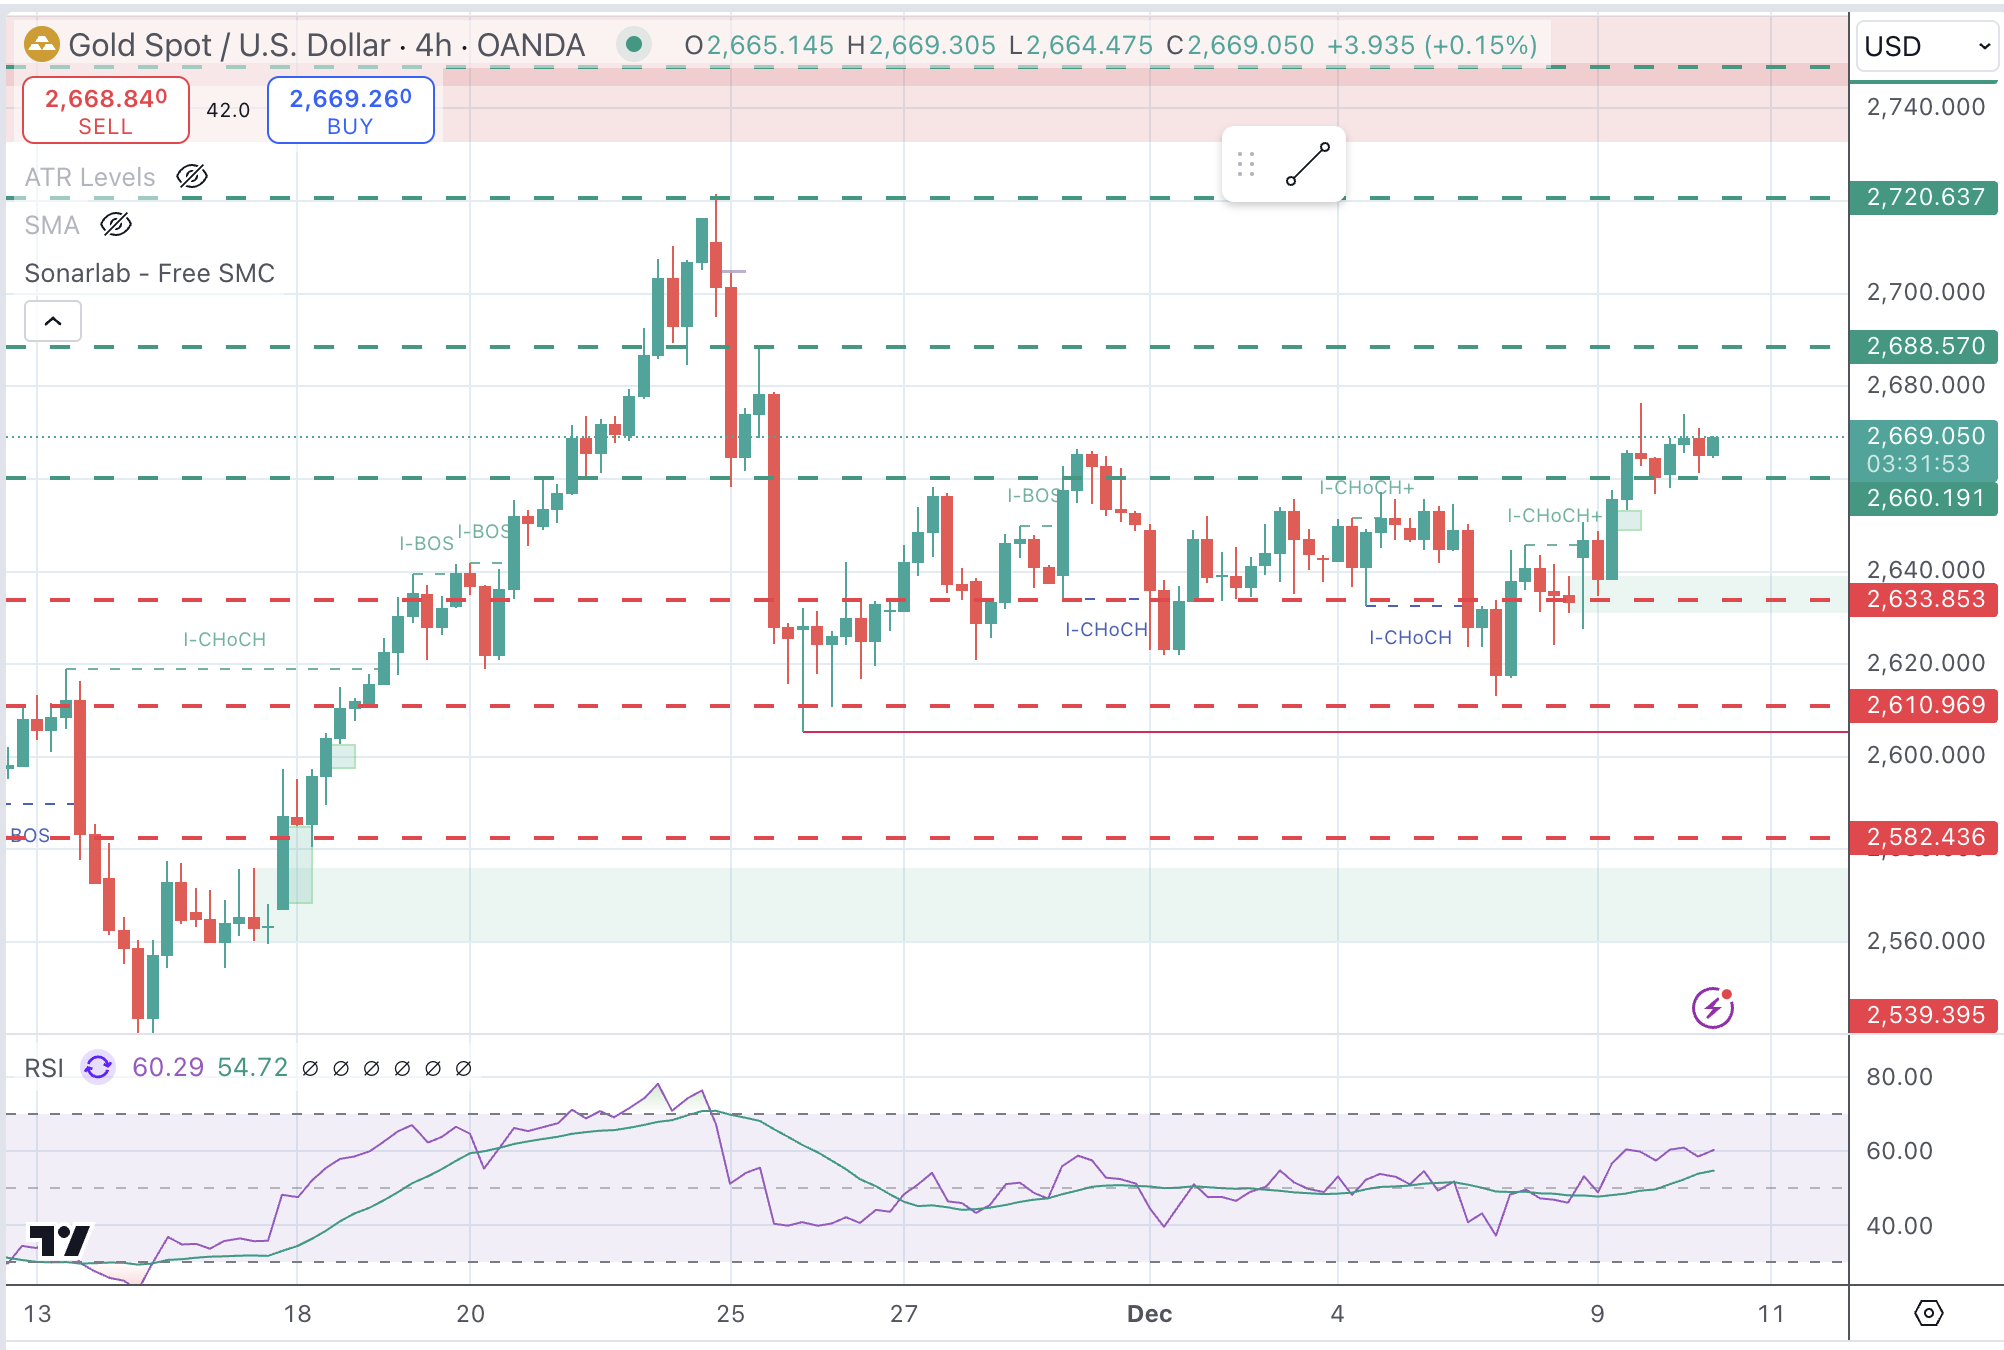
XAU/USD 4-Hour Chart
Inflation FAQs
Inflation measures the rise in the price of a representative basket of goods and services. Headline inflation is usually expressed as a percentage change on a month-on-month (MoM) and year-on-year (YoY) basis. Core inflation excludes more volatile elements such as food and fuel which can fluctuate because of geopolitical and seasonal factors. Core inflation is the figure economists focus on and is the level targeted by central banks, which are mandated to keep inflation at a manageable level, usually around 2%.
The Consumer Price Index (CPI) measures the change in prices of a basket of goods and services over a period of time. It is usually expressed as a percentage change on a month-on-month (MoM) and year-on-year (YoY) basis. Core CPI is the figure targeted by central banks as it excludes volatile food and fuel inputs. When Core CPI rises above 2% it usually results in higher interest rates and vice versa when it falls below 2%. Since higher interest rates are positive for a currency, higher inflation usually results in a stronger currency. The opposite is true when inflation falls.
Although it may seem counter-intuitive, high inflation in a country pushes up the value of its currency and vice versa for lower inflation. This is because the central bank will normally raise interest rates to combat the higher inflation, which attract more global capital inflows from investors looking for a lucrative place to park their money.
Formerly, Gold was the asset investors turned to in times of high inflation because it preserved its value, and whilst investors will often still buy Gold for its safe-haven properties in times of extreme market turmoil, this is not the case most of the time. This is because when inflation is high, central banks will put up interest rates to combat it. Higher interest rates are negative for Gold because they increase the opportunity-cost of holding Gold vis-a-vis an interest-bearing asset or placing the money in a cash deposit account. On the flipside, lower inflation tends to be positive for Gold as it brings interest rates down, making the bright metal a more viable investment alternative.
Read more
* The content presented above, whether from a third party or not, is considered as general advice only. This article should not be construed as containing investment advice, investment recommendations, an offer of or solicitation for any transactions in financial instruments.


