


Silver Price Forecast: XAG/USD drops over 1%, bears need to wait for weakness below $33.00


Silver kicks off the new week on a weaker note, albeit manages to hold above the $33.00 mark.
The technical setup warrants caution for bears and before positioning for any further losses.
A sustained break below the $33.00 mark should pave the way for some meaningful correction.
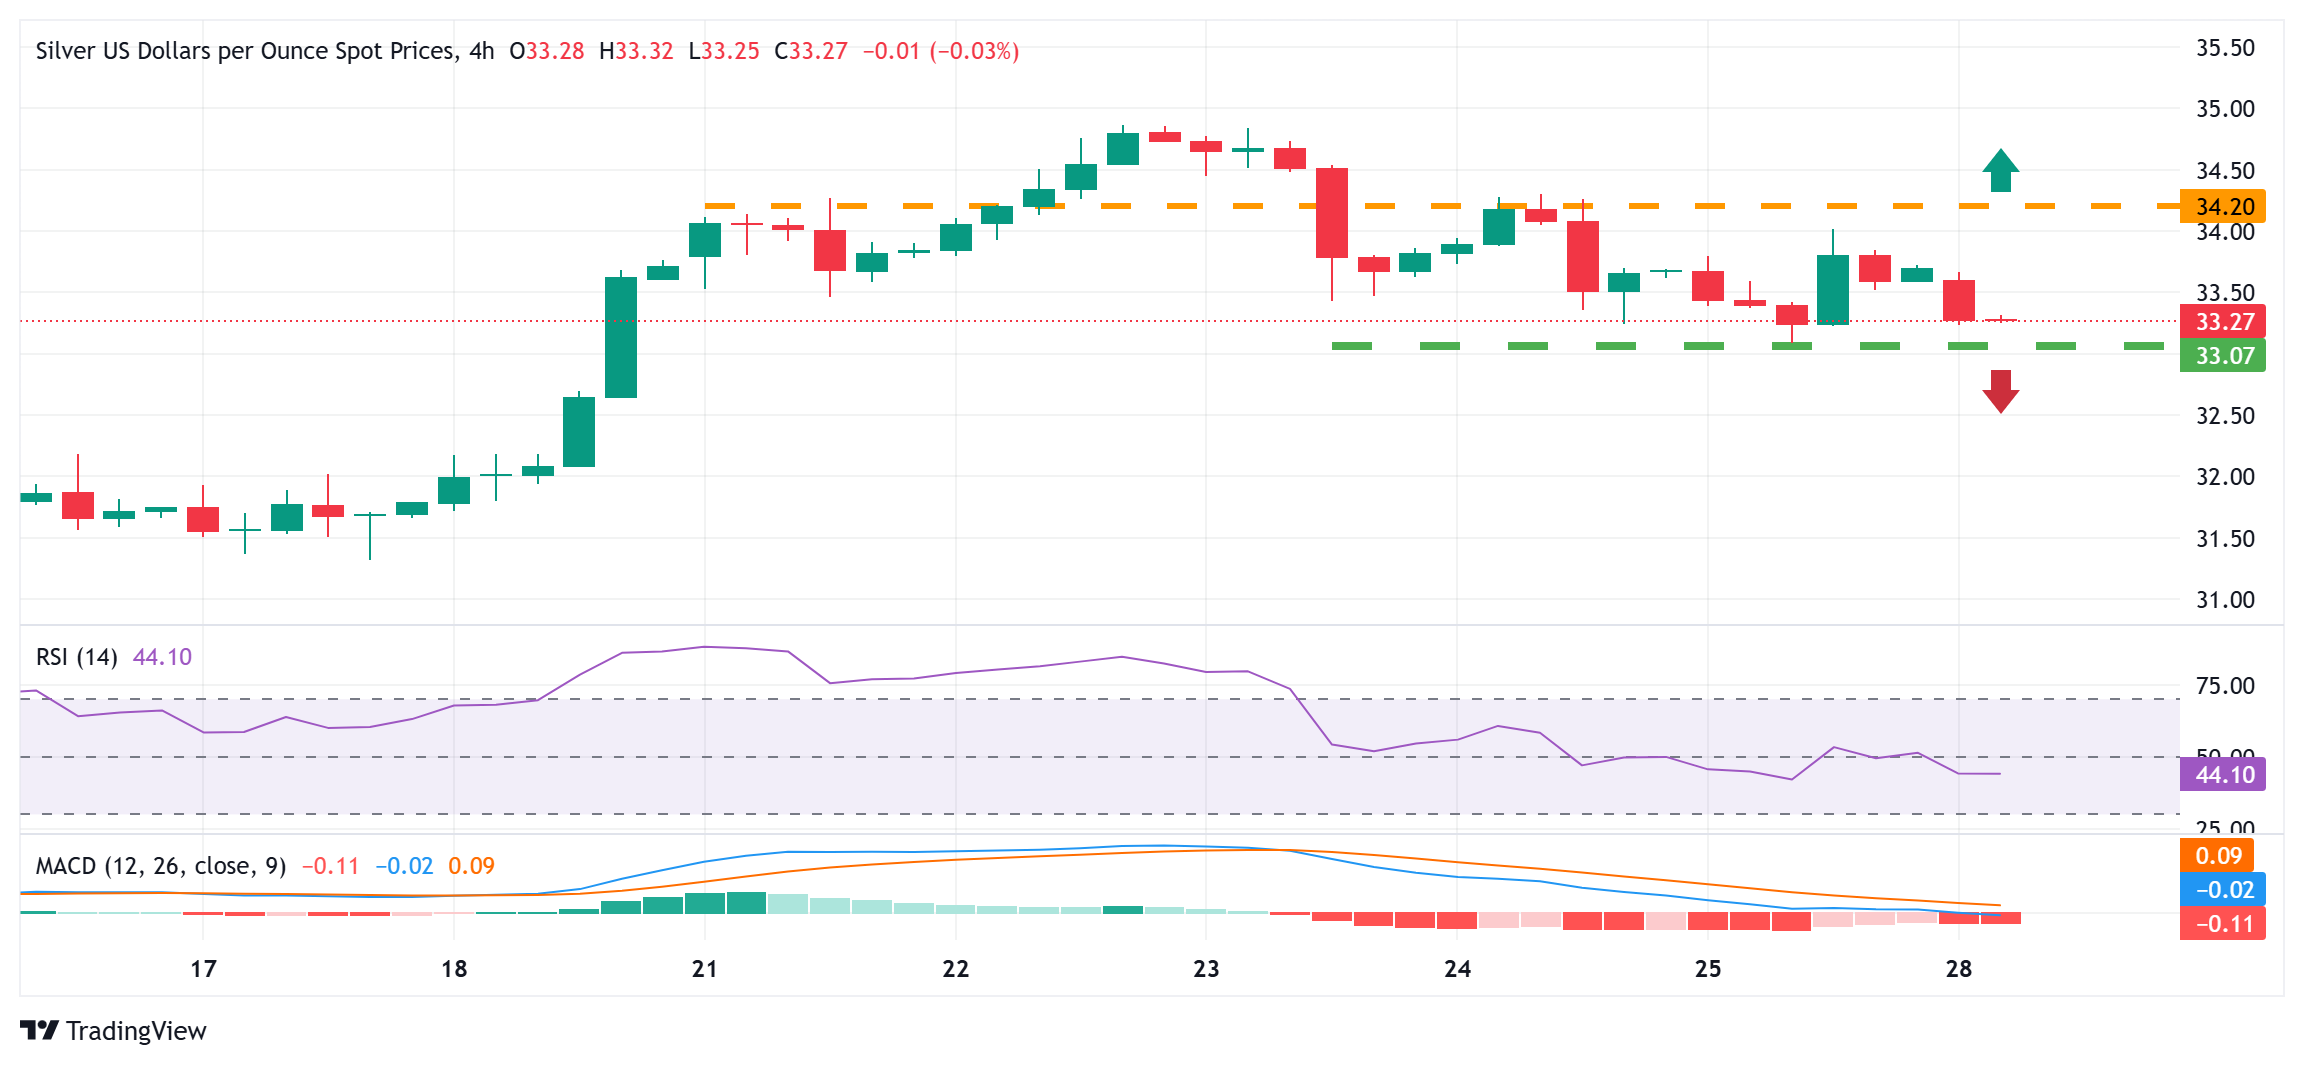
Silver (XAG/USD) attracts fresh sellers during the Asian session on Monday and currently trades around the $33.30 area, down nearly 1.25% for the day. The white metal, however, manages to hold above a one-week low, around the $33.10-$33.00 area, set on Friday, warranting some caution for bearish traders.
Moreover, technical indicators on the daily chart – though have been losing positive traction – are holding in positive territory. This further makes it prudent to wait for a convincing break below the $33.00 mark before positioning for an extension of last week's pullback from the highest level since October 2012. Some follow-through selling below the $32.75-$32.65 resistance-turned-support will reaffirm the negative bias and make the XAG/USD vulnerable.
The subsequent downfall might expose the $32.20-$32.15 intermediate support before the white metal drops to the $32.00 round figure and the $31.70-$31.65 region. The downward trajectory could extend further and drag the XAG/USD towards the $31.00 mark en route to the $30.50 area and the monthly swing low, close to the $30.00 psychological mark tested on October 8.
On the flip side, the $33.65 horizontal zone now seems to have emerged as an immediate hurdle, above which the XAG/USD is likely to reclaim the $34.00 mark and climb further towards the $34.30-$34.35 supply zone. The momentum could extend further and allow bulls to make a fresh attempt to conquer the $35.00 psychological mark before aiming to challenge the October 2012 swing high, around the $35.35-$35.40 region.
Silver 4-hour chart
Read more
* The content presented above, whether from a third party or not, is considered as general advice only. This article should not be construed as containing investment advice, investment recommendations, an offer of or solicitation for any transactions in financial instruments.


