

- Markets in 2026: Will gold, Bitcoin, and the U.S. dollar make history again? — These are how leading institutions think
- Trump says Venezuela's Maduro deposed, captured after US strikes
- Bitcoin Price Surges To $90,000. U.S. Arrests Venezuela's President, Triggers Bull Frenzy
- After Upheaval in the World’s Largest Oil Reserve Holder, Who Will Emerge as the Biggest Winner in Venezuela’s Oil Market?
- U.S. to freeze and take control of Venezuela's Bitcoin holdings after Maduro capture
- Ethereum Price Forecast: Accumulation addresses post record inflows in December despite high selling pressure
Silver extended losses on risk aversion, reaching two-week lows at $49.20.
Hopes of a de-escalation of the US-China trade rift have boosted risk appetite, hammering precious metals.
XAG/USD has broken the neckline of a bearish H&S pattern, targeting levels right above $46.00.
Silver is finally correcting lower. Market expectations that the US and China will de-escalate trade tensions are boosting the US Dollar’s recovery and hurting precious metals. Silver has extended its reversal from last week's highs at the $55.00 area, to session lows near $49.00 so far.
US President Trump soothed markets on Monday, announcing that he was planning to meet his Chinese counterpart Xi Jinping next week, and that he expected to reach a “fair deal” which would lead to a good trade relationship between the two countries. These comments tackled fears of a trade war and have sent the US Dollar rallying across the board.
Technical analysis: A bearish H&S pattern is in play
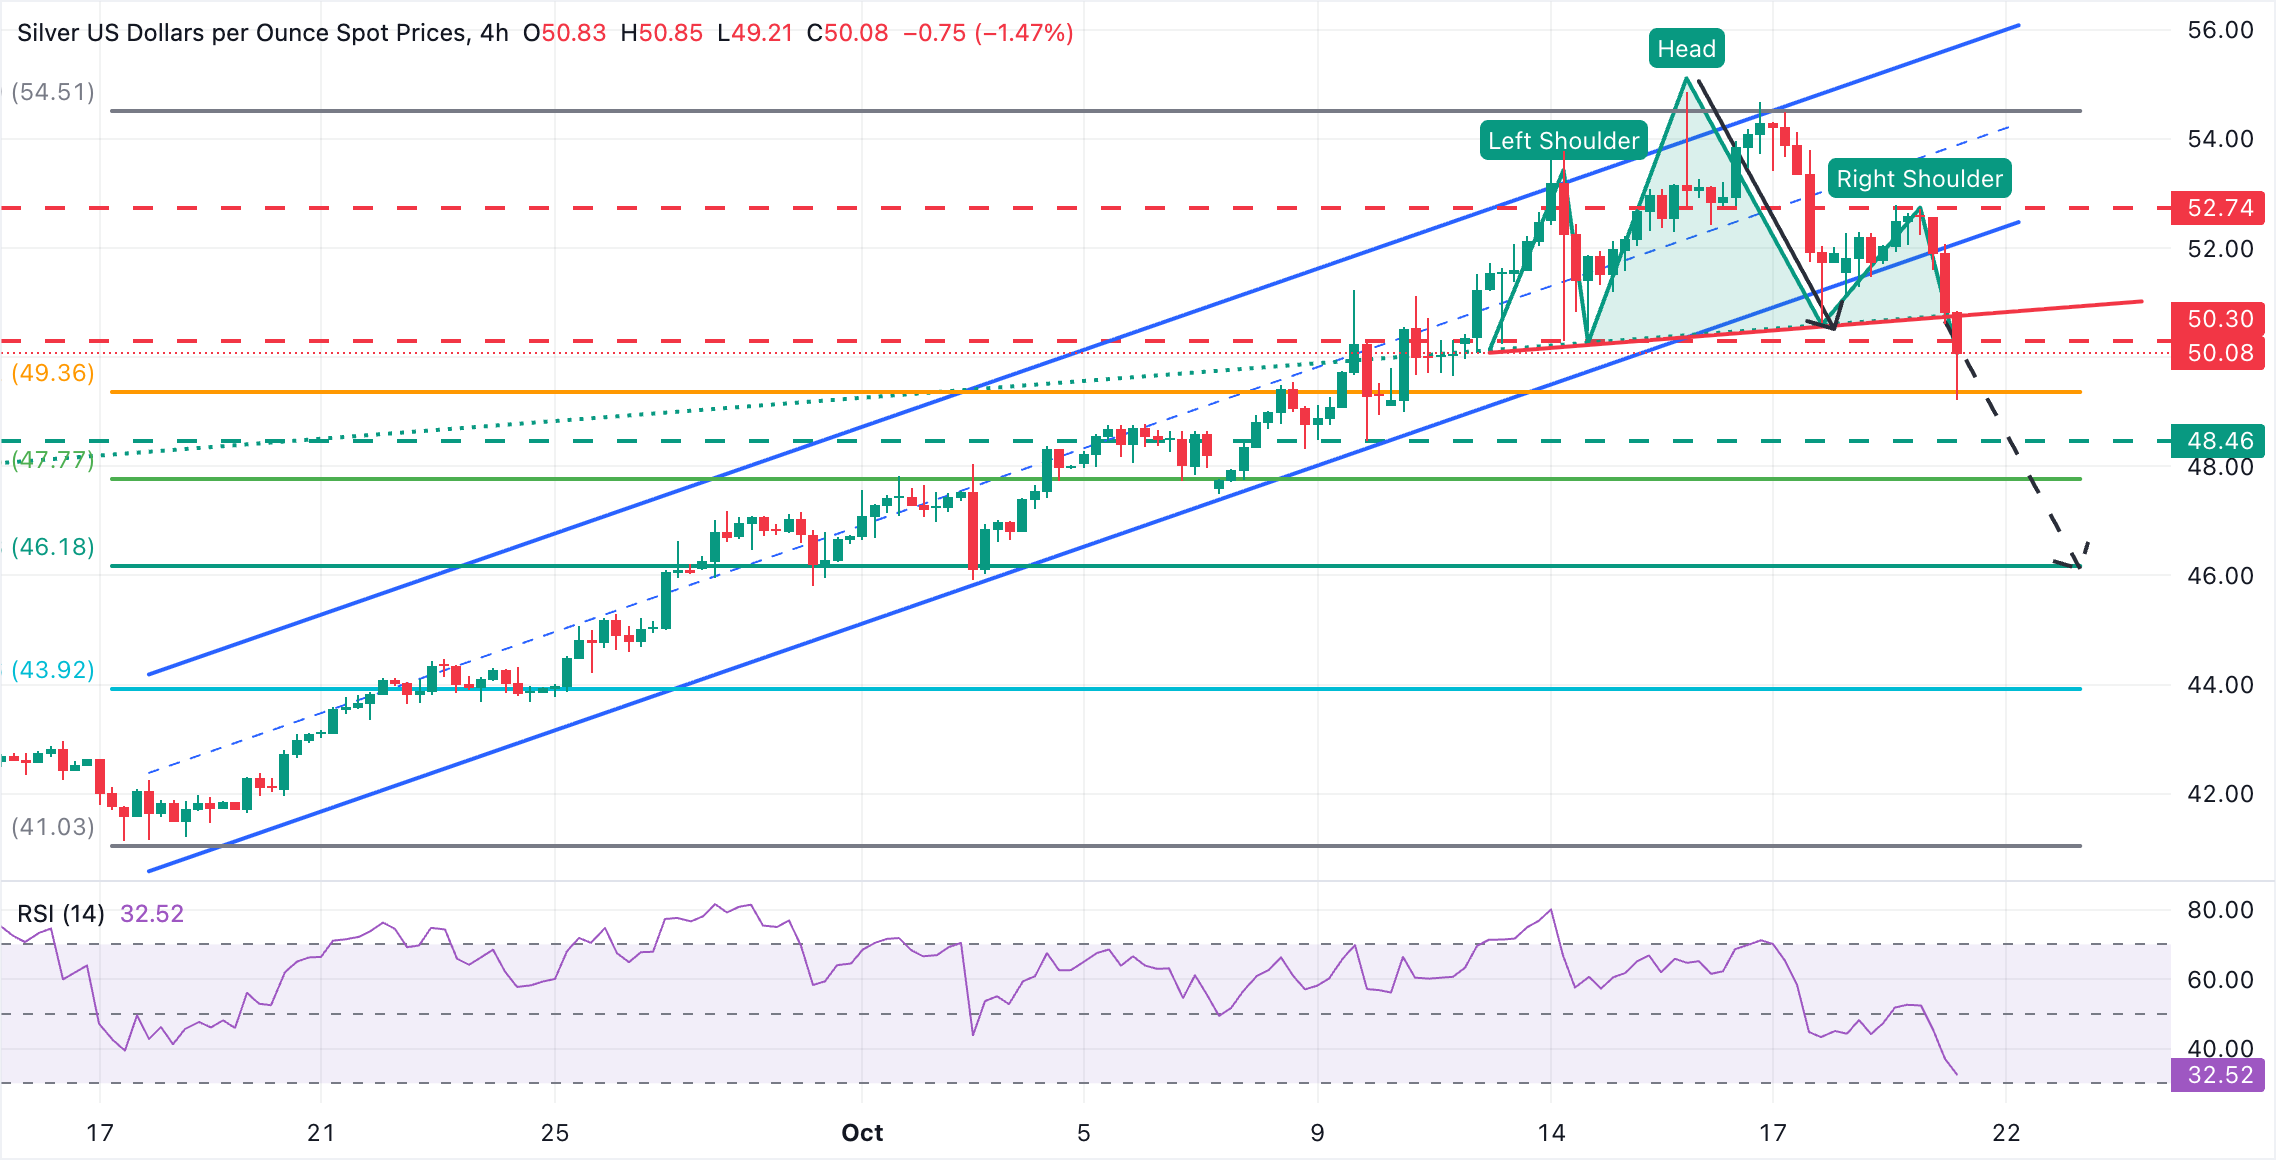
Silver has broken below the base of the ascending channel from mid-September lows and extended losses below the neckline of a bearish Head & Shoulders, a common figure in trend shifts, at the $50.71 area.
The pair is attempting to return above the $50.00 psychological level at the time of writing, and is likely to retest the mentioned H&S neckline, which might act as a resistance now, at the 50.80 area. Further up, the target would be the reverse trendline, near 52.10.
To the downside, intra-day lows are at $49.20 ahead of the October 9 low, at $48.45. The H&S pattern’s measured target is coincident with the 61.8% Fibonacci retracement of the September-October rally, at $46.15.
Read more
* The content presented above, whether from a third party or not, is considered as general advice only. This article should not be construed as containing investment advice, investment recommendations, an offer of or solicitation for any transactions in financial instruments.


