


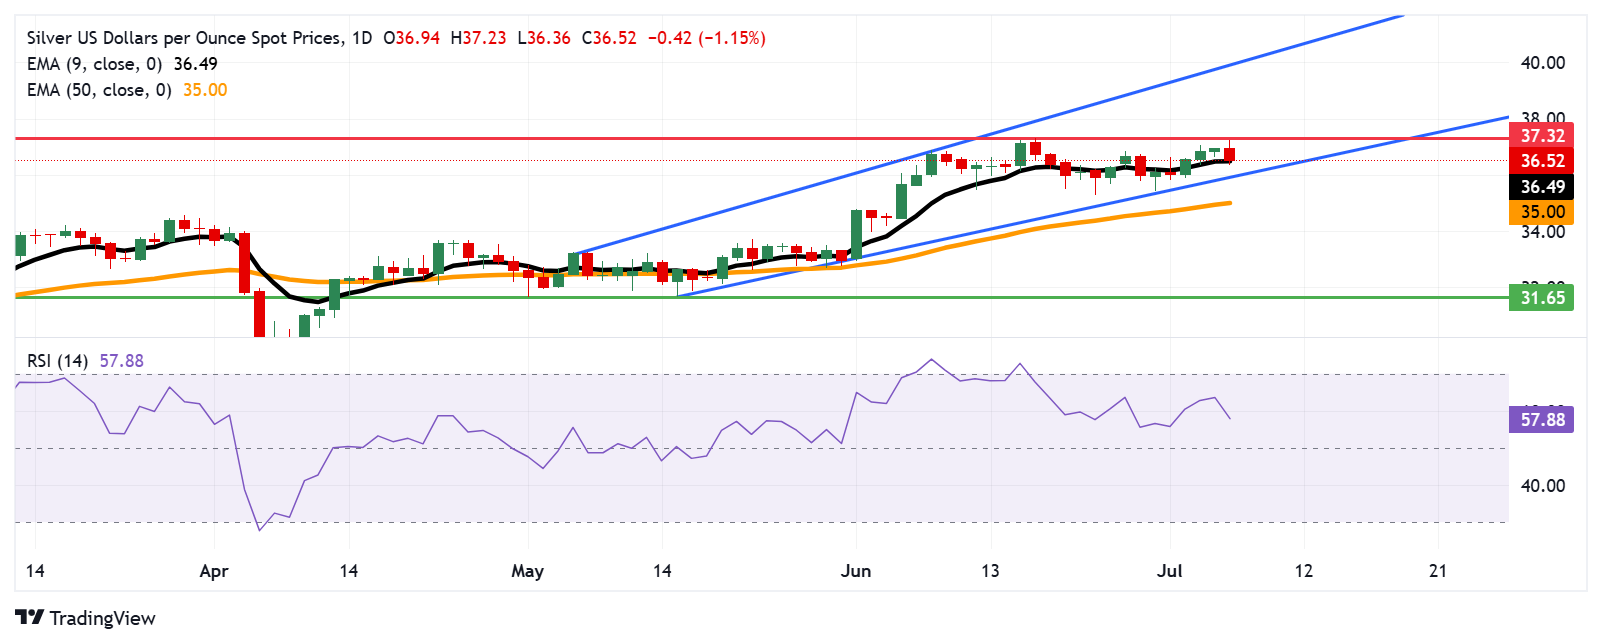
Silver price may approach $37.32, the highest since February 2012.
The bullish bias strengthens as the 14-day Relative Strength Index holds above the 50 mark.
The nine-day EMA at $36.49 acts as the immediate support.
Silver price (XAG/USD) edges lower after halting a three-day winning streak, trading around $36.50 per troy ounce, down by more than 1%, during the European hours on Monday. The technical analysis of the daily chart suggests the price of the precious metal remains within an ascending channel pattern, indicating a bullish bias is prevailing.
The 14-day Relative Strength Index (RSI) remains above the 50 level, strengthening a bullish outlook. However, Silver price is trading slightly above the nine-day Exponential Moving Average (EMA), but appears poised to break below it, indicating potential weakening of short-term price momentum.
On the upside, the XAG/USD pair may retest $37.32, the highest since February 2012. A successful breach above this level could support the Silver price to explore the region around the upper boundary of the ascending channel around the psychological level of $39.90.
The Silver price is testing the immediate support at the nine-day EMA of $36.49. A break below this level could weaken the short-term price momentum and put downward pressure on the pair to navigate the area around the ascending channel’s lower boundary at $36.00 level, followed by the 50-day EMA at $35.00.
Further declines would weaken the medium-term price momentum and prompt the price of Silver to navigate the region around the two-month low at $31.65, which was recorded on May 15.
XAG/USD: Daily Chart
* The content presented above, whether from a third party or not, is considered as general advice only. This article should not be construed as containing investment advice, investment recommendations, an offer of or solicitation for any transactions in financial instruments.


