




Ethereum Intraday: below its lower Bollinger band
Ethereum (ETH/USD)
-26.26-1.40%
the downside prevails as long as 1878 is resistance.
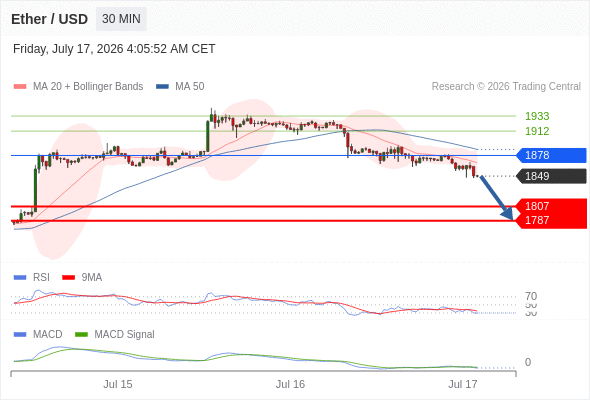
Our pivot point is at 1878.
Our preference: the downside prevails as long as 1878 is resistance.
Alternative scenario: the upside breakout of 1878, would call for 1912 and 1933.
Comment: the RSI is trading below 30. This could mean that either the price is in a lasting downtrend or just oversold and that therefore a rebound could shape (look for bullish divergence in this case). The MACD is below its signal line and negative. The configuration is negative. Moreover, the price stands below its 20 and 50 period moving average (respectively at 1868 and 1886). Finally, the Ether / Dollar has penetrated its lower Bollinger band (1851).
Supports and resistances:
1933 **
1912 *
1878 **
1849 last
1807
1787 **
1766 *
Our preference: the downside prevails as long as 1878 is resistance.
Alternative scenario: the upside breakout of 1878, would call for 1912 and 1933.
Comment: the RSI is trading below 30. This could mean that either the price is in a lasting downtrend or just oversold and that therefore a rebound could shape (look for bullish divergence in this case). The MACD is below its signal line and negative. The configuration is negative. Moreover, the price stands below its 20 and 50 period moving average (respectively at 1868 and 1886). Finally, the Ether / Dollar has penetrated its lower Bollinger band (1851).
Supports and resistances:
1933 **
1912 *
1878 **
1849 last
1807
1787 **
1766 *
Disclaimer: References, analysis and trading strategies are provided by the third-party provider, Trading Central, and the point of view is based on the independent assessment and judgment of the analyst, without considering the investment objectives and financial situation of the investors. All strategic opinions do not constitute investment advice or recommendations and are for references only. Our company also does not guarantee the accuracy of the strategic views and does not take any responsibility for the negative results caused by the trading strategies.

