




Microsoft Stock Forecast: MSFT Pulls Back From $546.35 as Azure's 45% Guide Faces the AI Spending Test
TradingKey - Microsoft (NASDAQ: MSFT) heads into next week’s earnings after getting caught in Thursday’s AI and chip selloff, when it fell 2.23% to $521.08 on October 22. The stock is about 6% below its 52-week high of $553.72 but still about 33% above its July 29 close of $390.54.
Microsoft reports fiscal first-quarter results after the close next Wednesday, October 28, with the call at 5:30 p.m. ET. It reports a week after Meta's numbers revived fears about AI spending, so the question is less about demand and more about who pays for the buildout.
What the Street Expects
Analysts expect EPS of about $4.71, up 14% from $4.13 a year earlier, on revenue of about $90.62 billion, up from $77.67 billion. Microsoft has beaten EPS estimates in each of its last eight quarters, according to MarketBeat.
Microsoft's Own Guide Sets the Bar
Microsoft guided Azure growth to about 45% at constant currency, which strips out exchange-rate moves, up from 43% in fiscal Q4. It expects Intelligent Cloud revenue, the segment that includes Azure, of $40.95 billion to $41.25 billion, up 33% to 34%. Capex, the money spent on data centers and equipment, should top $50 billion in the quarter, a figure that includes the effect of a lease reclassification.
For the full fiscal year, management expects operating margins to fall by less than one point and free cash flow, the cash left after operating costs and capital spending, to stay positive.
Fiscal Q4 Left a High Bar
In July, Microsoft reported revenue of $90.0 billion, up 18%, and adjusted EPS, which leaves out gains and losses from its OpenAI stake, of $4.74, up 23%. Microsoft Cloud revenue rose 27% to $59.3 billion, and Azure passed $100 billion in annual revenue for the first time. Commercial remaining performance obligation, contracted revenue not yet booked, jumped 84% to $678 billion. Management said "demand continues to exceed available capacity." The stock rose about 8% after hours on that report.
Why Microsoft's AI Spending Looks Different From Meta's
Meta posted negative free cash flow last quarter, and its data centers serve mainly its own apps, so that spending has to pay off through its ad business. Microsoft rents much of its new capacity to outside customers through Azure, so those customers help pay for the buildout, and the $678 billion of contracted revenue sits behind it.
The spending is still huge. Microsoft spent about $115.9 billion on property and equipment in fiscal 2026, up from $64.6 billion a year earlier. That is why October 28 is a test of returns on that spending, not a test of demand.
Thursday's trading supports that reading. The Philadelphia Semiconductor Index dropped 6.72% and the Nasdaq fell 2.60%, but Microsoft lost a more modest 2.23%.
OpenAI Exposure and Valuation
Microsoft holds about 27% of OpenAI. Keeping that stake out of adjusted results isolates the core business, but it can make headline GAAP figures swing. The stock trades at about 26 times forward earnings. The average analyst target sits around $592 to $599. Melius Research has a $665 target, Rothschild & Co Redburn holds the main bear call at $440, and Phillip Securities cut the stock to Hold on October 12.
Microsoft Technical Analysis: Daily Close Above $546.35 Could Open $572.41
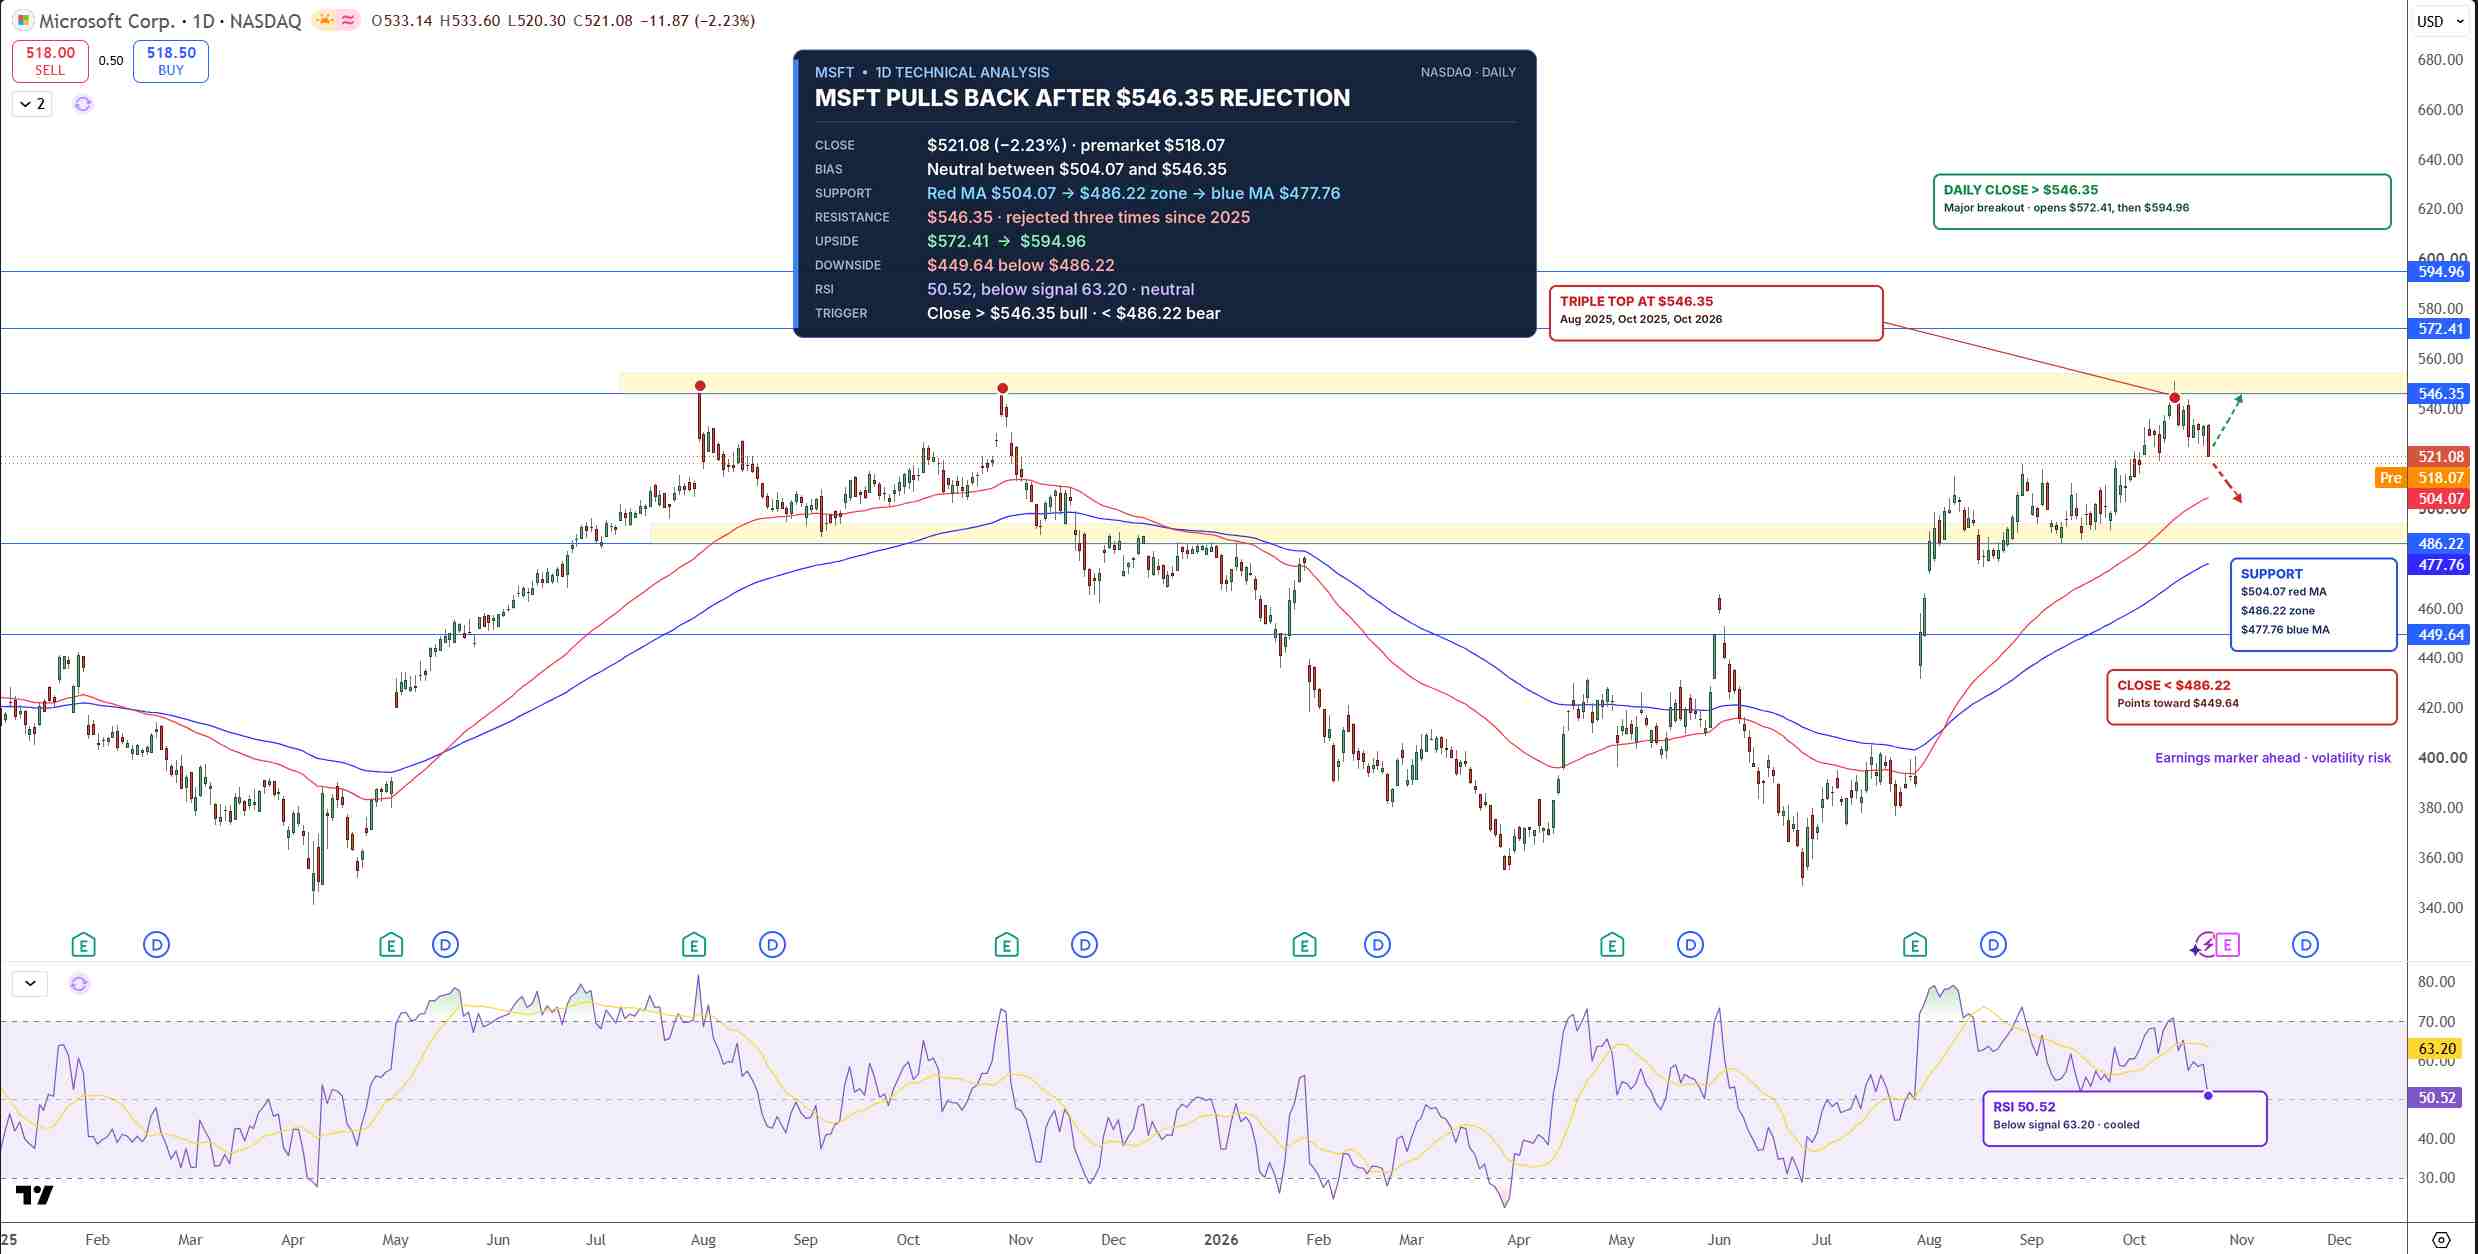
On the daily chart, MSFT turned lower again near $546.35, a resistance level that has capped the stock three times since last year. Resistance is a price where selling has repeatedly stopped rallies. Even the push to the $553.72 high could not hold above it. The bigger trend is still up, because price stays above both moving averages, which track the average price over a set period, at $504.07 and $477.76.
RSI, a momentum gauge that runs from 0 to 100, has dropped to about 50, its neutral midpoint, so the recent rally has lost steam without turning bearish.
MSFT Price Chart - Source: Tradingview
A daily close above $546.35 would be a major breakout and open the way for $572.41, then $594.96. On the downside, $504.07 is the first support, where buyers would be expected to step in, followed by the $486.22 zone. A close below $486.22 would open $449.64.
In my view, MSFT stays in a neutral range between $504.07 and $546.35 until the October 28 report picks a side.
Key Levels
- Last close: $521.08, down 2.23% on October 22
- Support: $504.07, $486.22, $477.76, $449.64
- Resistance: $546.35, $572.41, $594.96
- RSI: 50.52, at the neutral midpoint
- Bullish trigger: Daily close above $546.35
- Bearish trigger: Daily close below $486.22
FAQs
When does Microsoft report earnings?
Microsoft reports fiscal first-quarter 2027 results after the close on Wednesday, October 28, 2026, with the call at 5:30 p.m. ET. Analysts expect EPS of about $4.71 on revenue of about $90.62 billion.
What is the Microsoft stock forecast before earnings?
The bias is neutral between $504.07 and $546.35. A daily close above $546.35 targets $572.41 and $594.96, while a close below $486.22 opens $449.64.
Bottom Line
Microsoft has a stronger answer than most to the AI spending question, with $678 billion of contracted commercial revenue, but capex above $50 billion means the report has to show returns. The level that matters is $546.35, which has capped the stock three times. I expect a clean daily close above it only if Azure meets or beats the 45% guide, while a drop below $486.22 would turn the picture bearish.
Recommended Articles


