



Cardano Price Forecast: ADA edges higher as derivatives and momentum indicators flag tentative bullish bias

Source Fxstreet
  • Cardano price trades slightly higher on Monday after consolidating the previous week.
  • On-chain data remains largely neutral, while derivatives metrics lean slightly bullish, suggesting cautious optimism.
  • The technical outlook shows fading bearish pressure, with momentum indicators signaling a possible upside move ahead.

Cardano (ADA) trades slightly above $0.250 on Monday after taking a breather in the previous week. Neutral on-chain metrics and slight bullish derivatives data suggest cautious optimism among traders. On the technical side, fading bearish signals suggest a possible recovery for ADA.

Cardano sentiment neutral with slight bullish bias

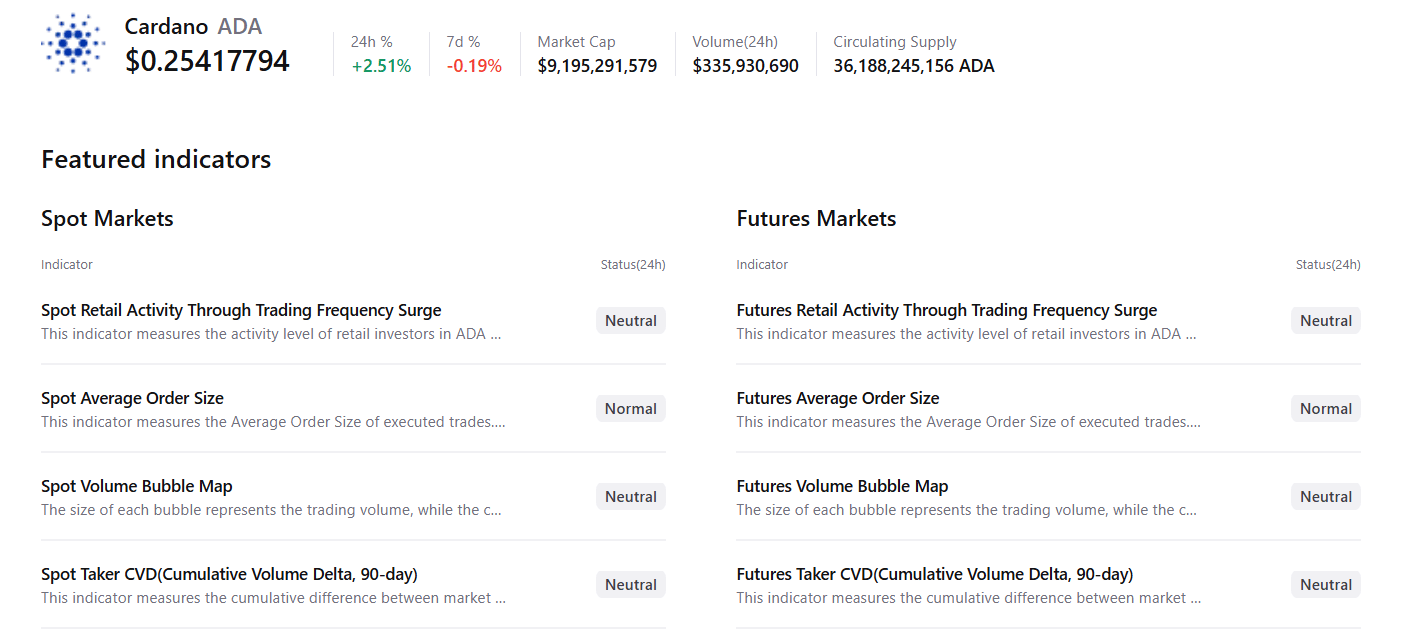
CryptoQuant’s summary data for Cardano shows neutral conditions among spot and futures traders, as shown below, suggesting a lack of strong directional conviction.
On the derivatives side, metrics support a mild bullish bias. CoinGlass’ Open Interest (OI) for ADA rose to $465.52 million on Monday, from $433.60 million on Friday, and has steadily increased since then. This steady increase in OI reflects growing participation and fresh capital entering the market, suggesting a potential upside in ADA.
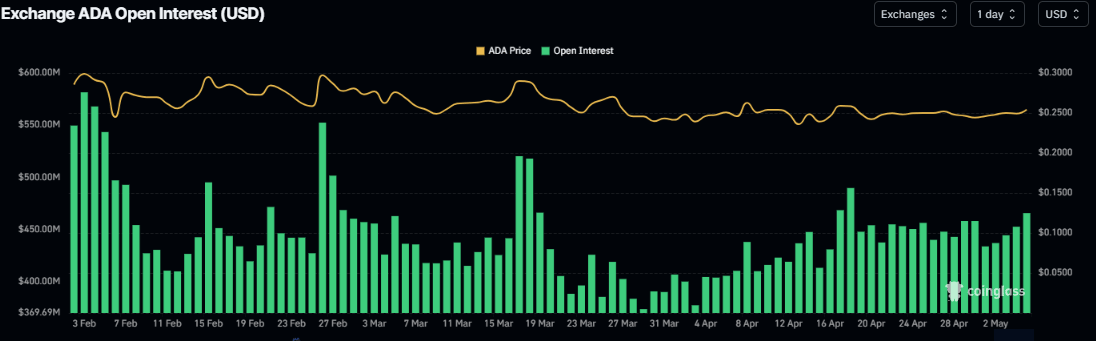
ADA open interest chart. Source: Coinglass

Meanwhile, the funding rates also support improving sentiment. CoinGlass’ OI-Weighted Funding Rate data for Cardano flipped positive on Sunday, reading 0.0072% on Monday. This positive rate indicates that longs are paying shorts and projecting a bullish sentiment.
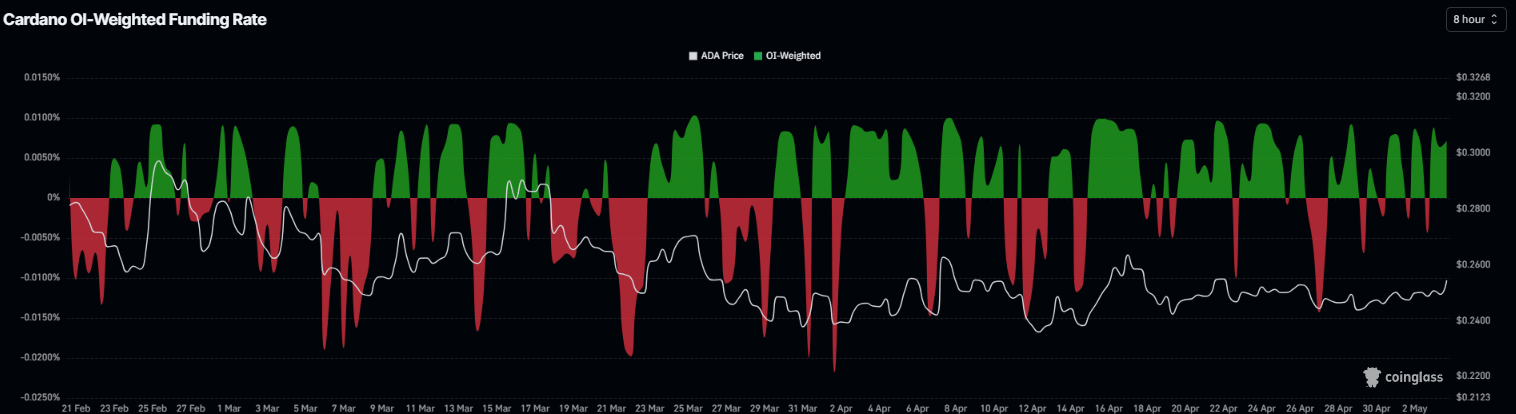
Cardano funding rates chart. Source: Coinglass

Cardano Price Forecast: Momentum indicators fading bearish pressure

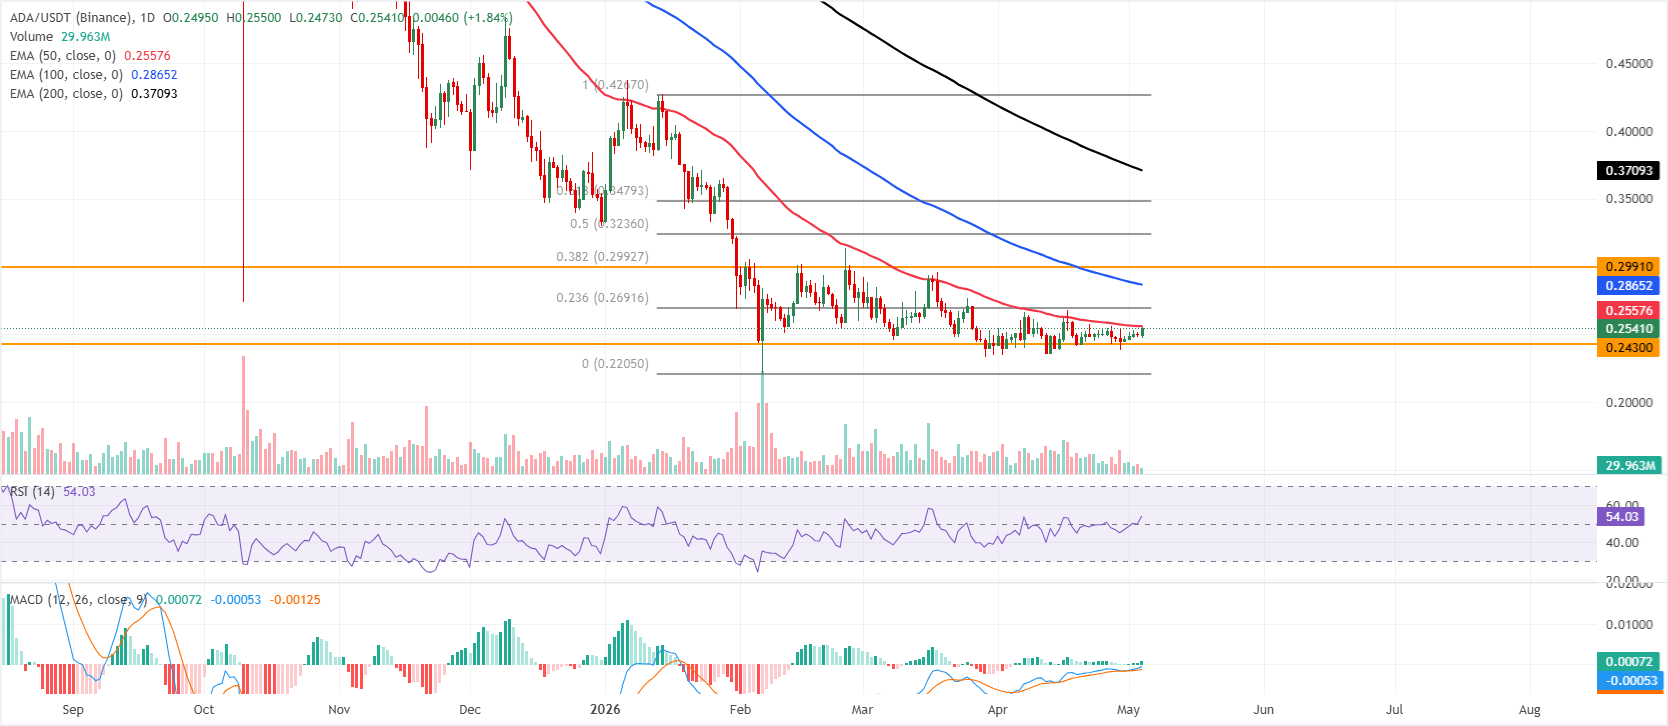
Cardano is trading at $0.253 on Monday, maintaining a neutral-to-slightly bearish near-term bias as price holds below the 50-day exponential moving average (EMA) at $0.255 and remains well below the 100-day and 200-day EMAs at $0.286 and $0.370. This configuration suggests rallies remain capped by layered overhead supply, even as the Relative Strength Index (RSI) at 54 drifts slightly above the midline, hinting at consolidative rather than impulsive downside. The Moving Average Convergence Divergence (MACD) line remains marginally above its signal line, with a small positive histogram, hinting at modest upside attempts but not negating the dominant overhead resistance.

On the topside, immediate resistance is seen at the 50-day EMA near $0.255, with further obstacles at the 23.6% Fibonacci retracement of the latest downswing at $0.269 and the 100-day EMA at $0.286. Higher up, a dense barrier emerges around $0.299, where a horizontal resistance at $0.299 aligns with the 38.2% Fibonacci level at $0.299, ahead of deeper retracement hurdles at $0.323 and $0.347 and the 200-day EMA at $0.370.

On the downside, initial support is at the $0.243 horizontal level; a decisive break below this floor would open the way for a continuation of the broader bearish phase.
(The technical analysis of this story was written with the help of an AI tool.)

Disclaimer: For information purposes only. Past performance is not indicative of future results.
placeholder
KOSPI closes higher as KB Financial and Seoul fund Korea's AI and robotics pushSouth Korea’s KOSPI index closed up roughly 1% for the day on Monday, July 27, as markets reacted to a wave of commitments from the government and private investors buying into the Asian country’s push to claim a stake in regional and global semiconductor, AI  and robotics relevance.  The positive wave that started with Seoul’s...
Author  Cryptopolitan
17 hours ago
South Korea’s KOSPI index closed up roughly 1% for the day on Monday, July 27, as markets reacted to a wave of commitments from the government and private investors buying into the Asian country’s push to claim a stake in regional and global semiconductor, AI  and robotics relevance.  The positive wave that started with Seoul’s...
placeholder
Tesla Stock Breaks Down After Worst Week Since 2022, Charts Point to $296Tesla (TSLA) stock closed last week at $313.03, down nearly 18% in five sessions and its steepest weekly loss since 2022. Two separate chart breakdowns now point to $296 as the next downside target.Th
Author  Beincrypto
17 hours ago
Tesla (TSLA) stock closed last week at $313.03, down nearly 18% in five sessions and its steepest weekly loss since 2022. Two separate chart breakdowns now point to $296 as the next downside target.Th
placeholder
Peter Schiff Says Saylor Just Wiped 66% Off MicroStrategy’s Bitcoin YieldPeter Schiff has a message for Bitcoin bulls. Buy BTC itself, he says, not Michael Saylor’s Strategy stock. The company sold $544.5 million of MSTR shares last week. It bought no Bitcoin.Schiff points
Author  Beincrypto
17 hours ago
Peter Schiff has a message for Bitcoin bulls. Buy BTC itself, he says, not Michael Saylor’s Strategy stock. The company sold $544.5 million of MSTR shares last week. It bought no Bitcoin.Schiff points
placeholder
Ethereum Whales Buy the Bottom as ETF Inflows Return: Is $2,438 Next?Ethereum (ETH) whales keep adding to their holdings while the price trades near $1,963, up 4.3% in the last 24 hours. Three separate datasets now point to an accumulation two weeks after ETH broke its
Author  Beincrypto
17 hours ago
Ethereum (ETH) whales keep adding to their holdings while the price trades near $1,963, up 4.3% in the last 24 hours. Three separate datasets now point to an accumulation two weeks after ETH broke its
placeholder
Entire Market Is Now One Trade, Big Short Investor Steve Eisman SaysSteve Eisman has sold his long-held Google position to cut his artificial intelligence (AI) exposure. The investor who shorted the 2008 housing market now holds cash, warning the whole market has beco
Author  Beincrypto
17 hours ago
Steve Eisman has sold his long-held Google position to cut his artificial intelligence (AI) exposure. The investor who shorted the 2008 housing market now holds cash, warning the whole market has beco
Related Instrument
goTop
quote