




Top Altcoins Forecast: Solana, Injective and Uniswap rebound as bulls stage a comeback
- Solana rises near $74.00, building on the short-term support reinforced at $70.00 and a subtle return of buyers.
- Injective gains more than 8% on Tuesday and trades at $7.50 after reclaiming the 100-day EMA as support.
- Uniswap’s recovery gains momentum above $5.00, but upside remains capped below major moving averages.
The broader cryptocurrency market shows signs of a recovery on Tuesday, after a sharp sell-off in recent weeks. Solana (SOL) is among the major altcoins rising in tandem with Bitcoin (BTC), trading near $74.00.
Injective (INJ), meanwhile, hovers marginally above $7.50 as buyers show interest again from support near $6.50. Uniswap (UNI) gains remain minimal but steady above $5.00.
Altcoins build momentum despite low interest
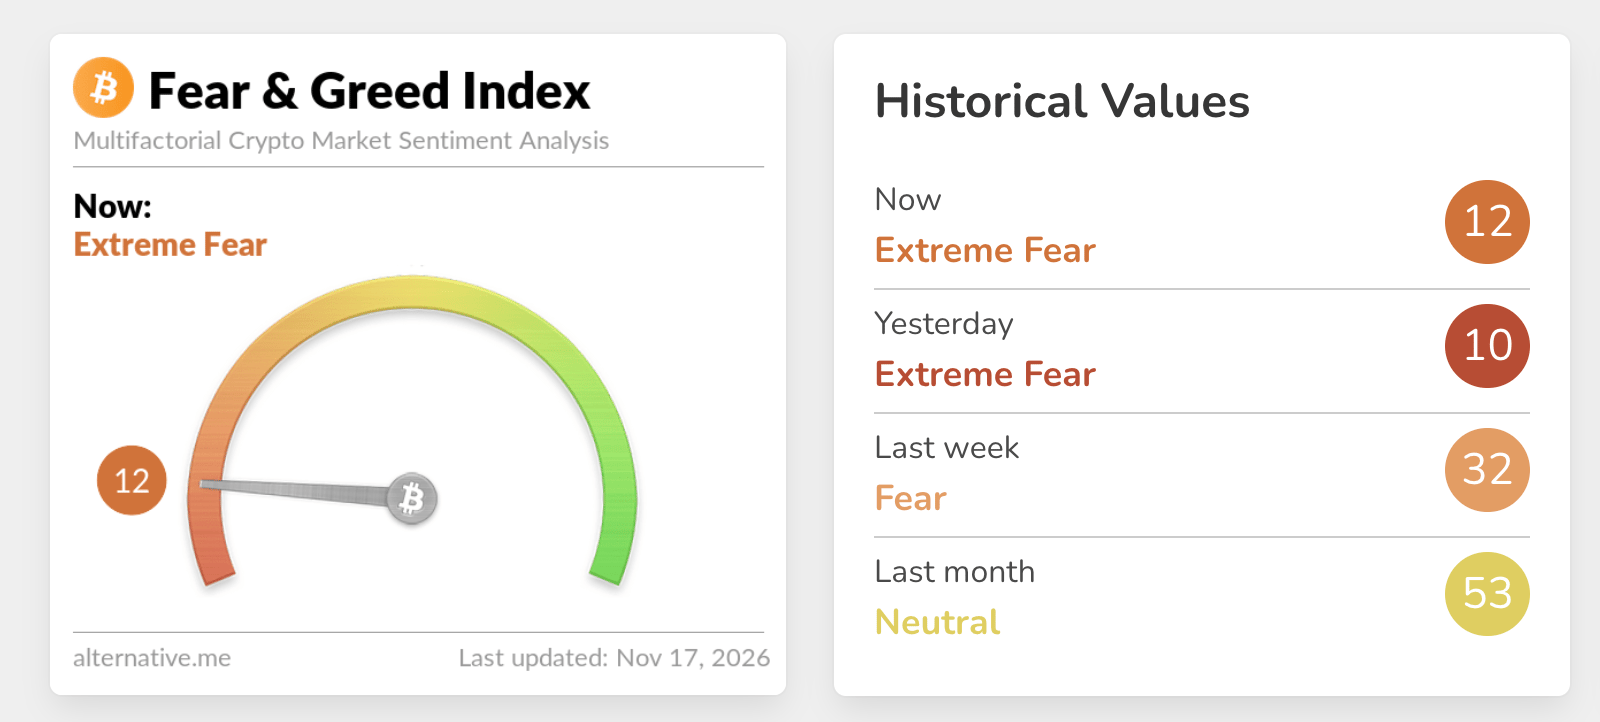
The sudden rise in select altcoins contrasts with the dismal outlook reflected in the Fear & Greed Index, which sits at 12 in Extreme Fear territory on Tuesday, up only slightly from 10 in the same range the previous day.
This setup affirms the subdued investor interest in risk assets. However, oversold conditions could be behind the subtle buy-the-dip demand, raising the odds of a sustained recovery.
Technical analysis: Solana ticks up
Solana trades near $74.00, extending a bearish near-term bias as price holds well below clustered Exponential Moving Averages (EMAs), with the 50-day EMA at $93.80, the 100-day EMA at $95.37 and the 200-day EMA at $95.88 all acting as overhead resistance.
The SuperTrend line at $85.46 reinforces this capped structure, while Moving Average Convergence Divergence (MACD) remains negative and below its signal line, hinting at persistent downside pressure even as the Relative Strength Index (RSI) near 26 signals oversold conditions that could slow the decline rather than reverse it decisively.
Initial resistance lies at the SuperTrend barrier around $85.46, with a more significant supply zone emerging in the $93.80-$95.90 area where the 50-day, 100-day and 200-day EMAs cluster overhead and are likely to limit any corrective bounce.
With no meaningful support levels defined by the current indicator set below spot on the daily chart, the pair would need to reclaim the $85.46 area first and then challenge the EMA cluster to ease the prevailing bearish tone and open the way for a more sustainable recovery.
Injective technical analysis: INJ bulls return as price rises
Injective trades at $7.51 as the token ticks higher, albeit gradually. Still, the pair holds a constructive near-term bias as price remains above a dense layer of moving-average support, with the 50-day EMA just under the market around $7.50 and the 100-day EMA further below near $6.95, suggesting the broader uptrend structure remains intact despite the recent pullback.
Momentum has cooled, with the Relative Strength Index (RSI) hovering just below the midline and the MACD turning negative, hinting that upside advances may be slower and more corrective than impulsive for now.
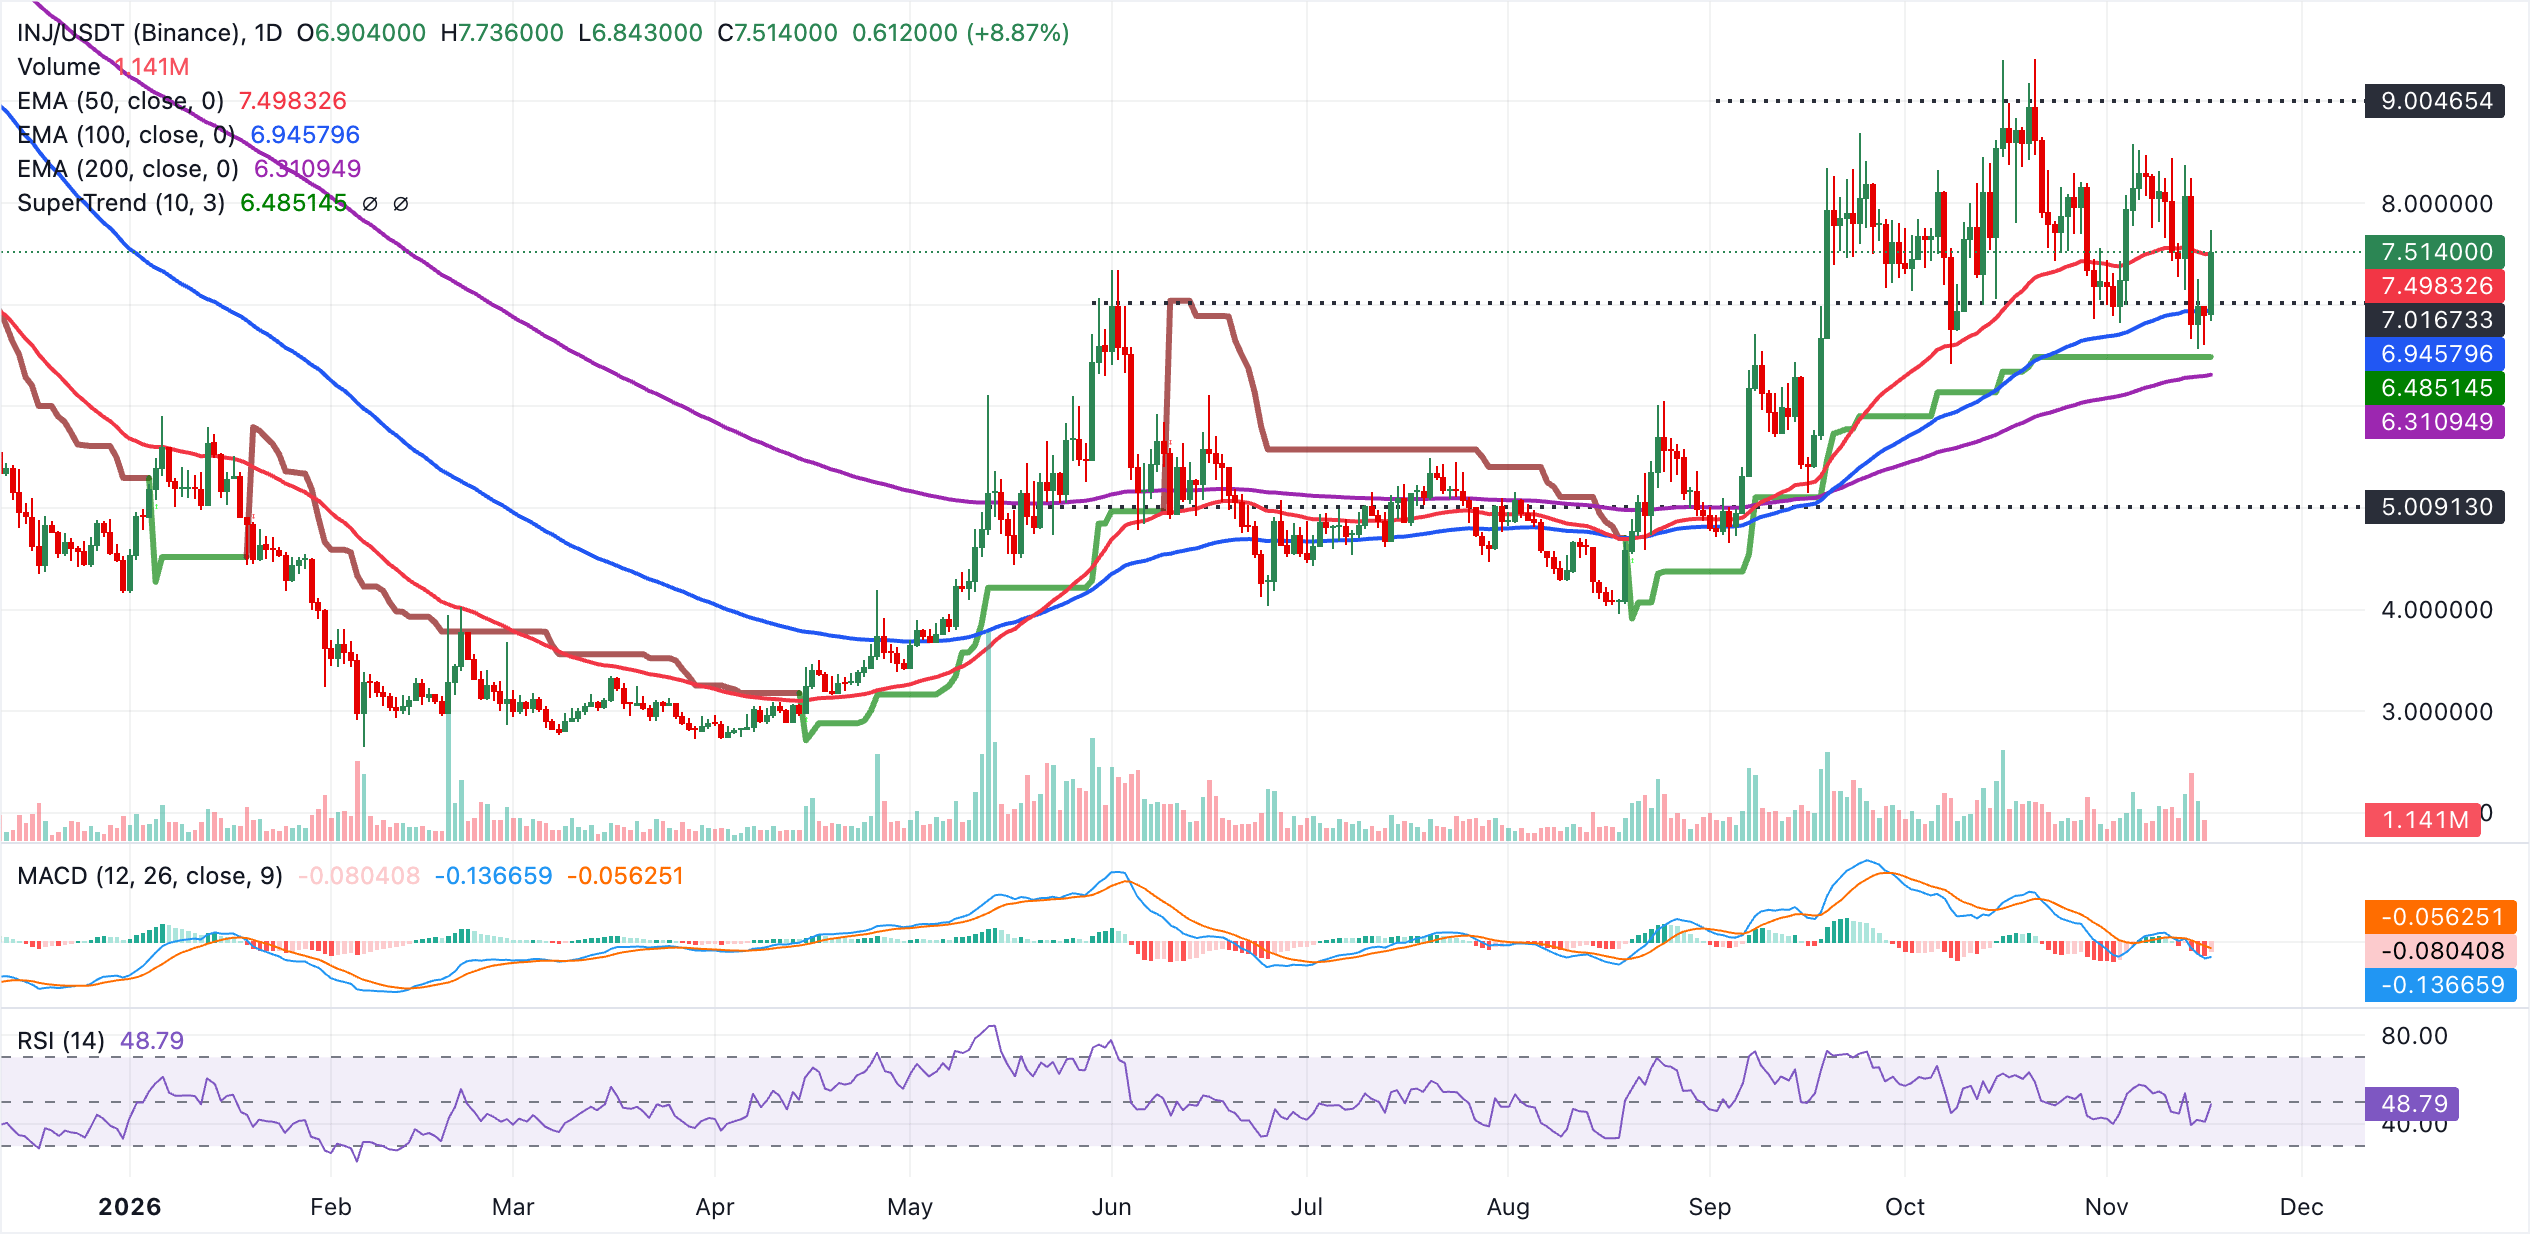
Initial support lies at the 50-day EMA around $7.50. Failure would expose the next cushion at the 100-day EMA near $6.95. Below that, the SuperTrend line at roughly $6.49 and the 200-day EMA around $6.31 form a deeper support band that should act as a key structural floor if selling pressure intensifies.
Technical analysis: Uniswap bulls eye a short-term recovery
Uniswap trades at $5.39, up from the daily open of $5.17. The token is in a corrective phase below key moving averages and under the bearish SuperTrend, which together keep the broader tone capped. The 200-day EMA near $5.74 is the first meaningful dynamic overhead barrier, while the negative MACD and a subdued RSI around 36 suggest sellers still control the move despite the recent bounce from sub-$5.00 levels.
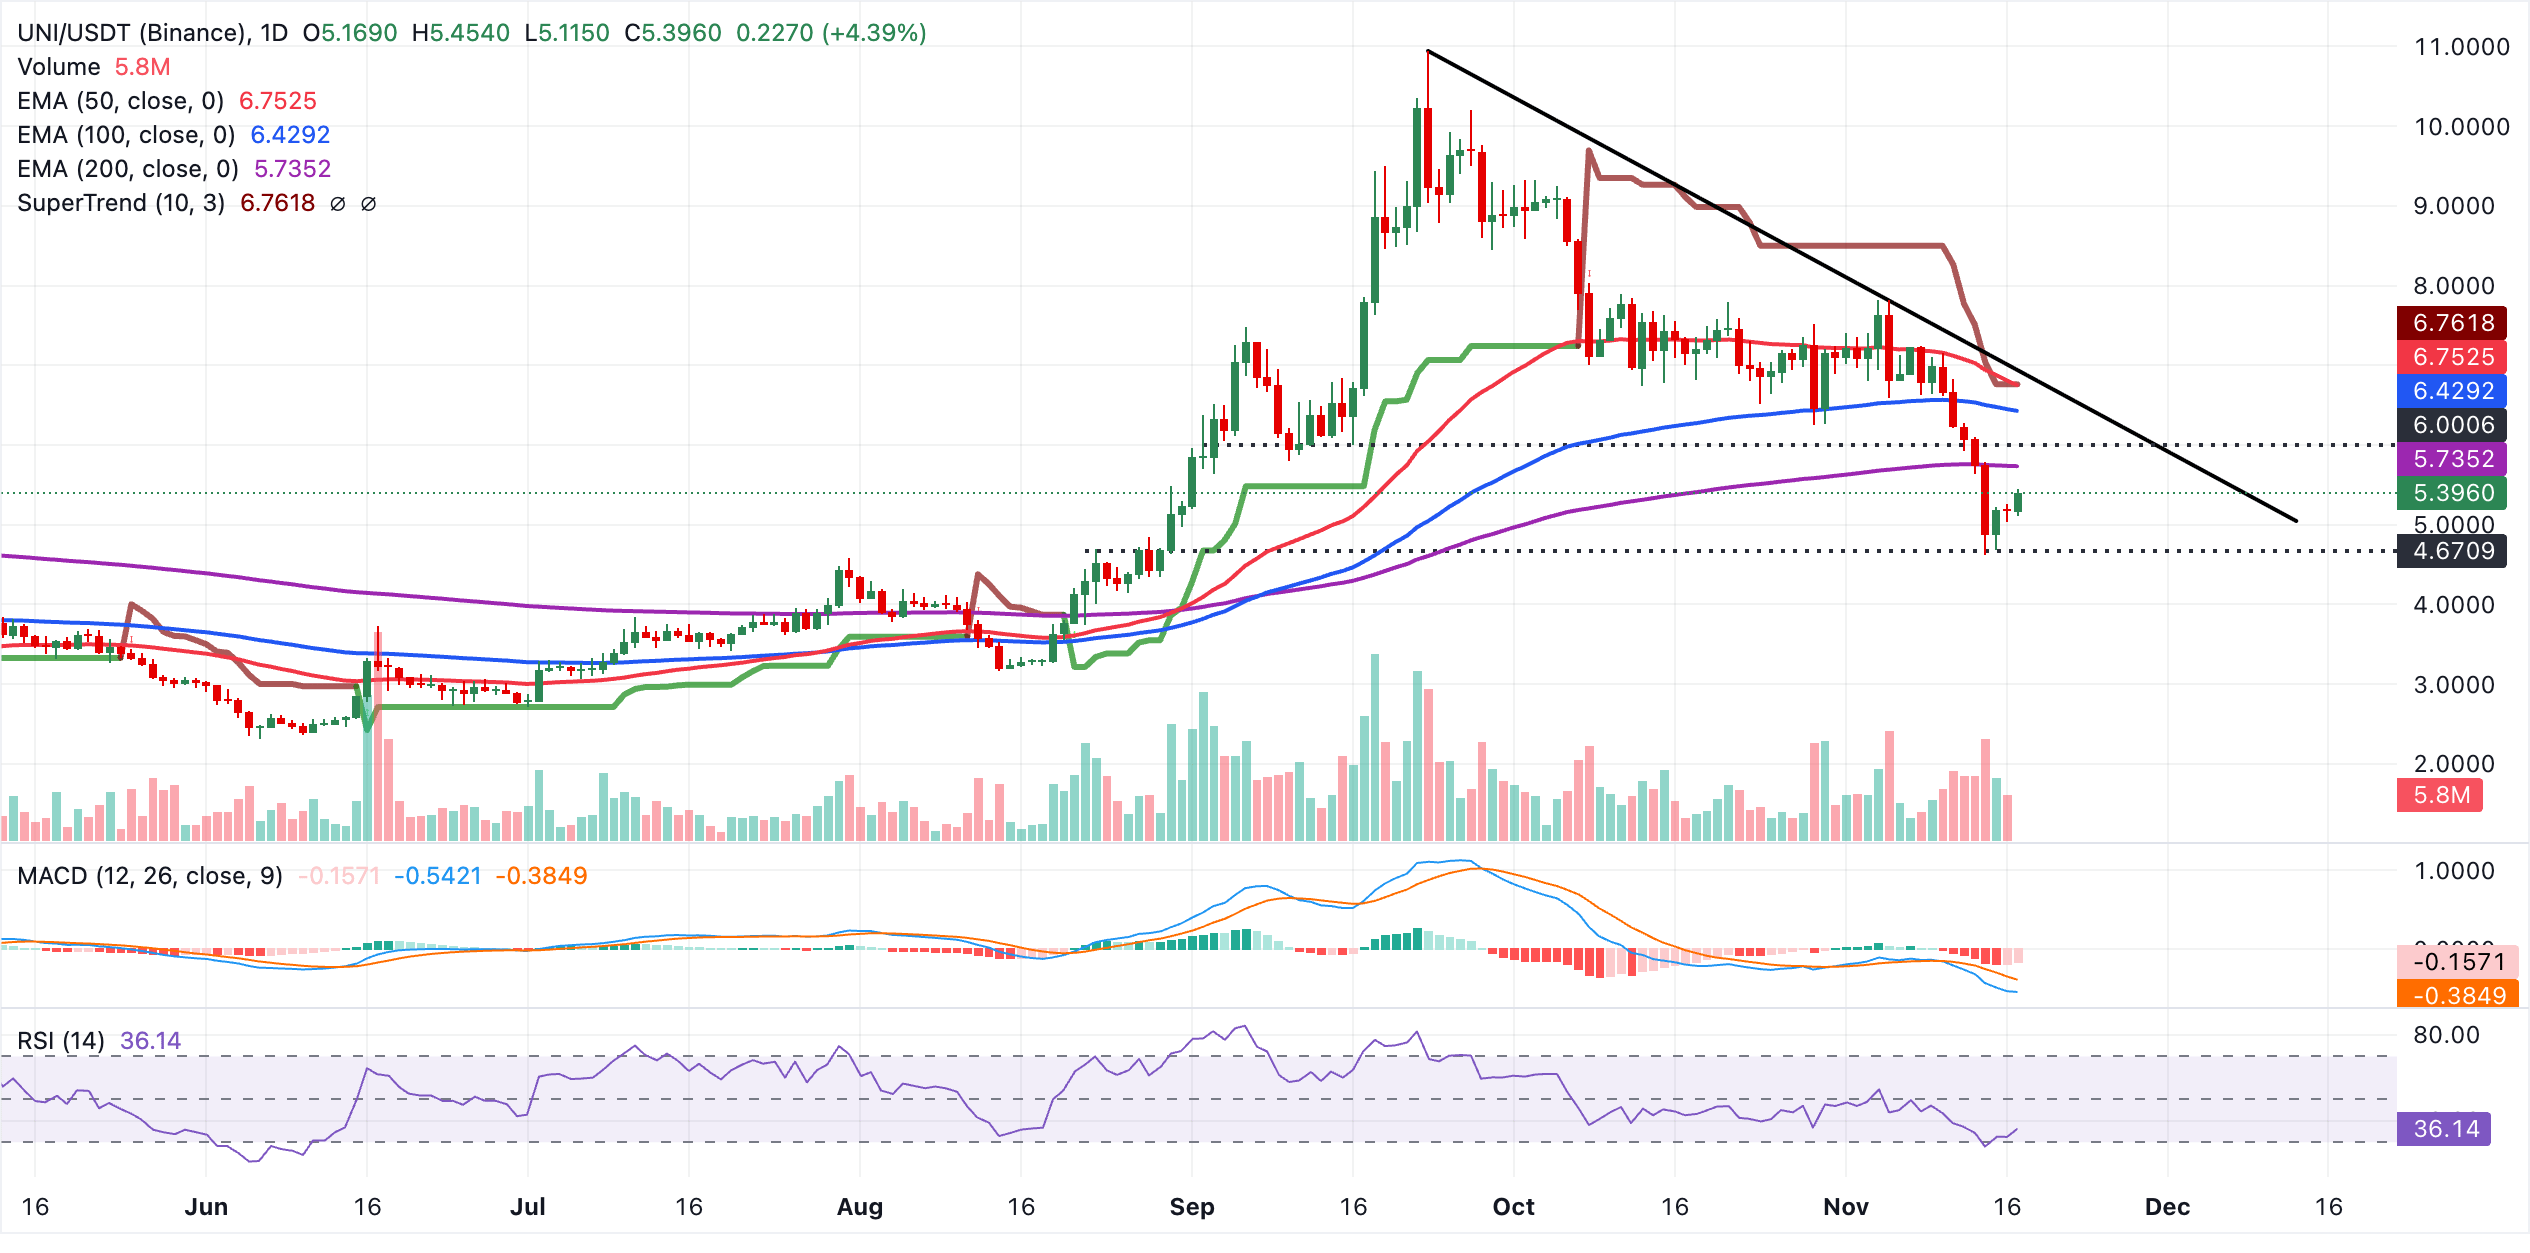
On the topside, initial resistance sits at the 200-day EMA around $5.74, with further upside likely to meet supply at the 100-day EMA near $6.43 and the tight confluence of the SuperTrend and 50-day EMA just under $6.80. Beyond that, a descending trendline resistance comes in around $6.90 and would need to be decisively reclaimed to ease the current bearish pressure and open the way for a more sustained recovery.
(The technical analysis of this story was written with the help of an AI tool. Know more.)
Bitcoin, altcoins, stablecoins FAQs
Bitcoin is the largest cryptocurrency by market capitalization, a virtual currency designed to serve as money. This form of payment cannot be controlled by any one person, group, or entity, which eliminates the need for third-party participation during financial transactions.
Altcoins are any cryptocurrency apart from Bitcoin, but some also regard Ethereum as a non-altcoin because it is from these two cryptocurrencies that forking happens. If this is true, then Litecoin is the first altcoin, forked from the Bitcoin protocol and, therefore, an “improved” version of it.
Stablecoins are cryptocurrencies designed to have a stable price, with their value backed by a reserve of the asset it represents. To achieve this, the value of any one stablecoin is pegged to a commodity or financial instrument, such as the US Dollar (USD), with its supply regulated by an algorithm or demand. The main goal of stablecoins is to provide an on/off-ramp for investors willing to trade and invest in cryptocurrencies. Stablecoins also allow investors to store value since cryptocurrencies, in general, are subject to volatility.
Bitcoin dominance is the ratio of Bitcoin's market capitalization to the total market capitalization of all cryptocurrencies combined. It provides a clear picture of Bitcoin’s interest among investors. A high BTC dominance typically happens before and during a bull run, in which investors resort to investing in relatively stable and high market capitalization cryptocurrency like Bitcoin. A drop in BTC dominance usually means that investors are moving their capital and/or profits to altcoins in a quest for higher returns, which usually triggers an explosion of altcoin rallies.
Recommended Articles


