



Dogecoin Price Forecast: ETF inflows and technicals fuel recovery

Source Fxstreet
  • Dogecoin extends gains on Monday after finding support around the key 200-day EMA.
  • US-listed spot ETFs recorded inflows of $327,360 last week, marking the third consecutive week of inflows.
  • Strengthening derivatives metrics and a constructive technical outlook support further gains for DOGE.

Dogecoin (DOGE) extends its gains, trading above $0.096 on Monday after finding support around the key support zone last week. Continued inflows into spot DOGE Exchange Traded Funds (ETFs), alongside strengthening derivatives metrics, indicate improving market sentiment. Meanwhile, the constructive technical outlook suggests the meme coin could extend its gains if the key level holds.

DOGE’s institutional demand remains robust

SoSoValue data showed spot ETFs recorded $327,360 last week, marking the third straight week of inflows and indicating strong institutional demand. If this inflow trend continues, stays positive and intensifies through the week, the dog-themed meme coin could extend gains.
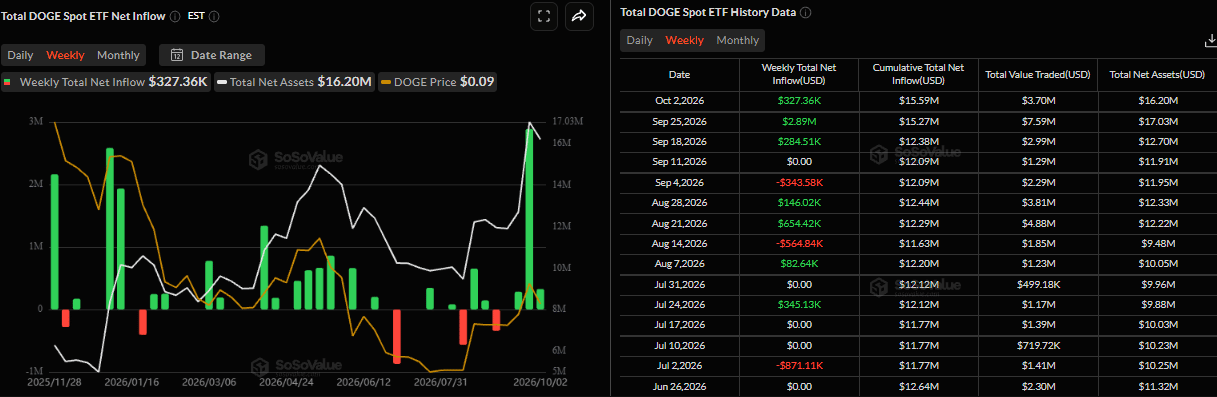
Total DOGE spot ETF net inflow weekly chart. Source: SoSoValue

Improving derivatives positioning among DOGE traders

Derivatives data shows a bullish outlook for DOGE. CoinGlass’ long-to-short ratio for DOGE reads 1.01 on Monday, flipping into green territory. A ratio above one indicates bullish sentiment, as traders bet that asset prices will rise.
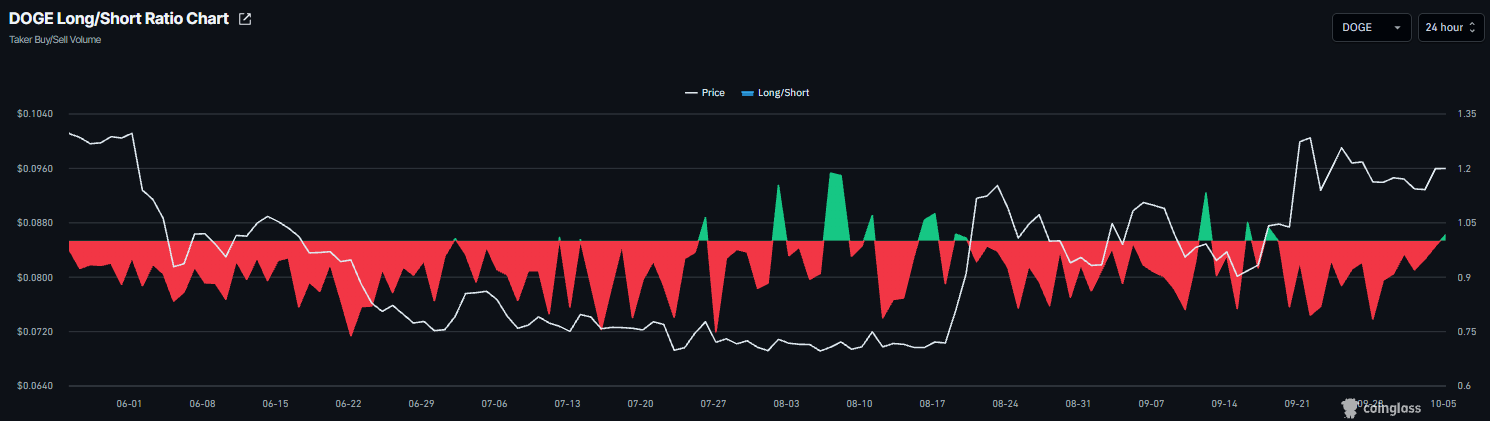
DOGE long-to-short ratio chart. Source: Coinglass

In addition, Dogecoin’s funding rate flipped positive on September 10 and rose to 0.0092% on Monday. This indicates longs are paying shorts, reflecting a bullish outlook for Dogecoin.
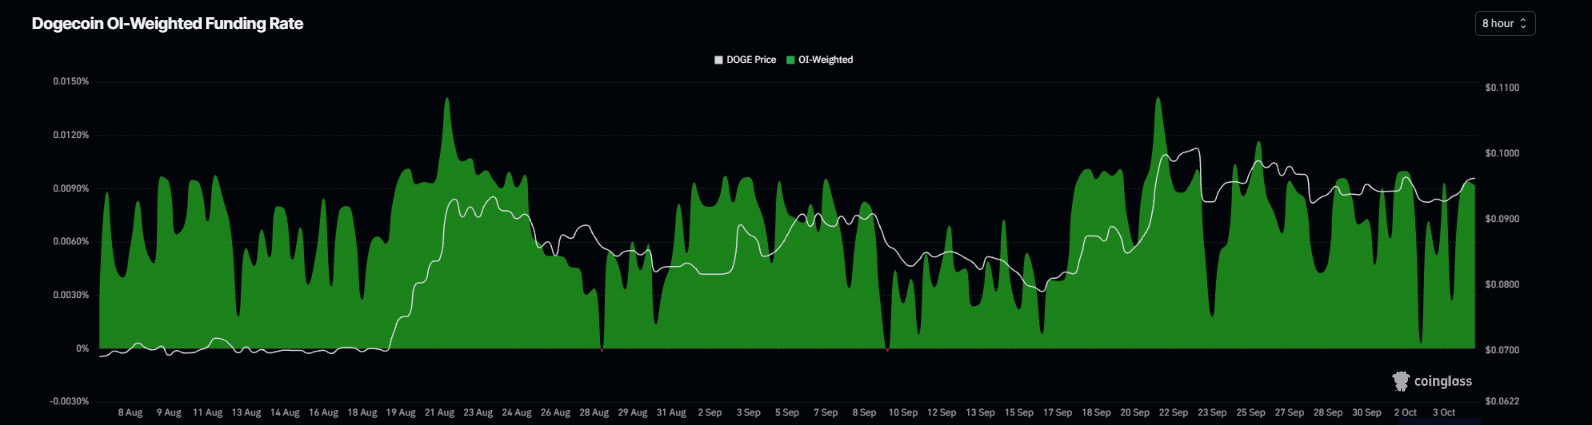
DOGE funding rates chart. Source: Coinglass

Dogecoin technical outlook: 200-day EMA holds strong

Dogecoin price trades around $0.096 on Monday, maintaining a bullish near-term bias as it holds above the 200-day exponential moving average (EMA) at $0.093, with the shorter 50-day and 100-day EMAs clustered between roughly $0.086 and $0.088.

The Relative Strength Index (RSI) near 58 suggests constructive but not overextended momentum. At the same time, the Moving Average Convergence Divergence (MACD) has slipped marginally into negative territory, hinting at a mild loss of upside pressure rather than a decisive trend change.

On the downside, immediate support is at the 200-day EMA near $0.093, with additional demand at the horizontal level of $0.088 and the nearby 50-day EMA at $0.088; deeper support emerges at the 100-day EMA around $0.086, ahead of the more distant structural floors at $0.070.

On the topside, initial resistance is defined by the horizontal barrier at $0.102, and a sustained move above this cap would open the way for a continuation of the broader recovery phase.
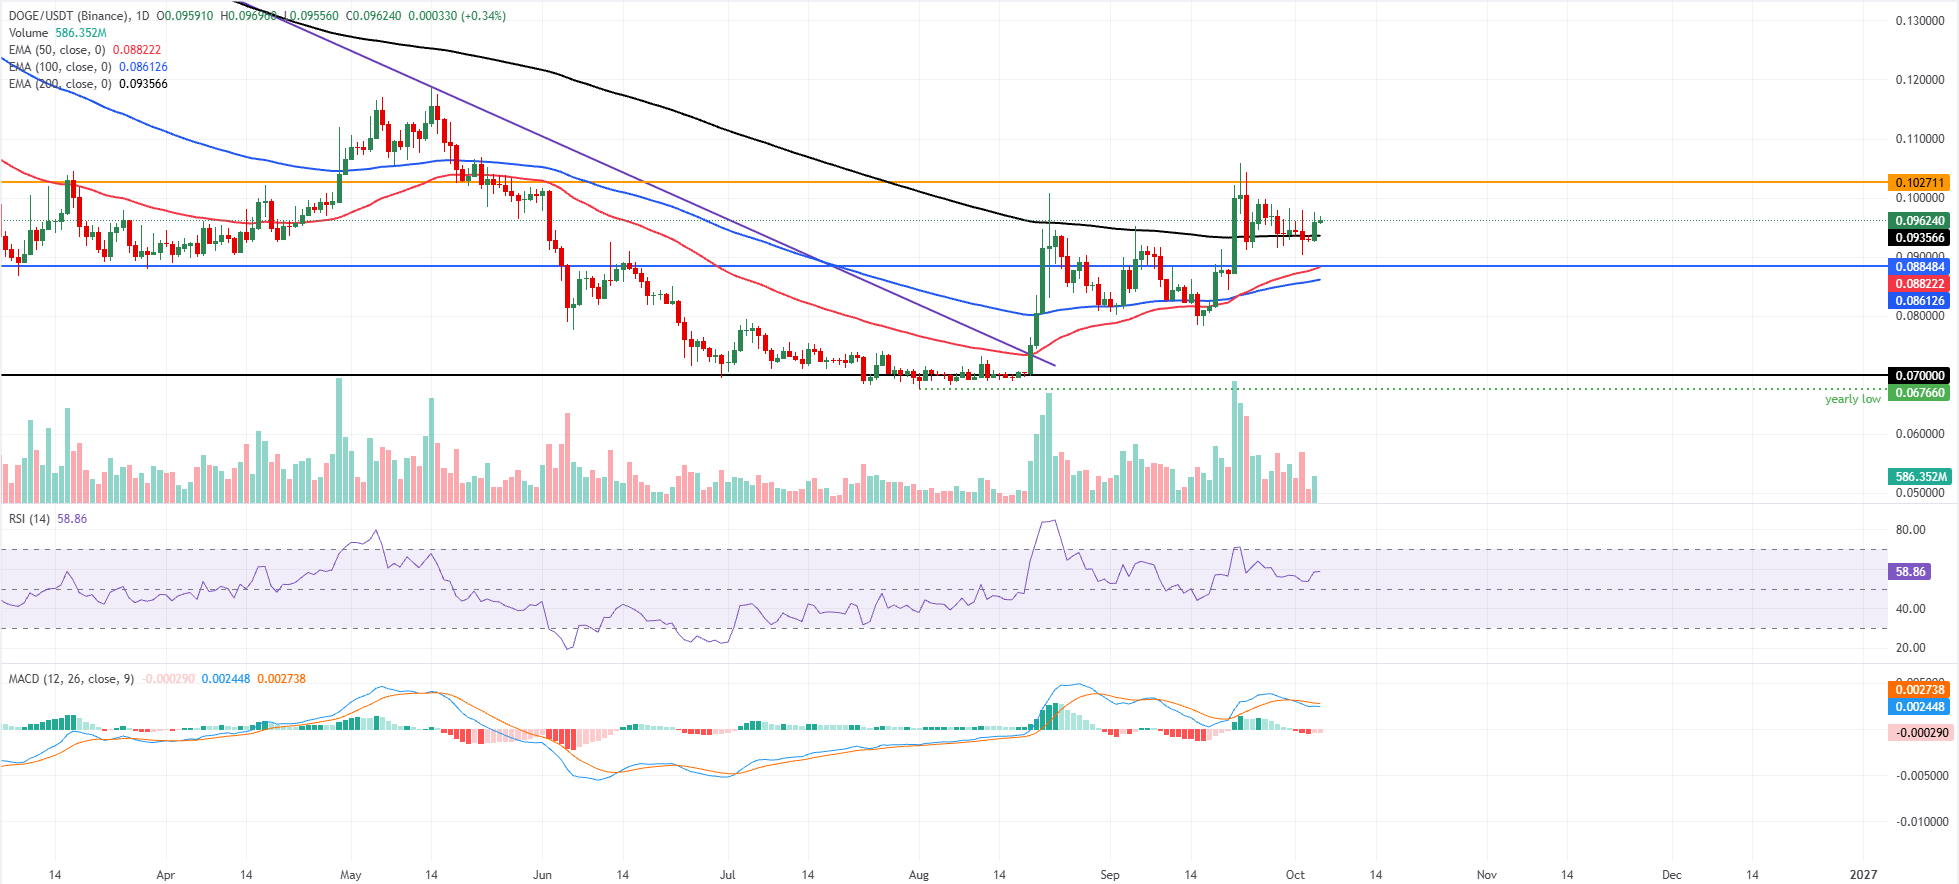
DOGE/USDT daily chart

(The technical analysis of this story was written with the help of an AI tool. Know more.)

Disclaimer: For information purposes only. Past performance is not indicative of future results.
placeholder
Market News Today Australia: VIX Jumps Nearly 19%, Gold Hits One-Year Low and Nasdaq 100 FallsNasdaq 100 falls 2.67%, gold hits a one-year low and WTI settles at US$85.72. See what Australian traders are watching ahead of Nvidia earnings.
Author  Mitrade Team
22 hours ago
Nasdaq 100 falls 2.67%, gold hits a one-year low and WTI settles at US$85.72. See what Australian traders are watching ahead of Nvidia earnings.
placeholder
Tom Lee Sees No Cracks in the AI Trade Despite Nasdaq's 12% DropTom Lee, head of research at Fundstrat Global Advisors, says the artificial intelligence (AI) trade remains structurally intact. The tech-heavy Nasdaq Composite had fallen nearly 12% from its Oct. 6 r
Author  Beincrypto
22 hours ago
Tom Lee, head of research at Fundstrat Global Advisors, says the artificial intelligence (AI) trade remains structurally intact. The tech-heavy Nasdaq Composite had fallen nearly 12% from its Oct. 6 r
placeholder
Stocks, Gold, and Asia Bleed $2.2 Trillion: Top 5 Factors That Triggered the CrashGlobal markets lost roughly $2.2 trillion on November 16 as US stocks, precious metals, and Asian equities sold off together. Technology and AI-linked names led the decline.However, the rout did not s
Author  Beincrypto
22 hours ago
Global markets lost roughly $2.2 trillion on November 16 as US stocks, precious metals, and Asian equities sold off together. Technology and AI-linked names led the decline.However, the rout did not s
placeholder
Nvidia faces its biggest earnings test yet — why Silicon Valley billionaires want Jensen Huang backNvidia faces a critical earnings test as investors weigh its AI growth outlook and leadership uncertainty. Discover why Silicon Valley billionaires want Jensen Huang back, what it could mean for Nvidia shares and how the results may shape the broader AI trade.
Author  Mark Garro
21 hours ago
Nvidia faces a critical earnings test as investors weigh its AI growth outlook and leadership uncertainty. Discover why Silicon Valley billionaires want Jensen Huang back, what it could mean for Nvidia shares and how the results may shape the broader AI trade.
placeholder
Gold Price Today: Can XAU/USD Hold $3,870? | Mitrade AUGold rebounds near US$3,870 after hitting a one-year low. Explore XAU/USD support, Fed risks and what the outlook means for Australian traders.
Author  Mitrade Team
15 hours ago
Gold rebounds near US$3,870 after hitting a one-year low. Explore XAU/USD support, Fed risks and what the outlook means for Australian traders.
Related Instrument
goTop
quote