




Ripple and Stellar outlook: XRP and XLM extend correction as bearish pressure builds
- XRP extends its correction, trading below $1.06 on Tuesday after falling over 4% the previous day.
- XLM slips below key support after losing over 5% at the start of this week.
- Weakening momentum indicators and deteriorating derivatives metrics signal growing bearish pressure for both altcoins.
Ripple (XRP) and Stellar (XLM) remain under pressure on Tuesday after losing over 4% and over 5%, respectively, the previous day. In addition, weakening momentum indicators and deteriorating derivatives metrics suggest sellers remain in control, raising the risk of further downside for both altcoins.
Weakening derivatives metrics support downside risk
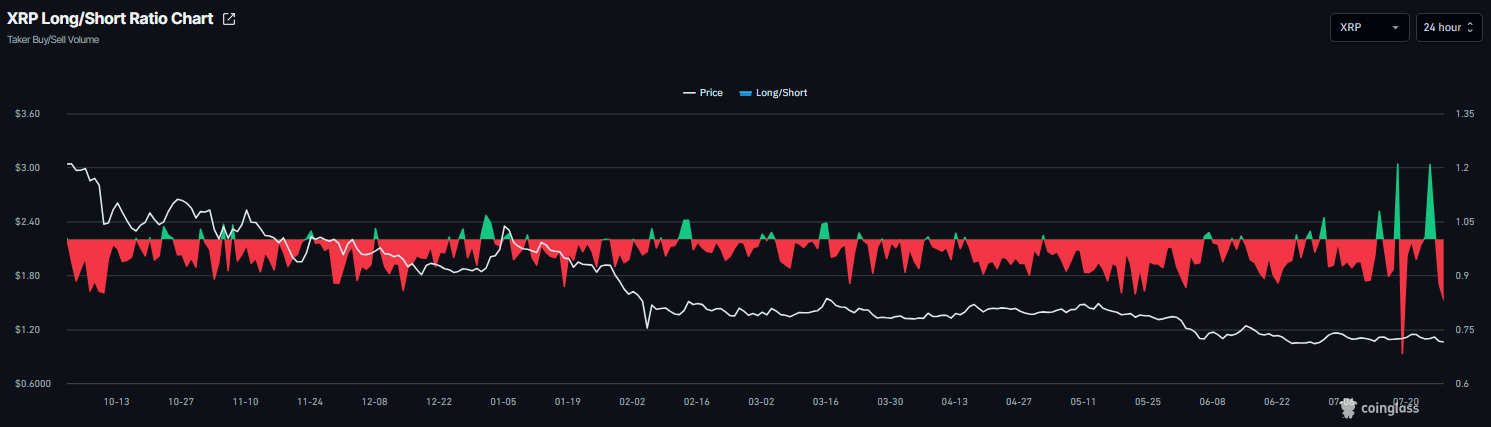
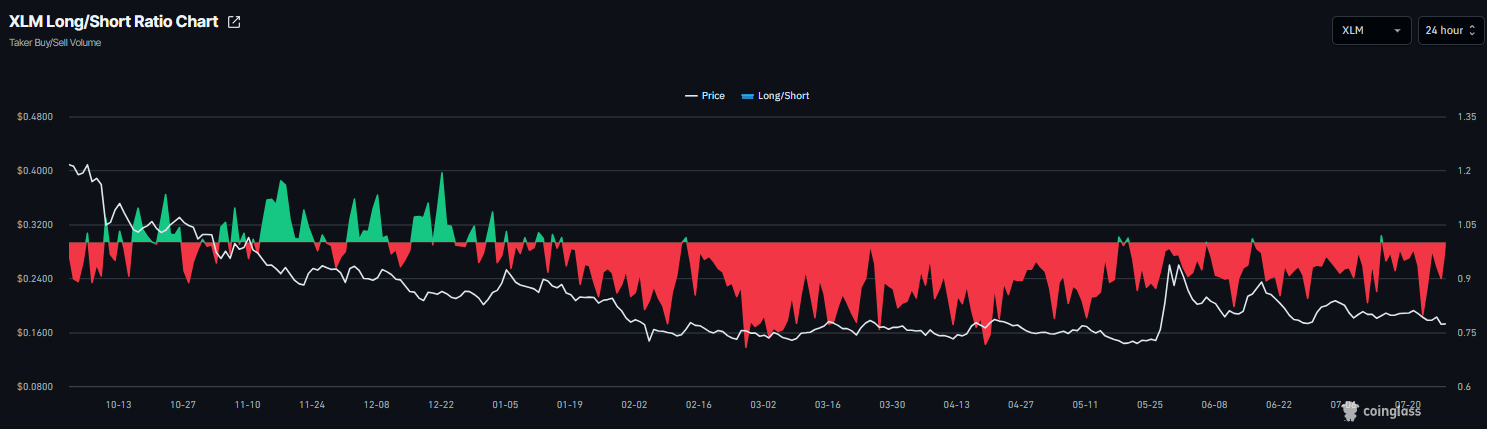
Derivatives data shows a slight bearish tilt. CoinGlass’ long-to-short ratio for both XRP and XLM read 0.83 and 0.98, respectively, on Tuesday, nearing their lowest levels in over a month. The ratio being below one, indicates bearish sentiment, as traders are betting the assets' prices will fall.
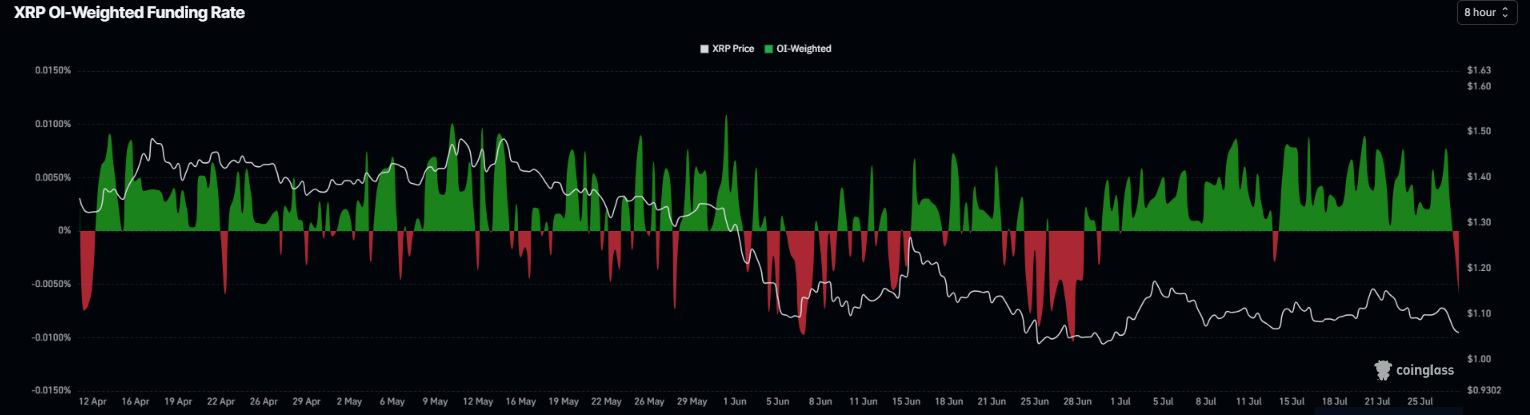
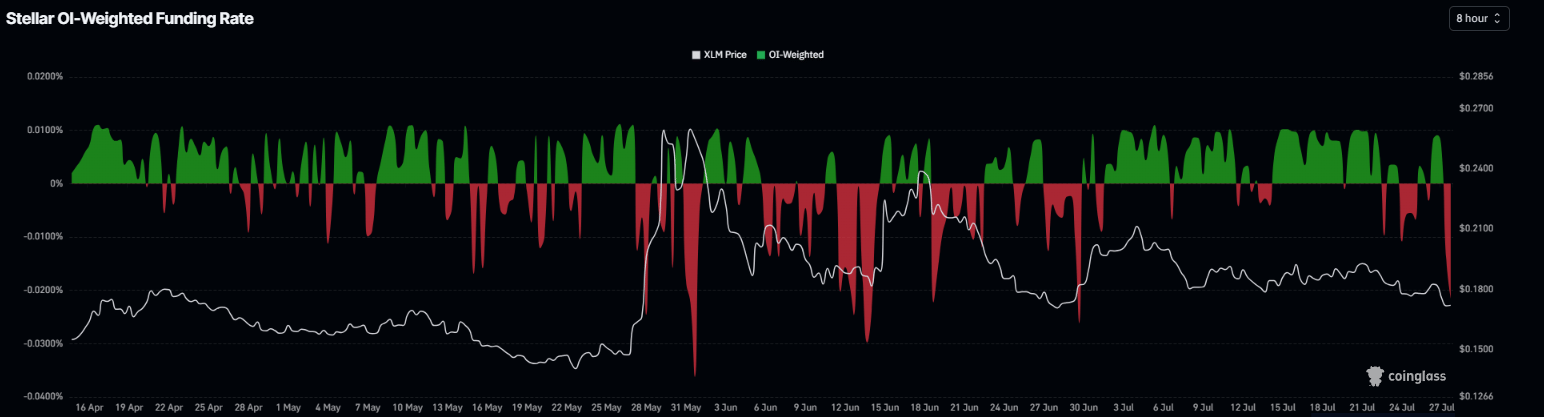
In addition, the funding rates also show a bearish outlook. XRP funding rates flipped negative on Monday, reading -0.0058% on Tuesday. Similarly, for XLM, the funding rate flipped negative on Monday, reading -0.0210%, indicating that shorts are paying longs and signaling bearish sentiment.
XLM technical outlook: Bears in control of the momentum
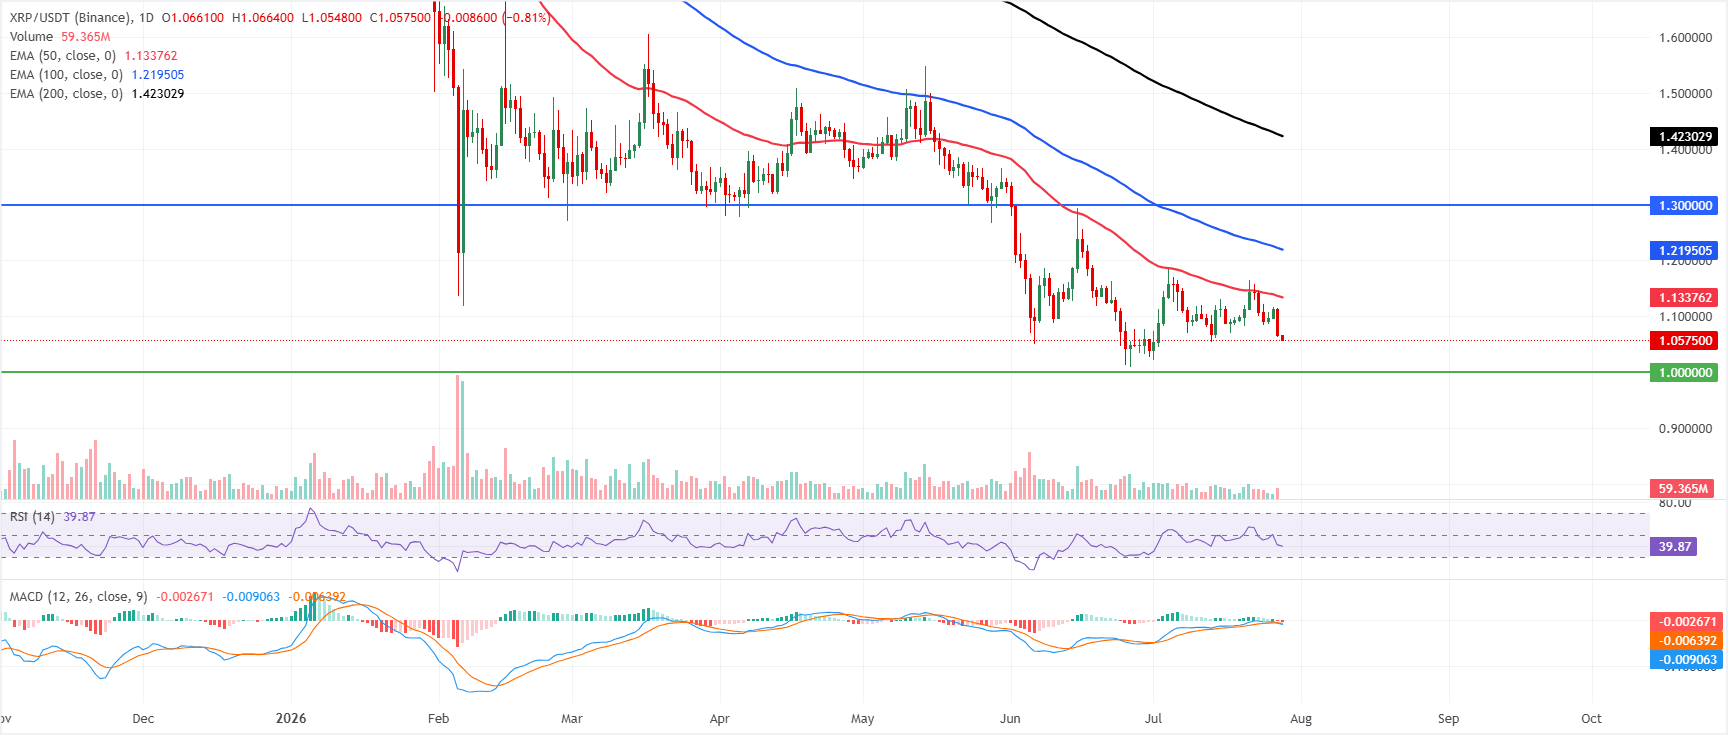
XRP price trades at $1.05 on Tuesday after losing over 4% the previous day. XRP is maintaining a bearish near-term bias as price remains below the 50-, 100-, and 200-day Exponential Moving Averages (EMAs) at $1.13, $1.21, and $1.42, respectively.
The Relative Strength Index (RSI) is in bearish territory near 39, suggesting lingering downside pressure. At the same time, the Moving Average Convergence Divergence (MACD) remains fractionally negative, suggesting that recovery attempts are still vulnerable below the clustered EMA resistance.
On the topside, initial resistance is seen at the 50-day EMA around $1.13, followed by the 100-day EMA near $1.22 and the horizontal barrier at $1.30; beyond that, the 200-day EMA at $1.42 and the $1.90 level mark more distant caps.
On the downside, the next notable support aligns with the psychological and structural floor at $1.00, where buyers would be expected to defend the broader uptrend unless a deeper correction unfolds.
XLM technical outlook: Slips below key EMAs
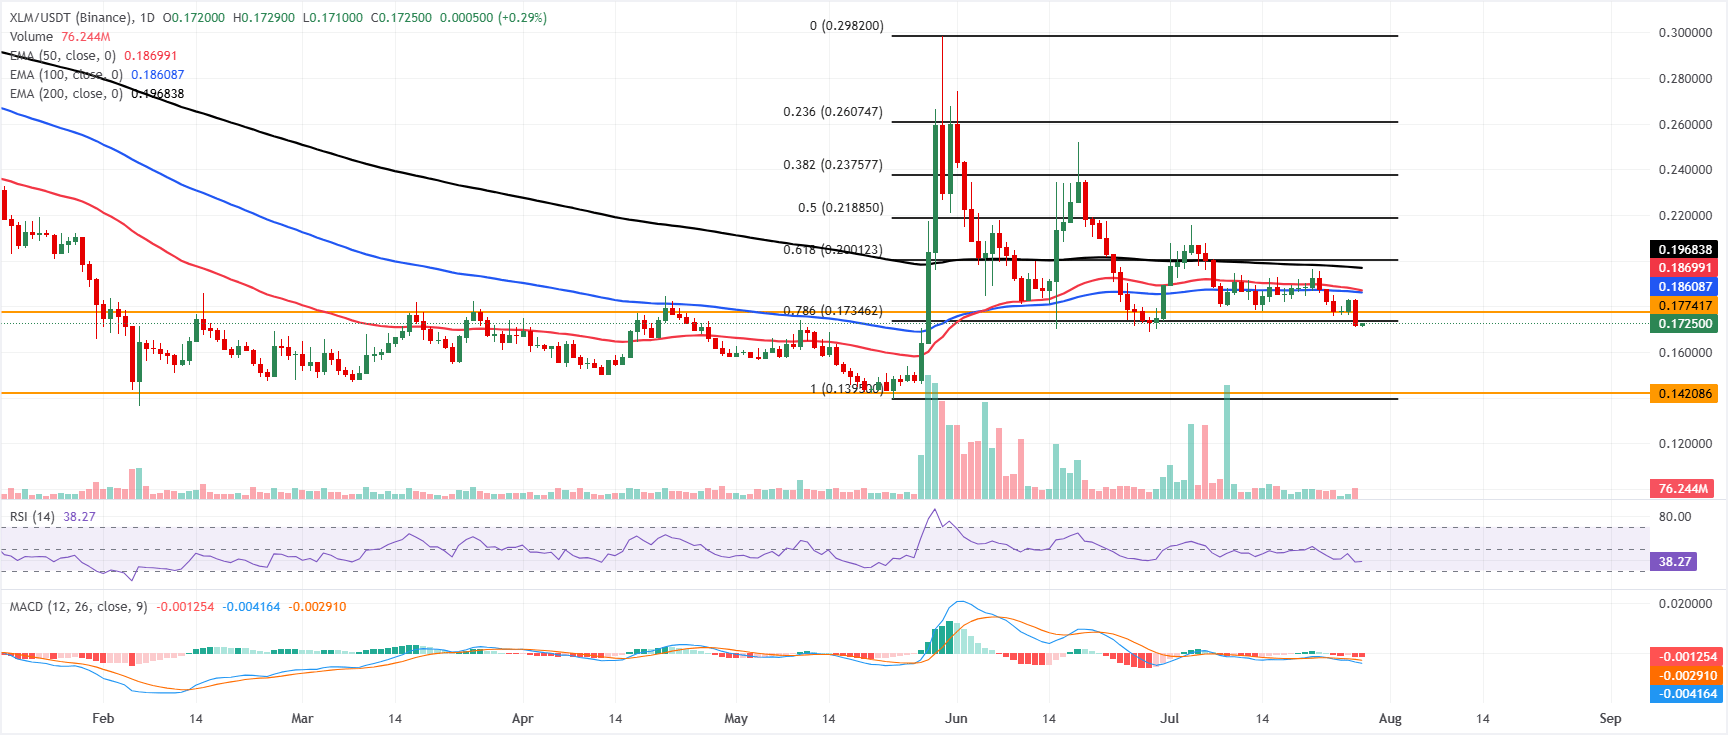
XLM price trades at $0.172 on Tuesday after correcting over 5% the previous day. XLM is maintaining a bearish tone as it holds below the key EMAs, with the 50-day EMA at $0.187, the 100-day EMA at $0.186, and the 200-day EMA at $0.196 acting as a dense overhead cap.
XLM price is also pressing just under the 78.6% Fibonacci retracement at $0.173, reinforcing immediate topside pressure. At the same time, the RSI around 38 suggests soft momentum, and the MACD remains slightly negative, hinting that sellers still have the near-term advantage.
On the topside, initial resistance is seen at the 78.6% Fibonacci retracement at $0.173, followed by the horizontal barrier at $0.177; above this area, the 100-day EMA at $0.186 and the 50-day EMA at $0.187 form a broader resistance band ahead of the 200-day EMA at $0.196 and the 61.8% Fibonacci retracement at $0.200.
On the downside, support aligns at the prior structural floor near $0.142, just above the cycle low anchor around $0.139, with a daily close below this zone likely opening the door to a deeper corrective phase despite interim attempts to stabilize.
(The technical analysis of this story was written with the help of an AI tool. Know more.)
Recommended Articles


