




Gold price crashes as 2007-era yields trigger brutal sell-off
- Gold sinks over 3% as 10-year yield hits 5.27%.
- Fed hike expectations intensify amid persistent inflation concerns.
- US-Iran uncertainty and key jobs data keep volatility elevated.
Gold (XAU/USD) begins the week on the back foot, tanking over 3.4% on Monday as US Treasury yields soar and Oil prices remain elevated despite falling from daily highs amid mixed news headlines about a potential US-Iran deal. The XAU/USD trades at $4,139 after peaking at $4,280.
XAU/USD plunges as surging yields and Fed tightening bets overwhelm Bullion
Inflationary pressure continued to build even though West Texas Intermediate (WTI), the US Crude benchmark, retreated to $93.00 per barrel, up 0.6%, after opening the week with gains of nearly 3%.
Mixed news headlines about a potential US-Iran deal and officials denying those claims keep financial markets volatile. Reports from Al Hadath about Iran agreeing to halt its uranium enrichment program were denied by Press TV, which reported that Tehran’s position remains unchanged.
On Saturday, US President Donald Trump rejected a deal with Iran aimed at reopening the Strait of Hormuz.
Given the backdrop, US Treasury yields remain higher with the US 10-year Treasury note yield rising to its highest level since June 2007 at 5.27%, before trimming some of its gains to 5.23 %.
In addition, Federal Reserve (Fed) speakers becoming vocal about elevated US inflation has increased the chances of additional interest rate hikes. Fed Governor Lisa Cook has been notably hawkish, expecting continued inflationary pressure in the coming months from AI and hostilities in the Middle East.
Money markets had priced in a 65% chance of a 25-basis-point rate hike by the Fed at the October meeting. However,the December meeting is almost a certainty with odds of 94%, according to Prime Terminal.
Traders now shift their focus to jobs data, led by the Job Openings and Labor Turnover Survey (JOLTS), the ADP Employment Change report for September, the Core Personal Consumption Expenditures (PCE) Price Index, and September’s Nonfarm Payrolls.
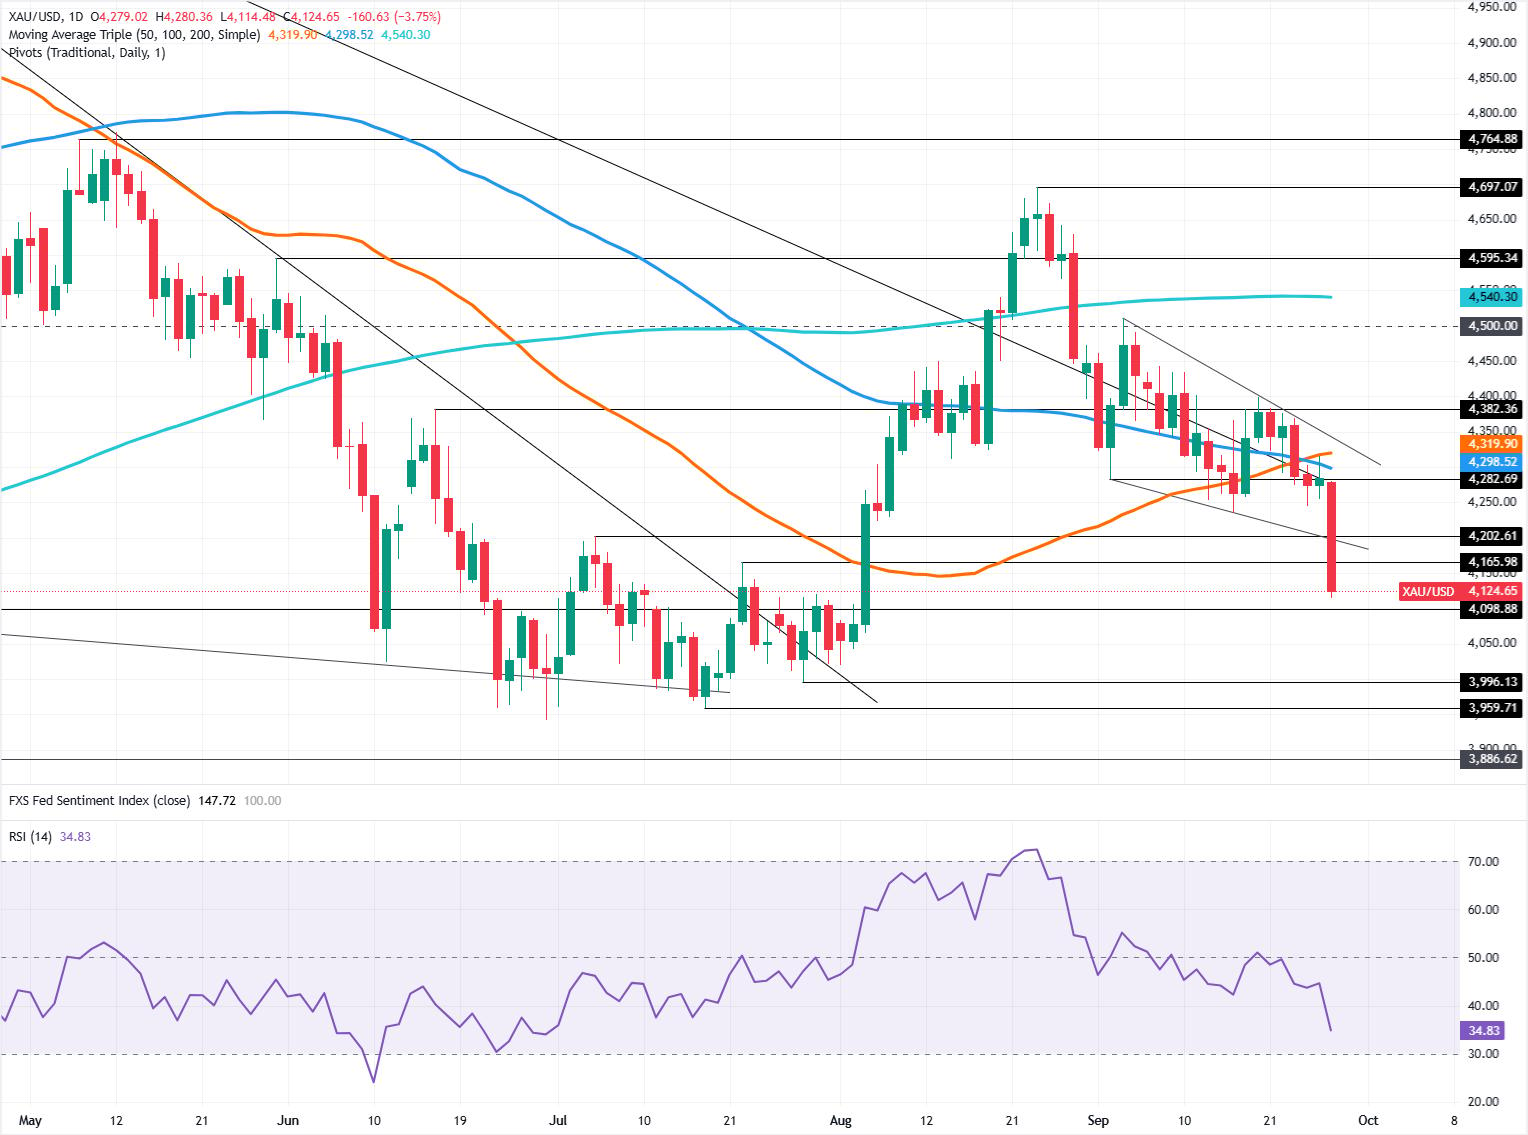
XAU/USD technical outlook: Gold poised to drop below $4,100 as RSI dives sharply
After drifting inside a bullish wedge, Gold broke the bottom trendline of the pattern and aimed toward the next area of interest, that being the August 3 daily low of $4,019. Clearly, the downtrend is intact, with bearish momentum building as the Relative Strength Index (RSI) falls vertically and approaches oversold territory.
For a bearish continuation, XAU/USD must clear the $4,100 mark, followed by the $4,050 mark. Below is the August 3 low of $4,019, with the $4,000 mark in sight.
For a bullish reversal, Gold must clear the $4,200 mark, followed by the confluence of the 100-day and 50-day Simple Moving Averages (SMAs) at $4,298 and $4,319, respectively.
Gold FAQs
Gold has played a key role in human’s history as it has been widely used as a store of value and medium of exchange. Currently, apart from its shine and usage for jewelry, the precious metal is widely seen as a safe-haven asset, meaning that it is considered a good investment during turbulent times. Gold is also widely seen as a hedge against inflation and against depreciating currencies as it doesn’t rely on any specific issuer or government.
Central banks are the biggest Gold holders. In their aim to support their currencies in turbulent times, central banks tend to diversify their reserves and buy Gold to improve the perceived strength of the economy and the currency. High Gold reserves can be a source of trust for a country’s solvency. Central banks added 1,136 tonnes of Gold worth around $70 billion to their reserves in 2022, according to data from the World Gold Council. This is the highest yearly purchase since records began. Central banks from emerging economies such as China, India and Turkey are quickly increasing their Gold reserves.
Gold has an inverse correlation with the US Dollar and US Treasuries, which are both major reserve and safe-haven assets. When the Dollar depreciates, Gold tends to rise, enabling investors and central banks to diversify their assets in turbulent times. Gold is also inversely correlated with risk assets. A rally in the stock market tends to weaken Gold price, while sell-offs in riskier markets tend to favor the precious metal.
The price can move due to a wide range of factors. Geopolitical instability or fears of a deep recession can quickly make Gold price escalate due to its safe-haven status. As a yield-less asset, Gold tends to rise with lower interest rates, while higher cost of money usually weighs down on the yellow metal. Still, most moves depend on how the US Dollar (USD) behaves as the asset is priced in dollars (XAU/USD). A strong Dollar tends to keep the price of Gold controlled, whereas a weaker Dollar is likely to push Gold prices up.
Recommended Articles


