




Gold steadies after sharp drop as traders weigh Fed, Middle East risks
- Gold steadies after Thursday’s sharp decline as the US Dollar and Treasury yields ease.
- Elevated Oil prices and new US tariffs keep inflation concerns and Fed rate-hike expectations in focus.
- XAU/USD holds above $4,000, but the technical outlook stays bearish below the Bollinger middle band.
Gold (XAU/USD) steadies on Friday after falling nearly 2% the previous day, as surging Oil prices fueled expectations that the Federal Reserve (Fed) may need to raise interest rates amid a worsening inflation outlook. At the time of writing, XAU/USD trades around $4,060 after hitting an intraday low of $4,022.
A pullback in Oil prices pushes the US Dollar (USD) and US Treasury yields slightly lower, lending some support to the precious metal, which typically moves inversely to both. Still, the upside remains limited as market sentiment stays tied to the hawkish Fed narrative, while the prospects for peace in the Middle East appear slim in the near term.
According to the CME FedWatch Tool, markets now see a 78% chance of a rate hike in September, while the Fed is widely expected to keep interest rates unchanged at its July 28-29 meeting.
Trade tensions also add to the inflation concerns after the United States (US) imposed new tariffs of 10% and 12.5% on imports from 60 trading partners on Friday.
On the geopolitical front, the US military completed its 13th consecutive night of strikes on Iran. Meanwhile, US President Donald Trump told Axios that he was “considering a massive attack” and was “close to making a decision.” Iran has also targeted US military bases in Jordan and Bahrain.
The war is now threatening two major energy-shipping routes, the Strait of Hormuz and Bab el-Mandeb, raising the risk of prolonged supply disruption and keeping Oil prices elevated.
West Texas Intermediate (WTI) rallied 6% on Thursday, briefly climbing above $92.00. At the time of writing, WTI trades around $88.50, hovering near its highest level in more than a month.
Analysts at ING note that “despite ongoing geopolitical risks, gold has struggled to attract meaningful safe-haven demand since the conflict began,” with investor attention instead shifting toward “the inflationary implications of higher oil prices and the prospect of higher-for-longer interest rates.”
Against this backdrop, Gold’s near-term outlook remains tilted to the downside. However, the yellow metal continues to hold above the psychological $4,000 mark, leaving XAU/USD broadly range-bound between $4,000 and $4,200 for a fifth consecutive week.
On the US economic docket, traders await the preliminary S&P Global Purchasing Managers Index (PMI) data, due during American trading hours.
Technical analysis: XAU/USD holds firm above $4,000
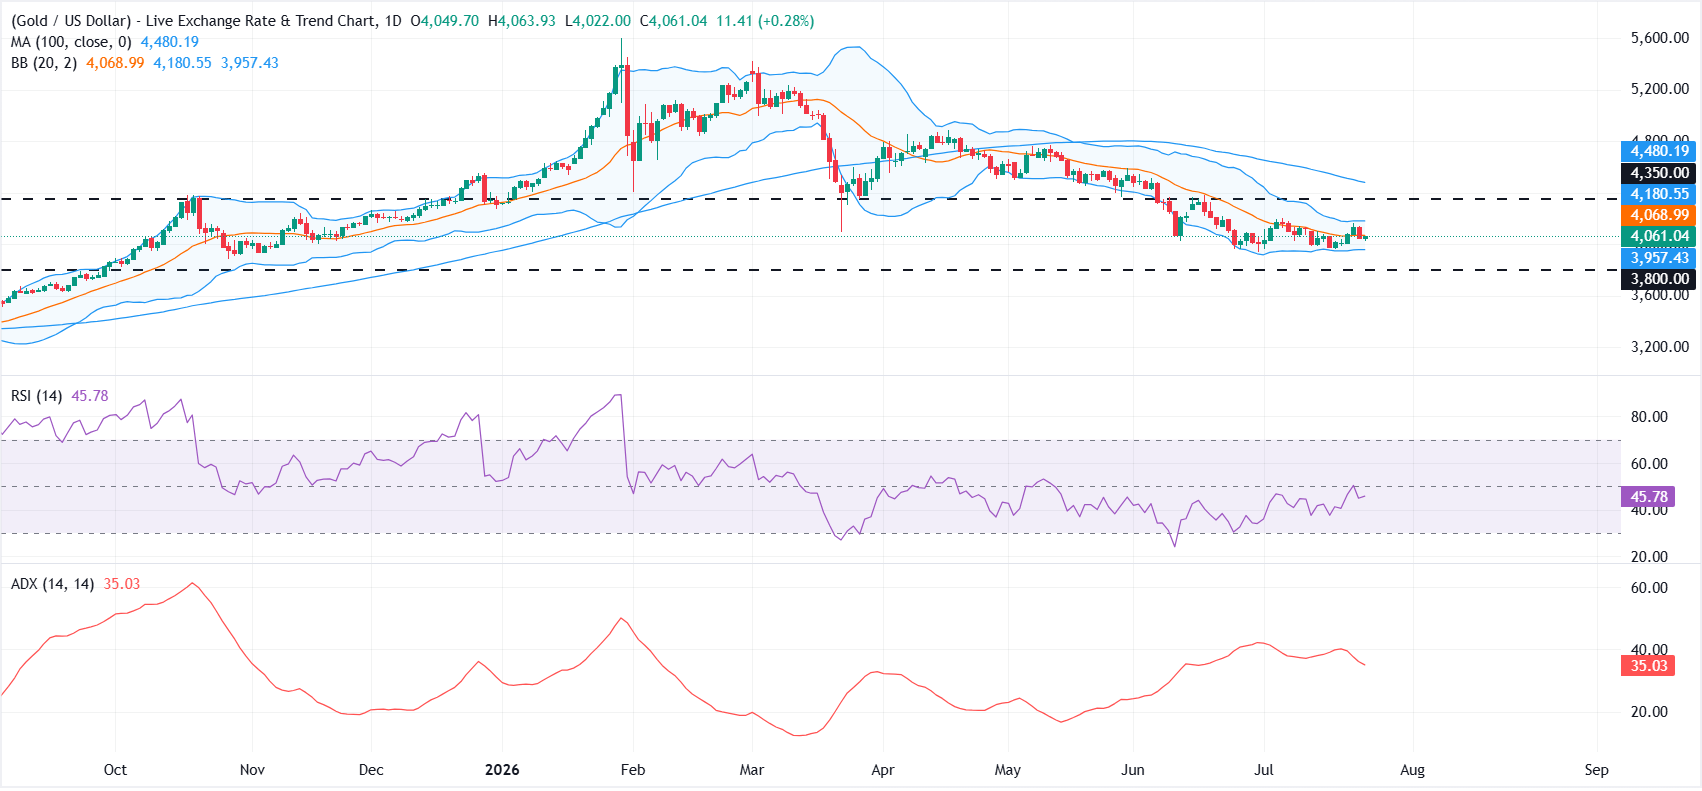
On the daily chart, XAU/USD maintains a bearish near-term tone, holding below the Bollinger middle band (20-period Simple Moving Average) at $4,068 and well below the 100-day simple moving average near $4,480.
The Relative Strength Index (RSI) hovers below the 50 line, while an elevated Average Directional Index above 35 hints that the prevailing downside phase still carries meaningful trend strength despite recent consolidation.
On the topside, initial resistance is located at the Bollinger middle band around $4,068, with further upside barriers at the upper Bollinger band near $4,180, followed by a more strategic horizontal resistance at $4,350 and the distant 100-day SMA around $4,480.
On the downside, immediate support emerges at the psychological $4,000 mark, followed by the lower Bollinger Band near $3,957. A more substantial demand zone is seen around $3,800, where buyers could step in if the decline extends.
(The technical analysis of this story was written with the help of an AI tool. Know more.)
US Dollar Price Today
The table below shows the percentage change of US Dollar (USD) against listed major currencies today. US Dollar was the strongest against the Swiss Franc.
| USD | EUR | GBP | JPY | CAD | AUD | NZD | CHF | |
|---|---|---|---|---|---|---|---|---|
| USD | -0.10% | -0.07% | -0.05% | -0.04% | -0.34% | -0.30% | -0.01% | |
| EUR | 0.10% | -0.02% | 0.00% | 0.02% | -0.30% | -0.26% | 0.05% | |
| GBP | 0.07% | 0.02% | 0.02% | 0.04% | -0.28% | -0.23% | 0.06% | |
| JPY | 0.05% | 0.00% | -0.02% | 0.03% | -0.30% | -0.25% | 0.03% | |
| CAD | 0.04% | -0.02% | -0.04% | -0.03% | -0.32% | -0.28% | -0.01% | |
| AUD | 0.34% | 0.30% | 0.28% | 0.30% | 0.32% | 0.05% | 0.32% | |
| NZD | 0.30% | 0.26% | 0.23% | 0.25% | 0.28% | -0.05% | 0.28% | |
| CHF | 0.00% | -0.05% | -0.06% | -0.03% | 0.01% | -0.32% | -0.28% |
The heat map shows percentage changes of major currencies against each other. The base currency is picked from the left column, while the quote currency is picked from the top row. For example, if you pick the US Dollar from the left column and move along the horizontal line to the Japanese Yen, the percentage change displayed in the box will represent USD (base)/JPY (quote).
Recommended Articles


