


Gold climbs as US-Iran ceasefire weighs on US Dollar
- Gold climbs toward three-week highs as US-Iran ceasefire lifts market sentiment.
- Softer US Dollar and falling Oil prices support XAU/USD.
- Technically, XAU/USD shows a mild bullish bias as it holds above the 100-day SMA, with momentum indicators turning supportive.
Gold (XAU/USD) climbs toward three-week highs on Wednesday after the United States and Iran reached a temporary two-week ceasefire agreement, offering relief to markets following days of escalating tensions. At the time of writing, XAU/USD is trading around $4,803, up nearly 2% on the day after touching an intraday high of $4,857.
US-Iran ceasefire lifts market sentiment
US President Donald Trump announced on Truth Social that he had agreed to suspend attacks on Iran for a period of two weeks, provided that Tehran ensures the “complete, immediate, and safe opening of the Strait of Hormuz.” Iran’s Foreign Minister Abbas Araghchi also stated that safe transit through the Strait could be maintained during this period in coordination with Iranian armed forces.
The first round of negotiations is scheduled to take place in Islamabad on Friday, where Iran’s 10-point peace proposal will be discussed. Trump described the proposal as “a workable basis on which to negotiate.”
The ceasefire news eases fears of a prolonged war and lifts market sentiment, supporting a risk-on mood. Global equities are rallying while the US Dollar (USD) comes under broad pressure, lending support to XAU/USD. The US Dollar Index (DXY), which tracks the Greenback against a basket of six major currencies, is trading around 98.85, down nearly 0.80% on the day.
Oil slump eases inflation concerns
Meanwhile, Oil prices also retreat sharply, with WTI falling more than 10% to trade near $88.70 at the time of writing. The pullback in Crude helps ease inflation pressures and may reduce the need for tighter monetary policy from major central banks.
This shift in expectations supports Gold, which had previously struggled as markets priced in a higher-for-longer interest rate outlook, particularly from the Federal Reserve (Fed).
Even so, the metal lacks strong follow-through buying as traders expect the Fed to remain patient before resuming rate cuts, with recent US Nonfarm Payrolls (NFP) data pointing to a stable labor market and Oil prices still holding above pre-conflict levels, keeping inflation risks in focus.
Looking ahead, investors will closely watch the Fed’s minutes from the March meeting, due later in the American session, for fresh cues on the monetary policy outlook.
Technical analysis: XAU/USD trades between key SMAs as momentum improves
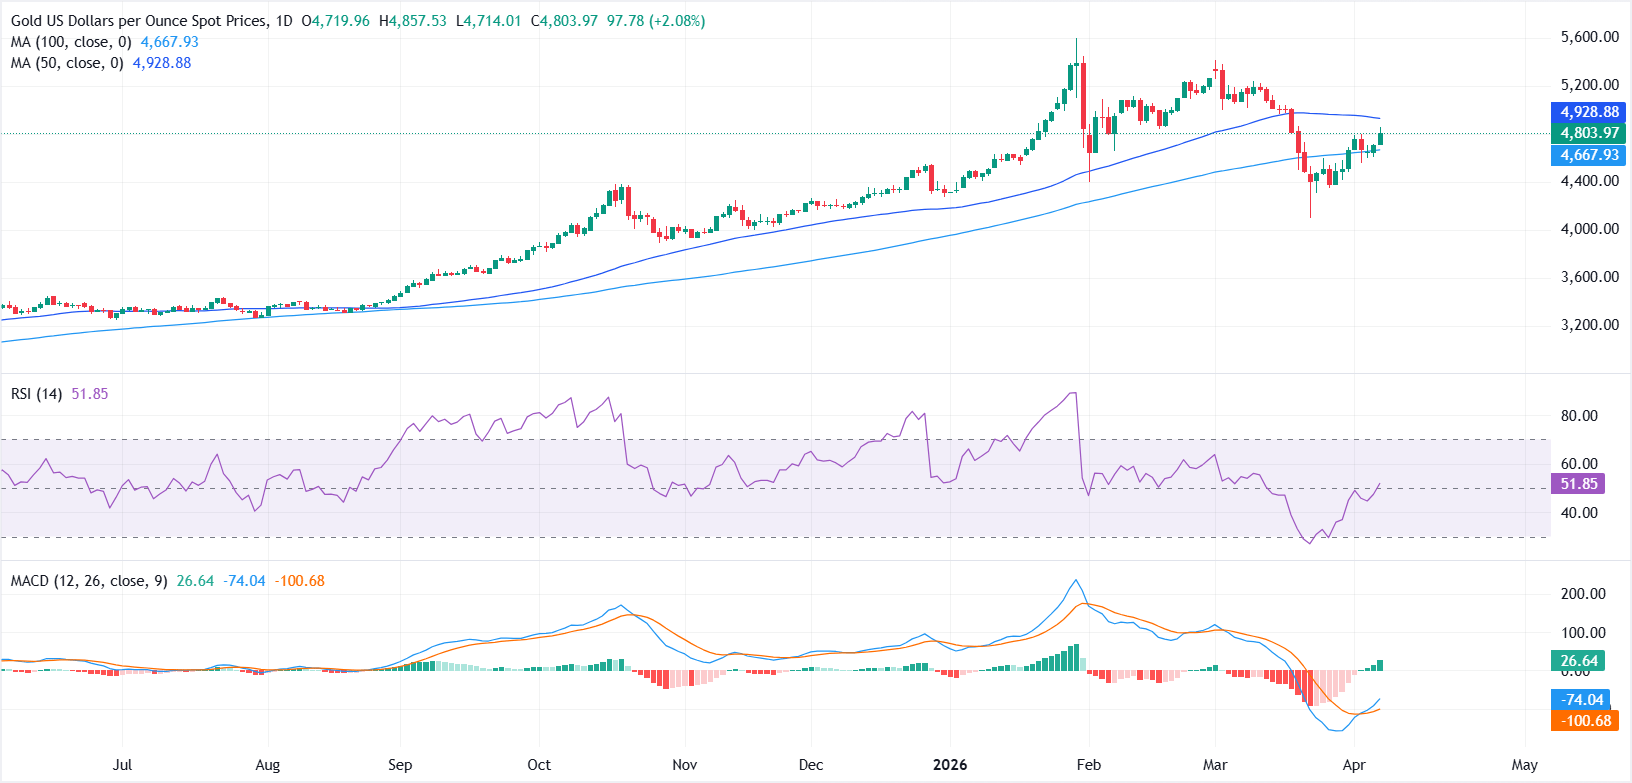
According to the daily chart, XAU/USD sits between its major moving averages, holding beneath the 50-day simple moving average (SMA) at $4,928.81 but above the 100-day SMA at $4,667.89, which suggests a broadly neutral near-term bias within a developing range. Momentum is mildly constructive, with the Relative Strength Index (14) hovering just above the midline and the Moving Average Convergence Divergence (MACD) in positive territory, hinting that buyers retain a slight edge while price remains capped by overhead trend reference levels.
On the topside, immediate resistance is defined by the 50-day SMA at $4,928.81, and a sustained break above this barrier would open the way for a more decisive recovery phase. On the downside, initial support is located at the 100-day SMA near $4,667.89, where a clear break lower would likely shift focus back toward a deeper corrective leg despite the currently improving momentum backdrop.
(The technical analysis of this story was written with the help of an AI tool.)
Recommended Articles


