




What to Expect From NVIDIA Stock Price in April 2026?


NVIDIA (NASDAQ: NVDA) stock price trades at $177.64 on the 2-day chart, up 5.31% over the past days but still down 6% year-to-date. April sits at a unique inflection for the stock. The Iran conflict could de-escalate within weeks, the FOMC meets on April 28-29 in what may be Jerome Powell’s final meeting as Chair, and pre-earnings positioning for the late May report begins building now.
The technical structure, options data, and institutional money flow each frame a different part of what April could deliver, and the causality between them narrows the range to two scenarios.
A Bearish Pattern With No Institutional Backing
The 2-day chart shows NVIDIA stock price trading inside a head and shoulders pattern. The head peaked at $197.72, a level reached on the last earnings day in late February. The right shoulder is currently building, and the pattern carries a 15% measured move if the neckline breaks.
Chaikin Money Flow (CMF), a proxy for institutional buying and selling pressure, reads -0.08. The indicator has stayed in negative territory for most of March and into April, confirming that big money has not backed the recent five-day bounce. CMF started trending upward around March 27 but has not crossed above the zero line. The last time it briefly turned positive was around the February 25 earnings release, and it quickly reversed.
Want more insights like this? Sign up for Editor Harsh Notariya’s Daily Newsletter here.
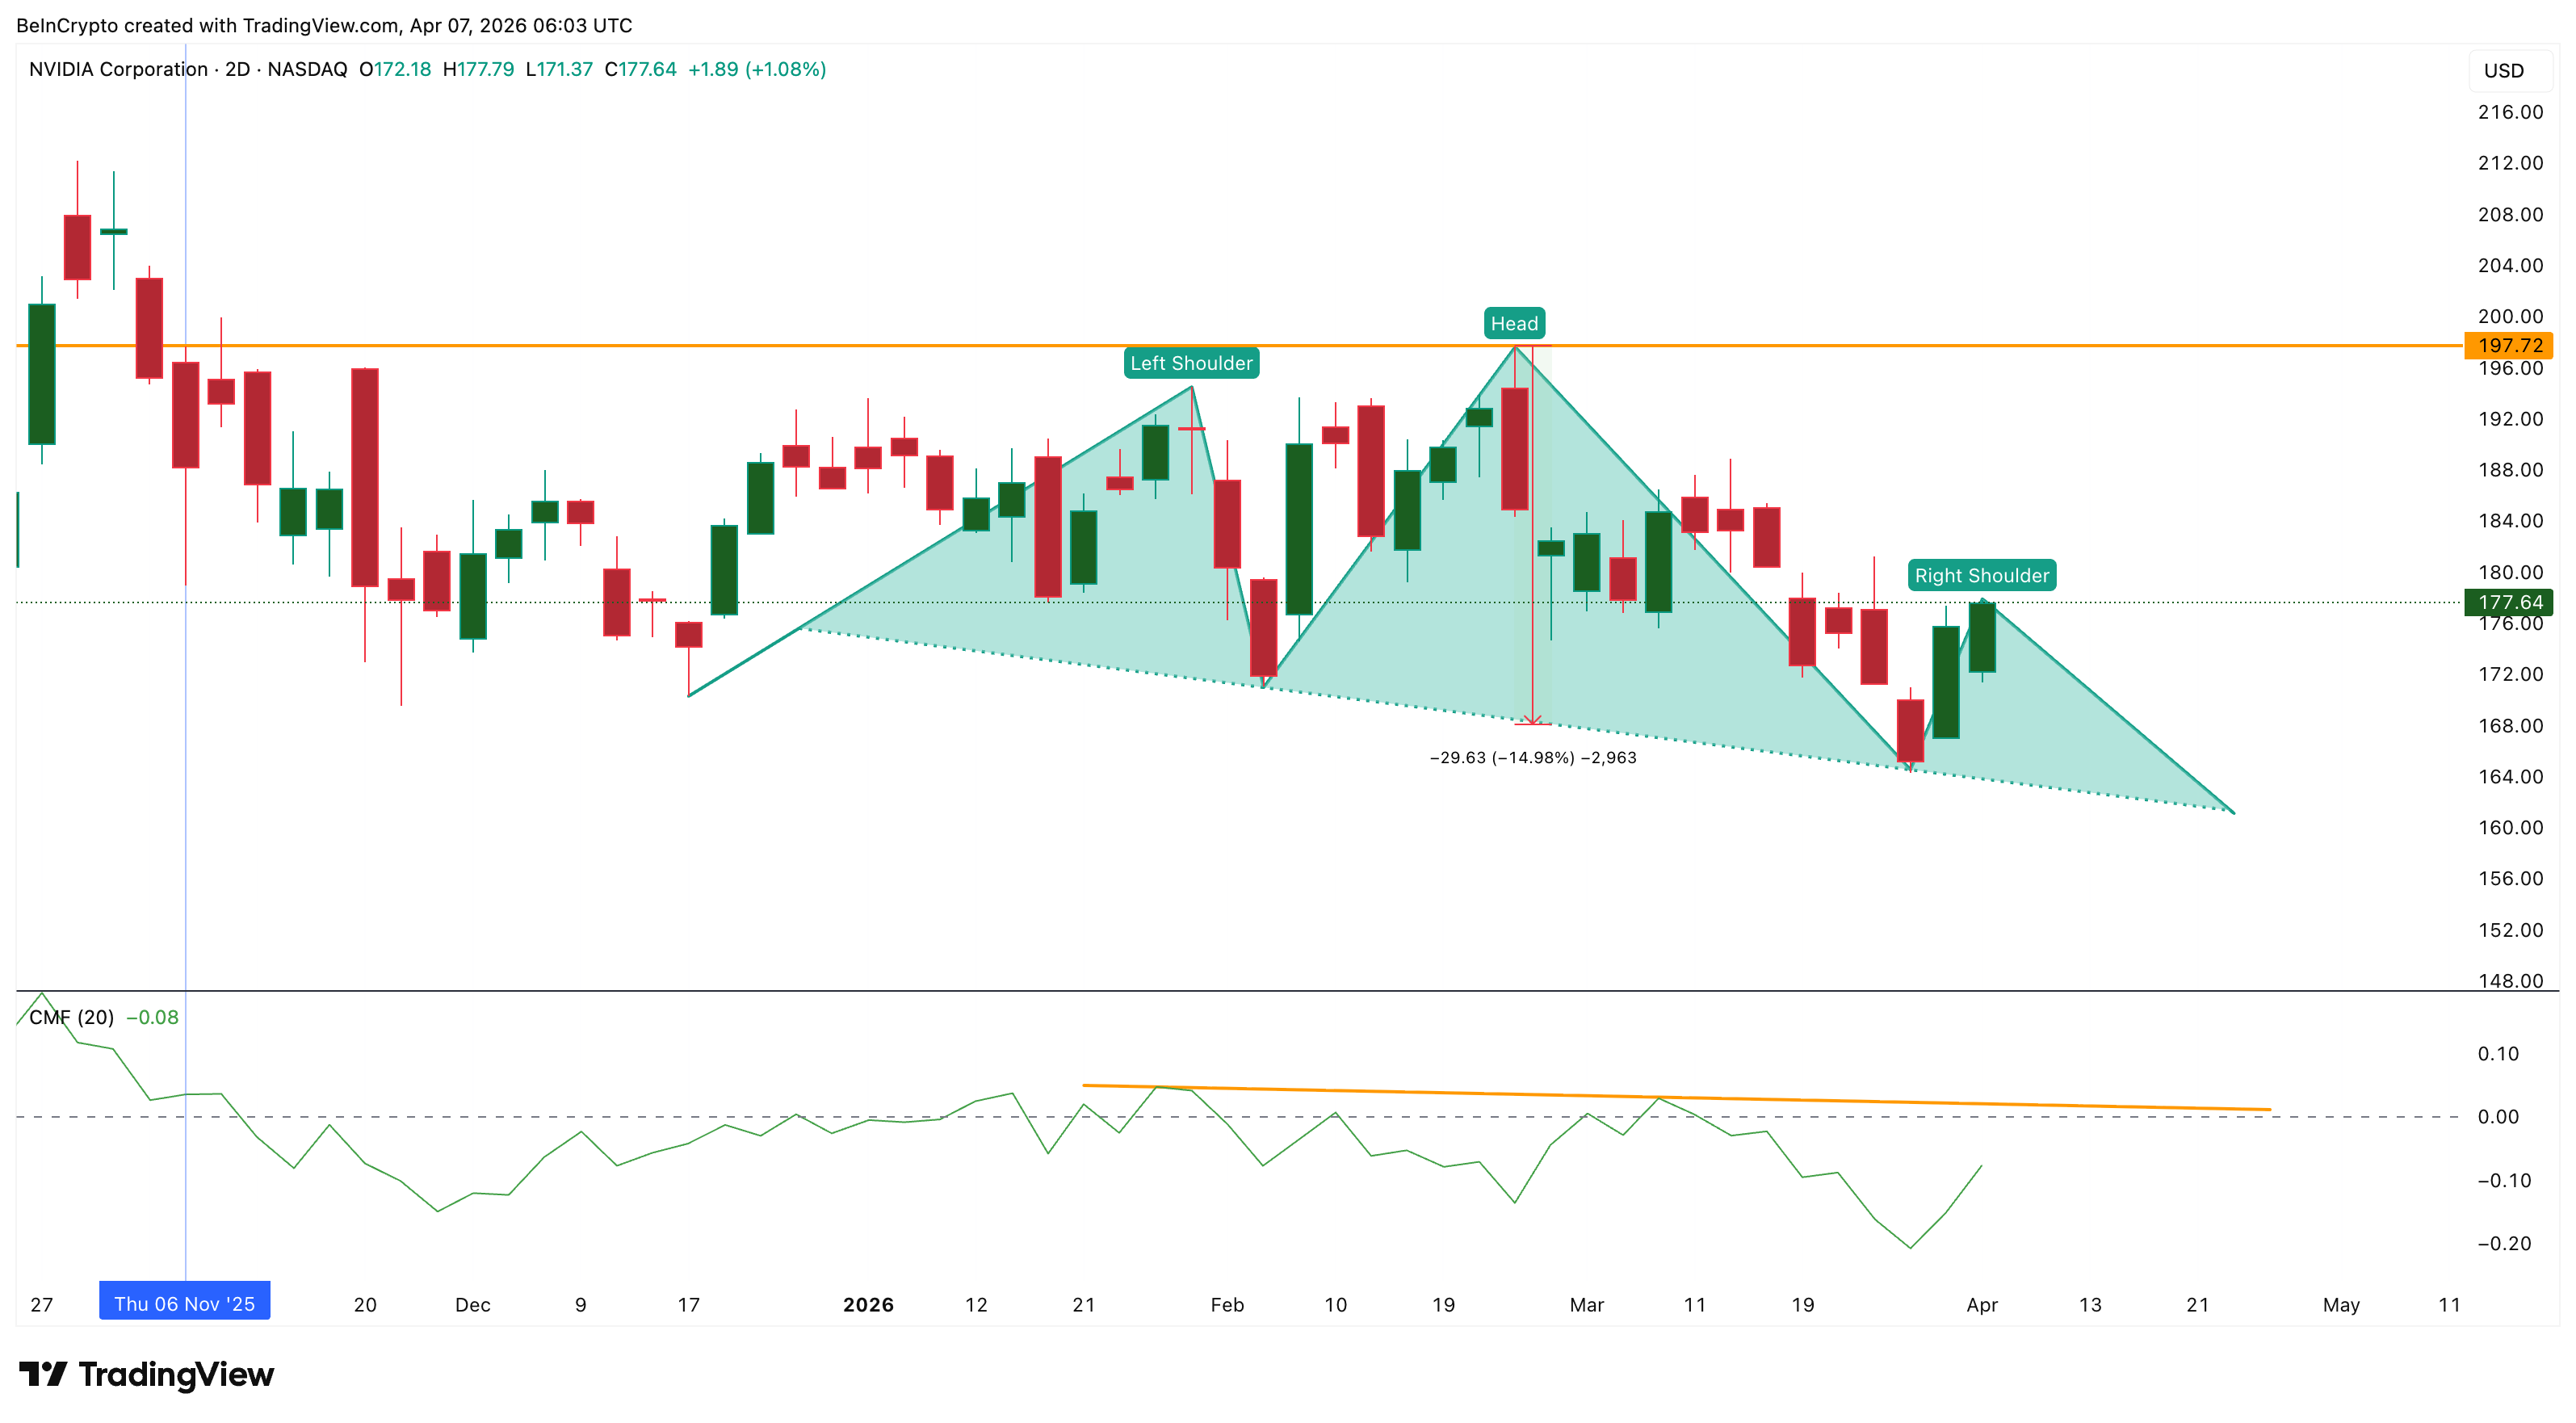
This tells a clear story. Institutional conviction has been limited to earnings events rather than the broader trend. Every bounce that happens while CMF stays negative risks building the right shoulder rather than breaking the pattern. The head at $197.72 is the invalidation level. Anything below it keeps the bearish structure alive.
The economic logic behind the negative CMF connects directly to the macro backdrop. Oil above $111 keeps inflation expectations elevated, which keeps the Fed on hold. Higher-for-longer rates compress multiples on growth stocks, including NVDA. A strengthening dollar adds further pressure on international revenue. These macro headwinds explain why institutional money has not committed despite the price bounce, and that reluctance is now visible in how options traders are positioning.
Options Traders Are Hedging More and Speculating Less
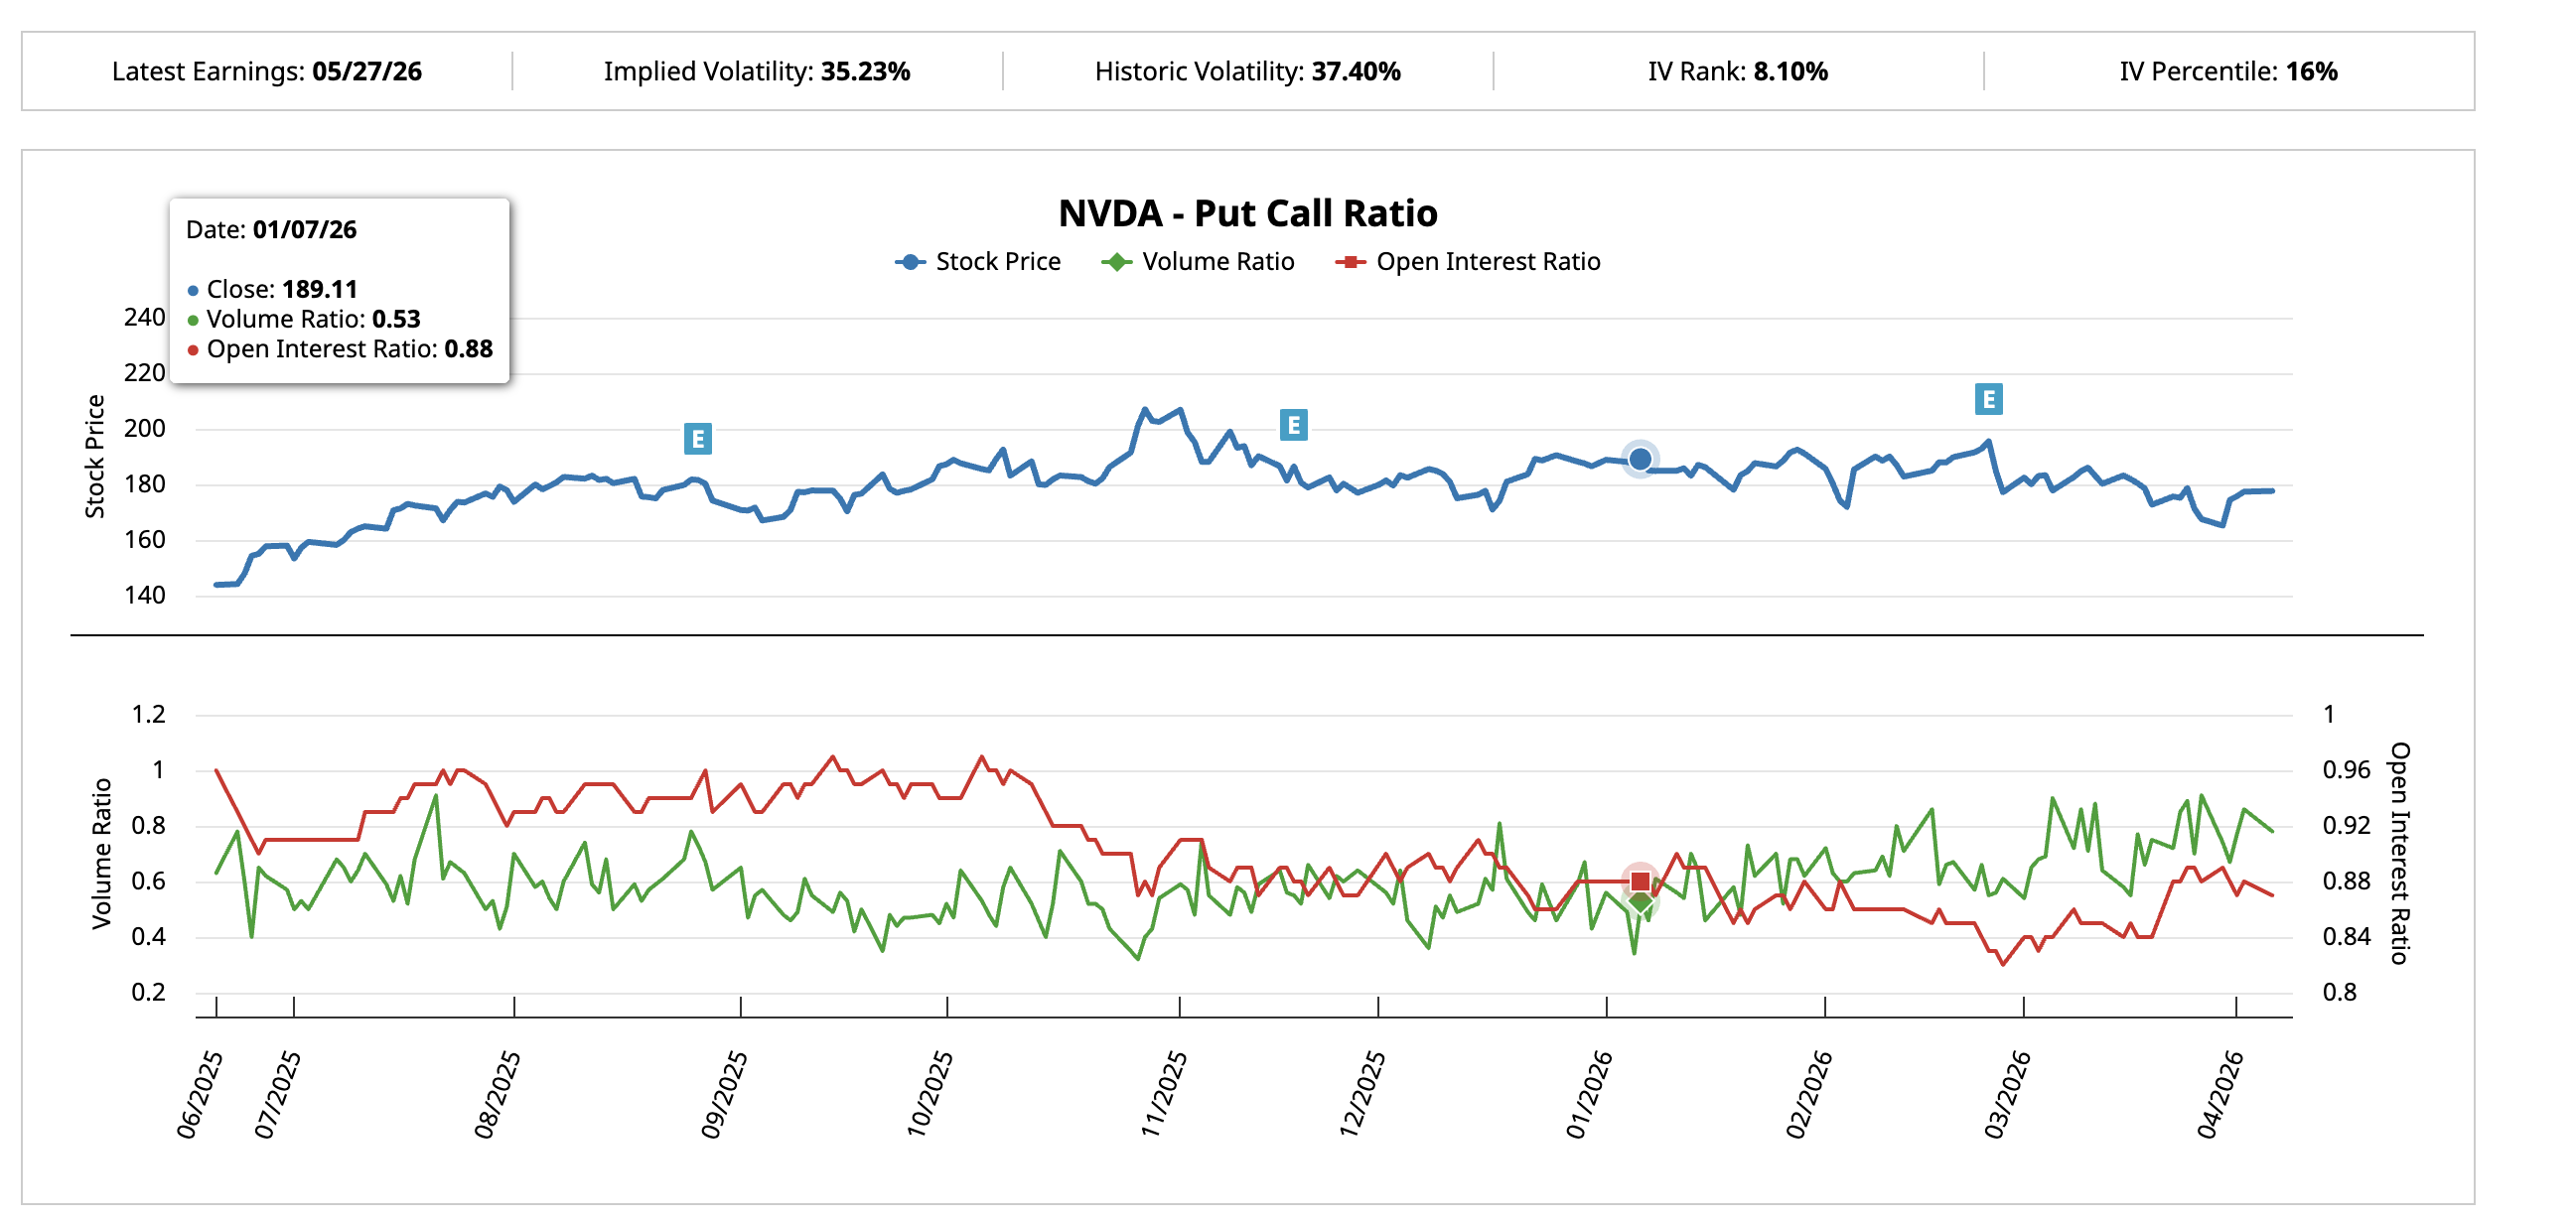
The put-call ratio data from Barchart shows a meaningful shift compared to the last pre-earnings window.
On January 7, with NVIDIA stock price at $189.11 and roughly seven weeks before the February 25 earnings, the put-call volume ratio stood at 0.53. Nearly twice as many calls as puts were trading, reflecting strong bullish conviction. The open interest ratio was 0.88.
By April 6, with a similar window before the late May earnings, the volume ratio has climbed to 0.78. The gap between call and put activity has narrowed significantly. The open interest ratio barely moved at 0.87, meaning structural long positions have held, but new bullish flow has slowed while defensive bets have grown.
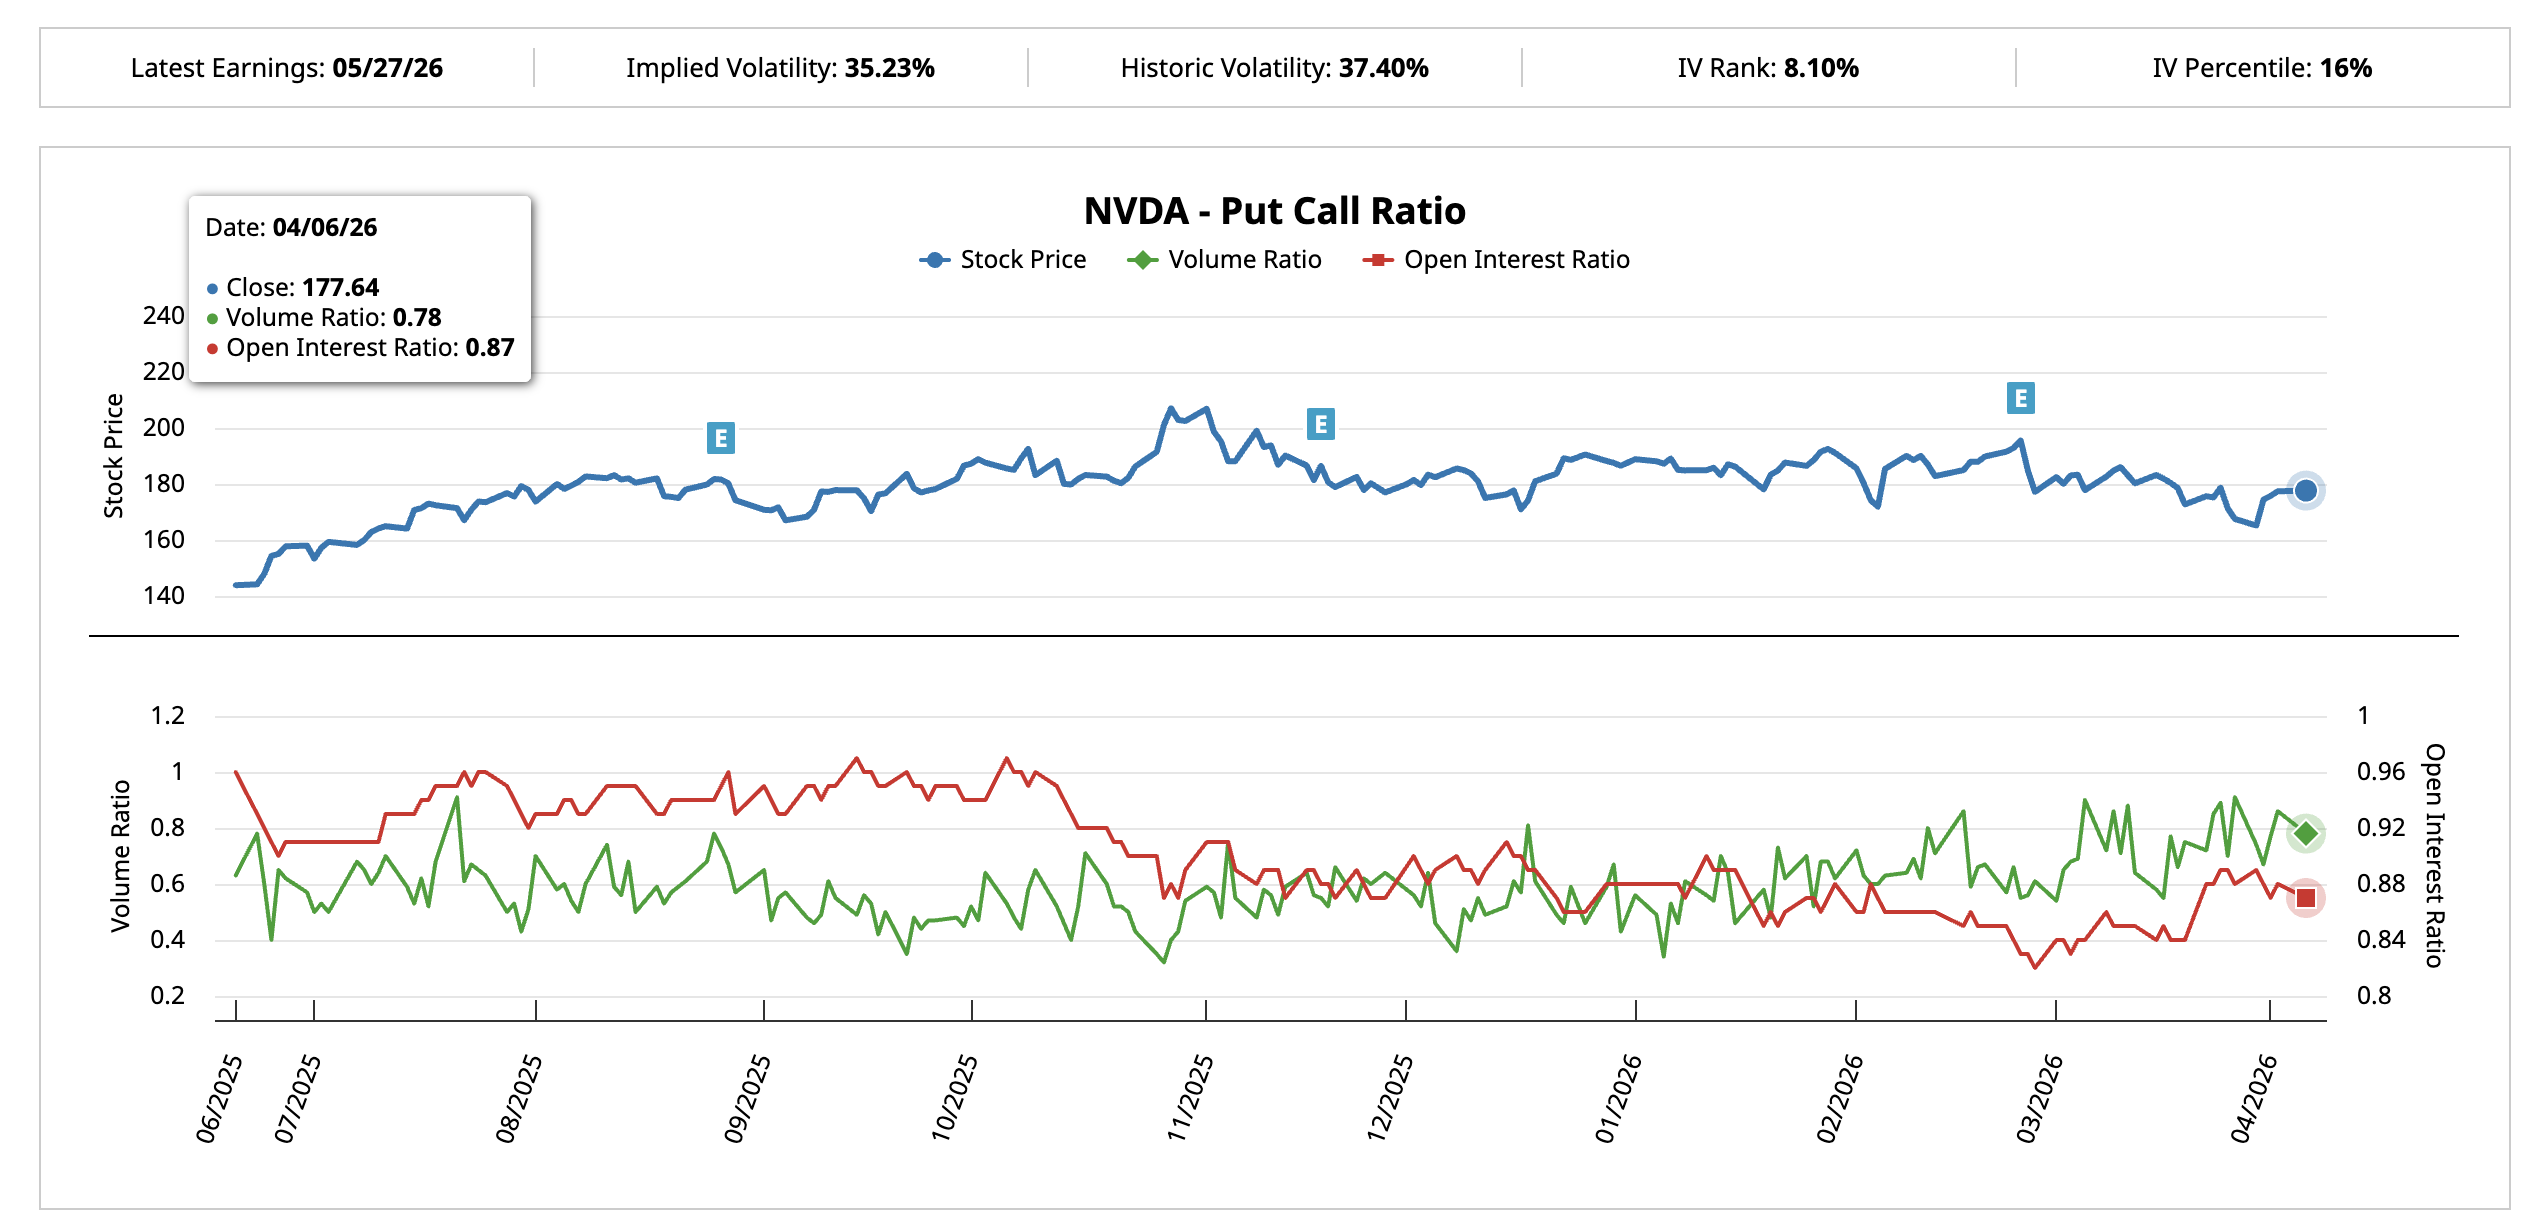
The shift from 0.53 to 0.78 does not mean the market is outright bearish. It means the easy bullishness that preceded the last cycle is gone. Traders are hedging more and speculating less, which aligns with both the negative CMF reading.
The Implied Volatility (IV) Percentile, which measures where current options volatility sits relative to the past year’s range, reads just 16%. The IV Rank, a similar measure that tracks where IV stands between its 52-week high and low, sits at 8.10%.
When IV is this compressed, the market is complacent. Any surprise, whether Iran de-escalation pushing oil lower, a tariff policy shift, or an unexpected pre-earnings development, could trigger outsized moves because options have not priced in the possibility.
The combination of cautious put-call ratios and compressed IV creates a paradox. Traders are positioning more defensively, but the options market itself is not reflecting the magnitude of catalysts that could arrive in April. That disconnect means the price levels become the deciding factor for which scenario plays out.
NVIDIA Stock Price Levels That Define April
The 2-day chart with technical levels frames the month’s range.
NVIDIA stock price sits at $177.64, almost exactly at the key technical level ($177.03). The first upside hurdle is $184.91 at the 0.618 level, one of the strongest technical zones. A move above this would represent the first real test of the upper range and could push prices toward $190.53. The head at $197.72 is the level that invalidates the pattern entirely and shifts the structure bullish.
If Iran de-escalation arrives by late April and oil drops, that scenario gains traction. Falling energy prices would ease inflation fears, bring rate cut expectations forward, and lift growth stock valuations. The compressed IV means any such catalyst would be amplified because options have not priced it in.
On the downside, losing $172.14 at the 0.236 level would suggest the right shoulder has already peaked at $177.97. The neckline sits near $161.35. A confirmed break below the neckline activates the 15% measured move, projecting a decline toward $137.35.
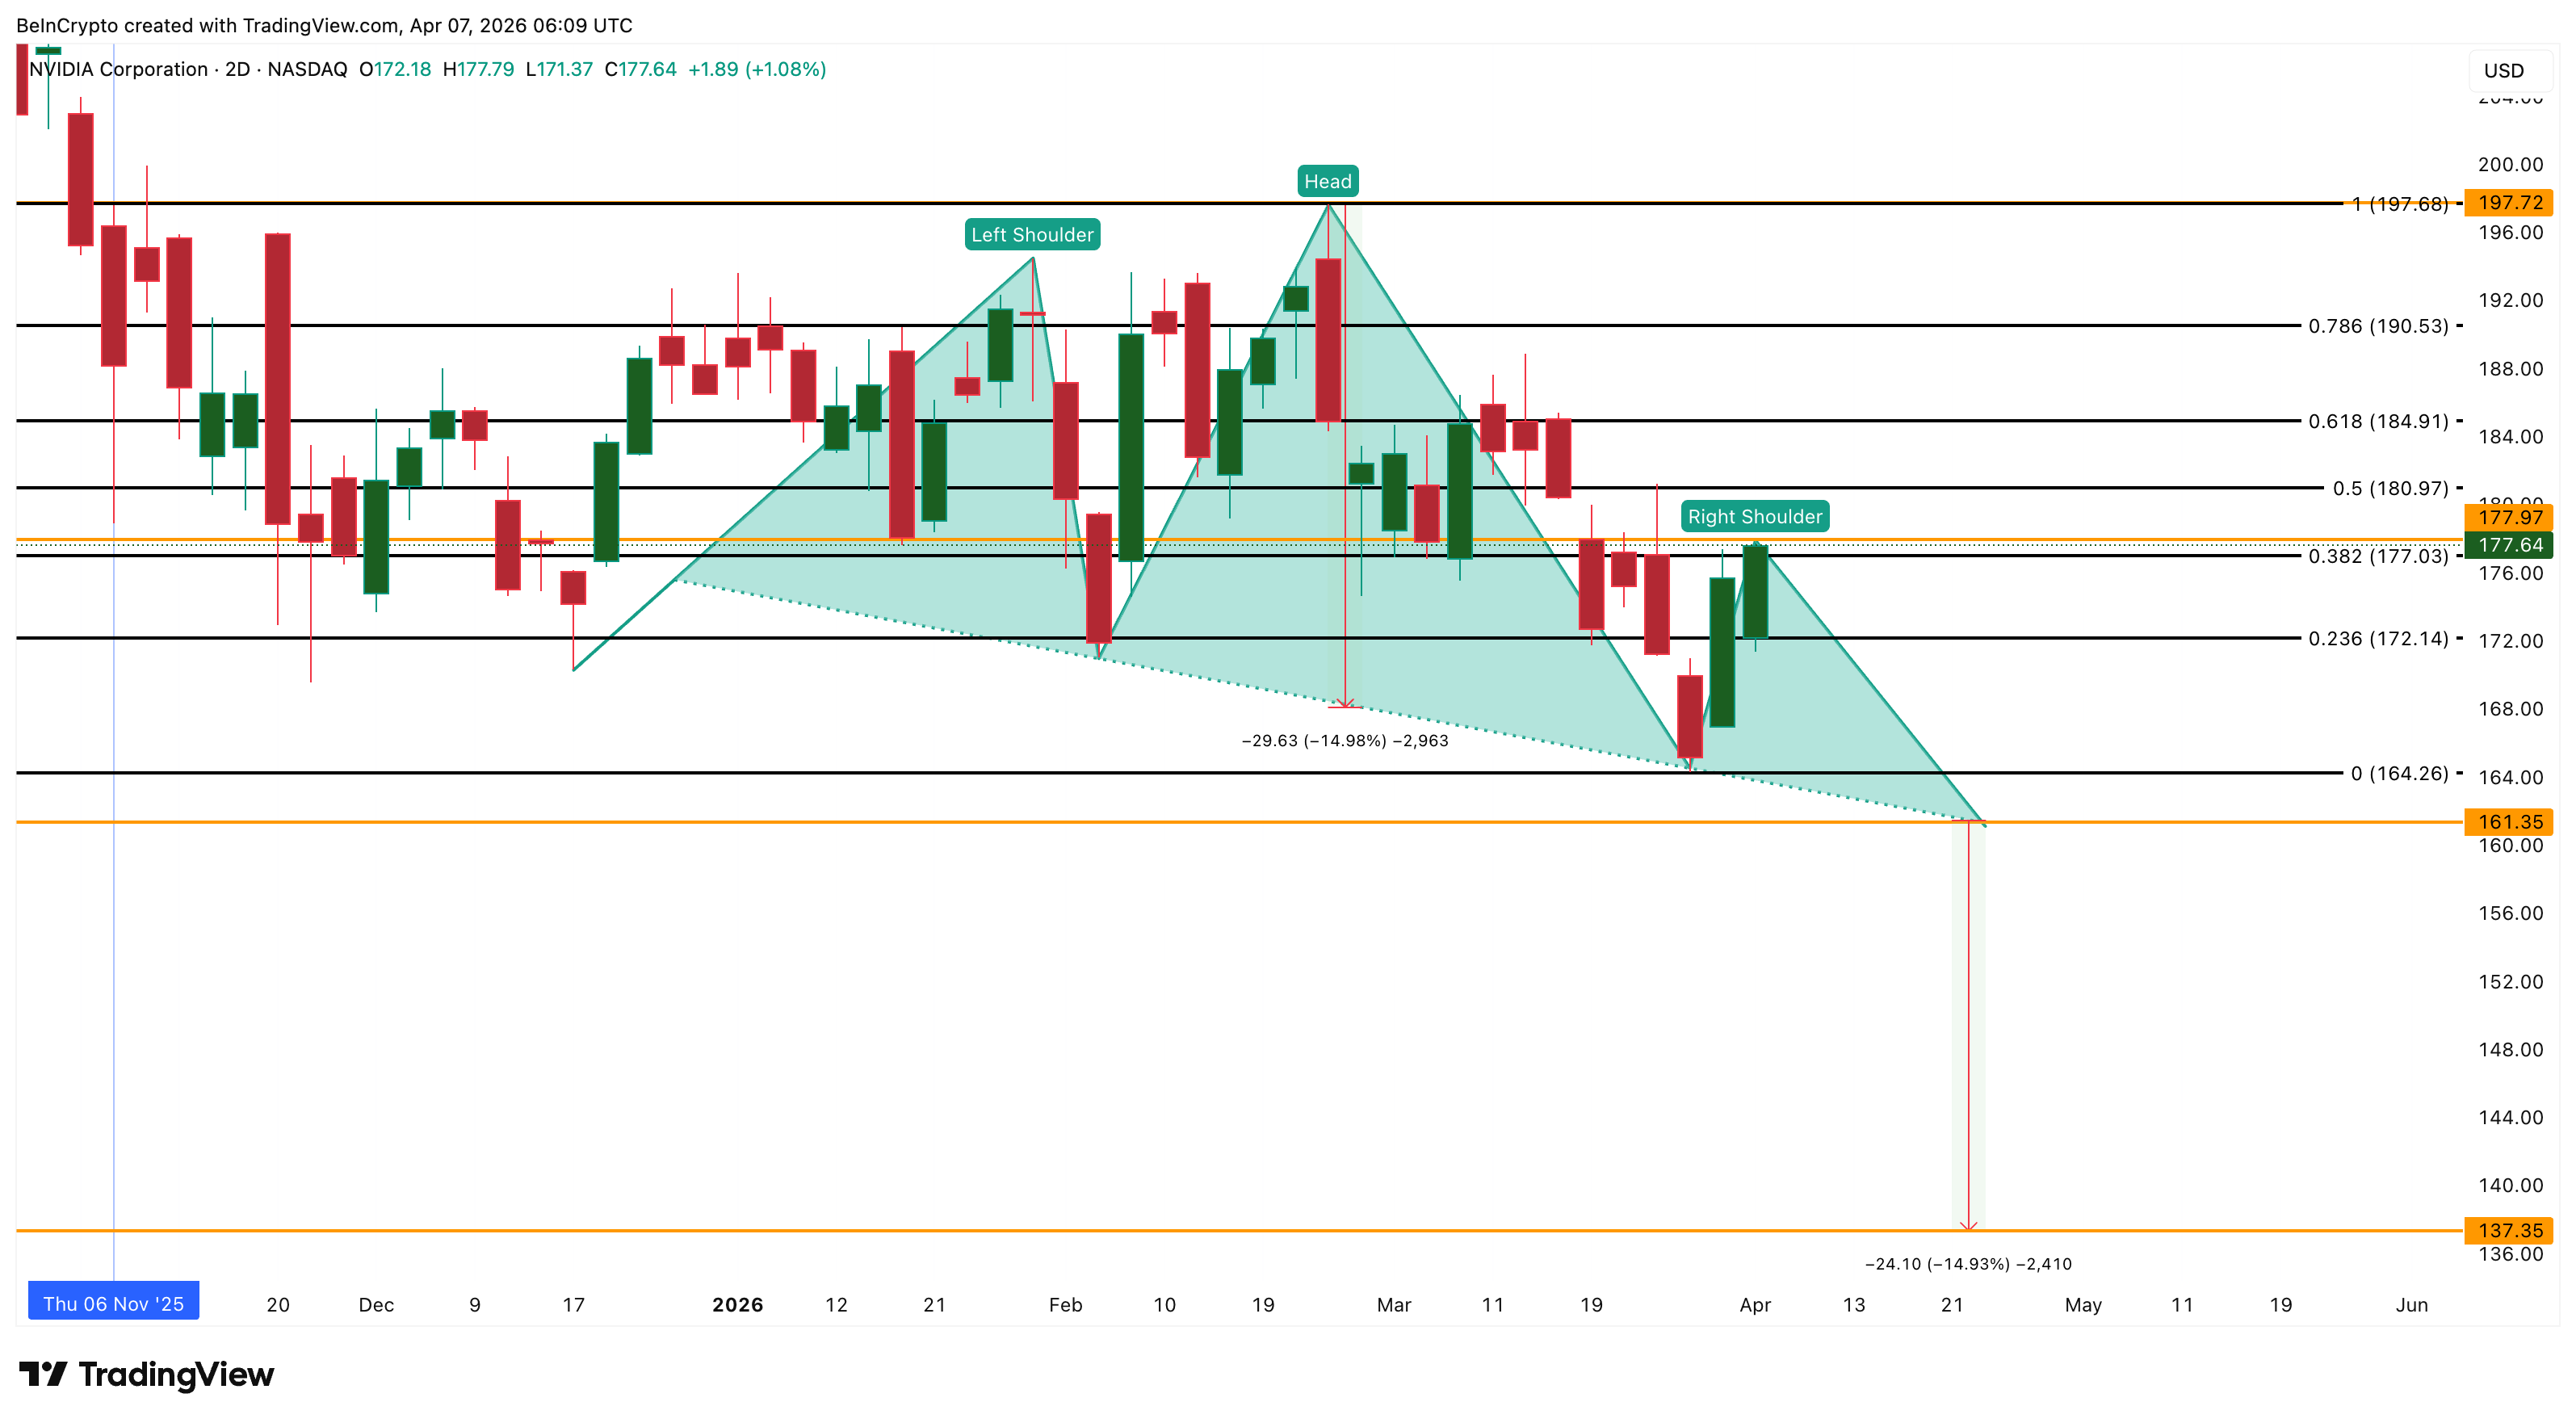
That bearish path becomes more likely if the war extends, oil stays above $110, and the FOMC delivers hawkish language on April 28-29. In that environment, the already-cautious options positioning would accelerate into outright bearishness, and the institutional money that CMF shows has been absent would stay on the sidelines.
April is likely to be defined by which catalyst arrives first. De-escalation and falling oil favor a push toward $184 and $197. Continued conflict and a hawkish Fed favor a drift toward $161 and the neckline test. The put-call shift and low IV confirm the market has not decided yet, making this a month where the resolution could be sharp in either direction.
Disclaimer: The content presented above, whether from a third party or not, is considered as general advice only. CFD trading involves significant risk of loss. Past performance does not guarantee future results. This article serves informational purposes only and does not constitute financial advice. Consider your risk tolerance before trading.


