




MicroStrategy Shares are Performing Better than Bitcoin In 2026, But How?


MicroStrategy stock is up nearly 3% at press time, trading above $137 as markets opened on March 9. Strategy just announced another 17,994 BTC purchase for $1.28 billion.
The stock trades 57% lower over the past six months, yet it’s quietly outperforming both Bitcoin and even Microsoft year to date. The reason is that the company’s amplified volatility is working in shareholders’ favor.
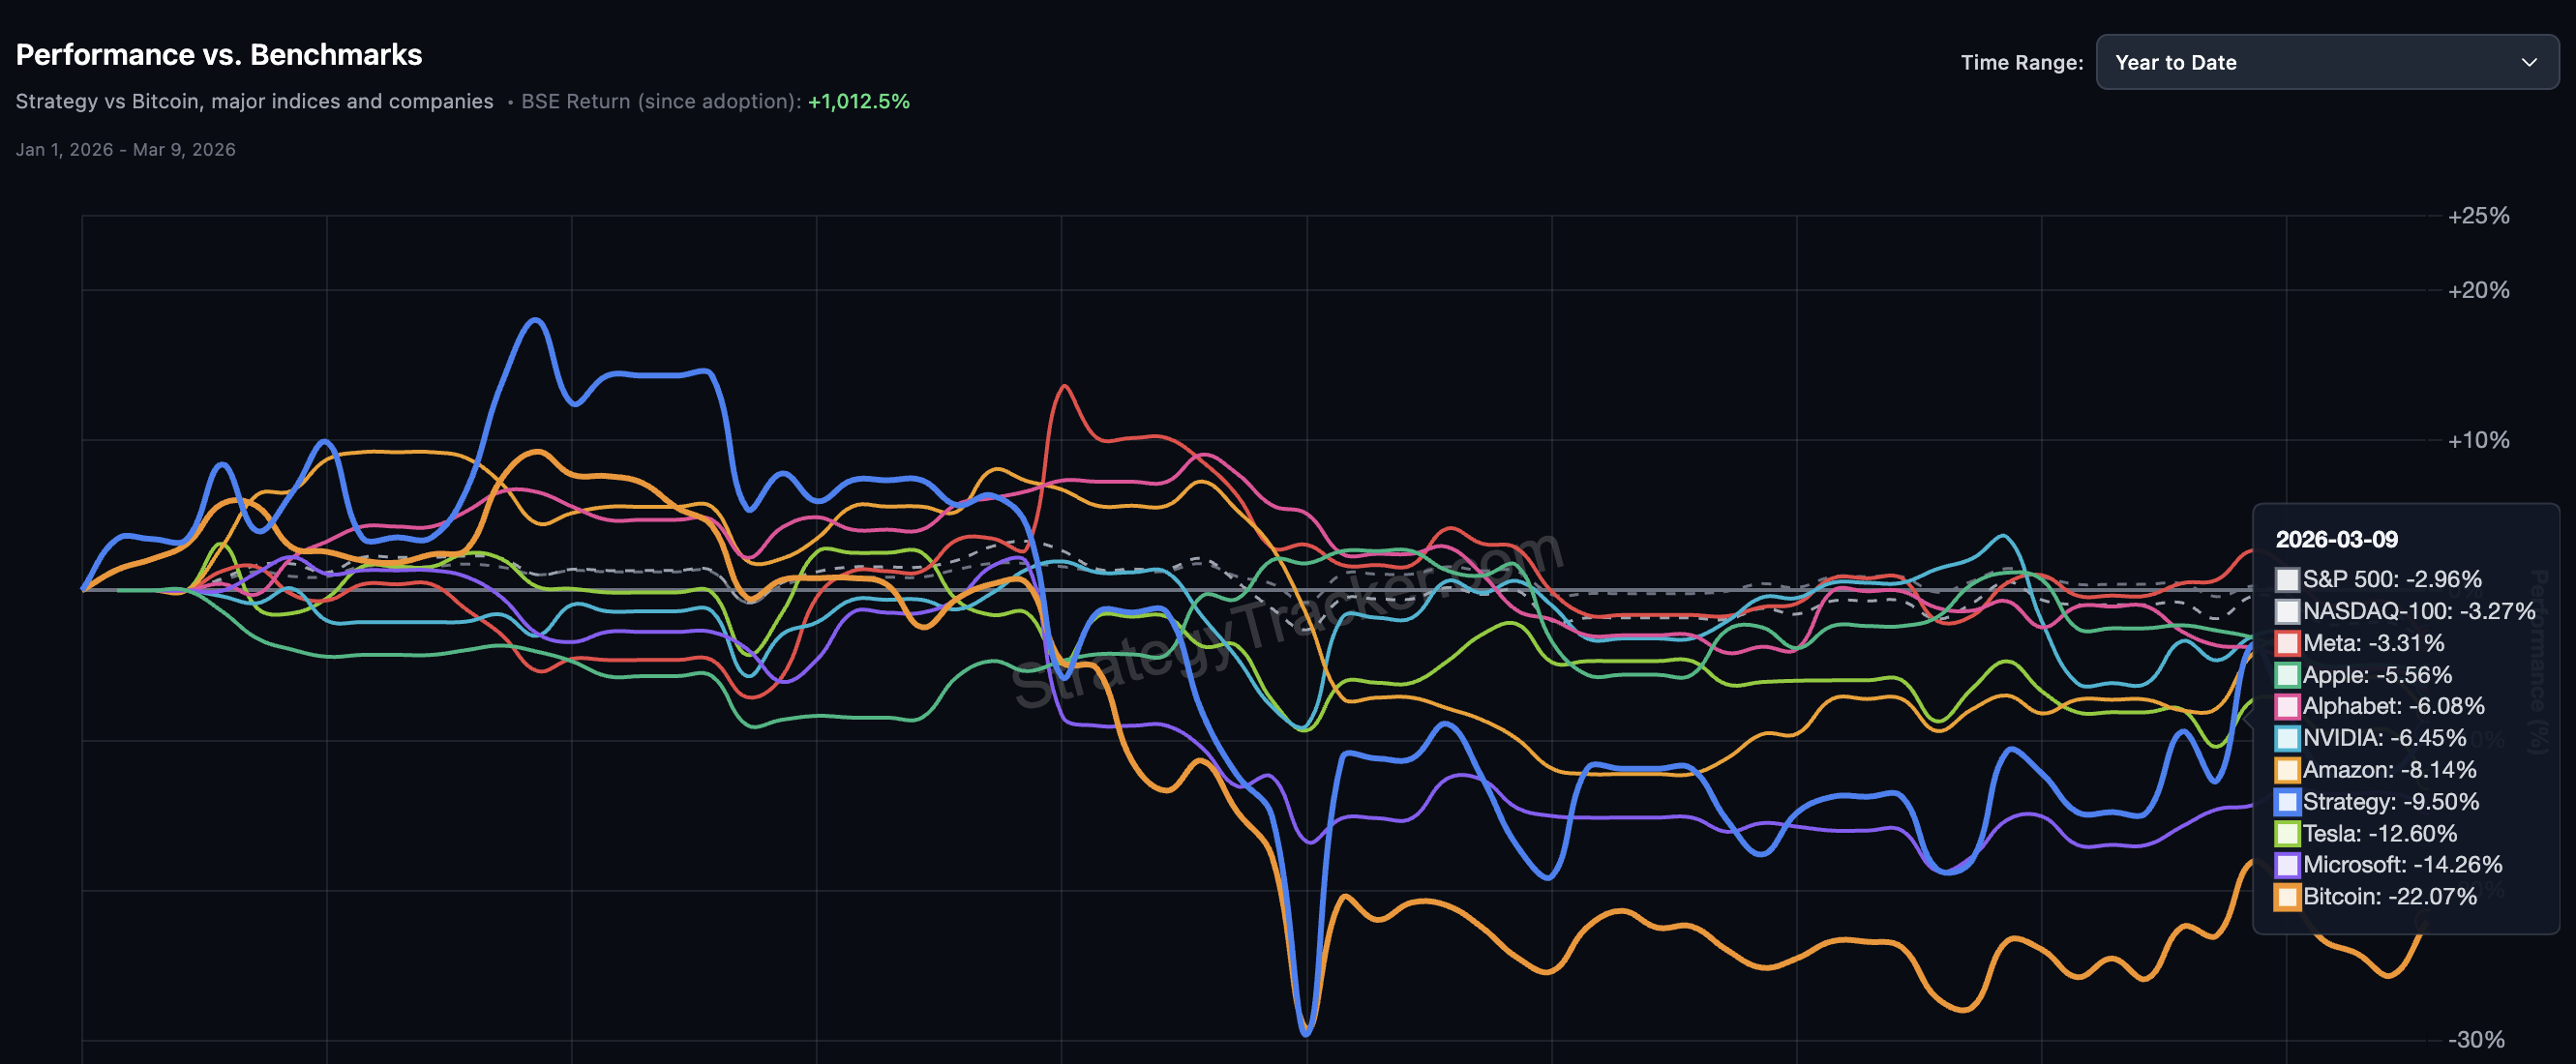
Bitcoin Dropped 22% This Year, But MSTR Held Up Better
Strategy has historically carried a 1.5 to 1.8x beta to Bitcoin, meaning it tends to amplify BTC moves in both directions. But 2026 is telling a different story.
Year to date, Bitcoin is down 22.07% while MicroStrategy stock is down just 9.50%. That’s a downside ratio closer to 0.4x, not 1.8x.
On the upside, however, the amplification is alive. Between February 5 to March 6, MSTR’s price rose roughly 44% within its range, while Bitcoin rose about 15%. That’s closer to a 3x multiplier going up.
That means MSTR has absorbed less than half of Bitcoin’s downside while sitting on a treasury of 738,731 BTC worth approximately $51.1 billion at current prices.
For context, Microsoft is down 14.26% year to date. Tesla is down 12.60%. Amazon is down 8.14%. The S&P 500 and Nasdaq-100 are both in the red.
MicroStrategy shares are performing better than most of the Magnificent Seven despite holding an asset that has dropped over 22% this year.
Want more token insights like this? Sign up for Editor Harsh Notariya’s Daily Crypto Newsletter here.
The big money appears to be noticing. Chaikin Money Flow (CMF) crossed above the zero line around February 25 and has continued to trend higher, even as MicroStrategy’s stock price has trended lower since mid-January.
Big money flows may have cushioned the price better than BTC.
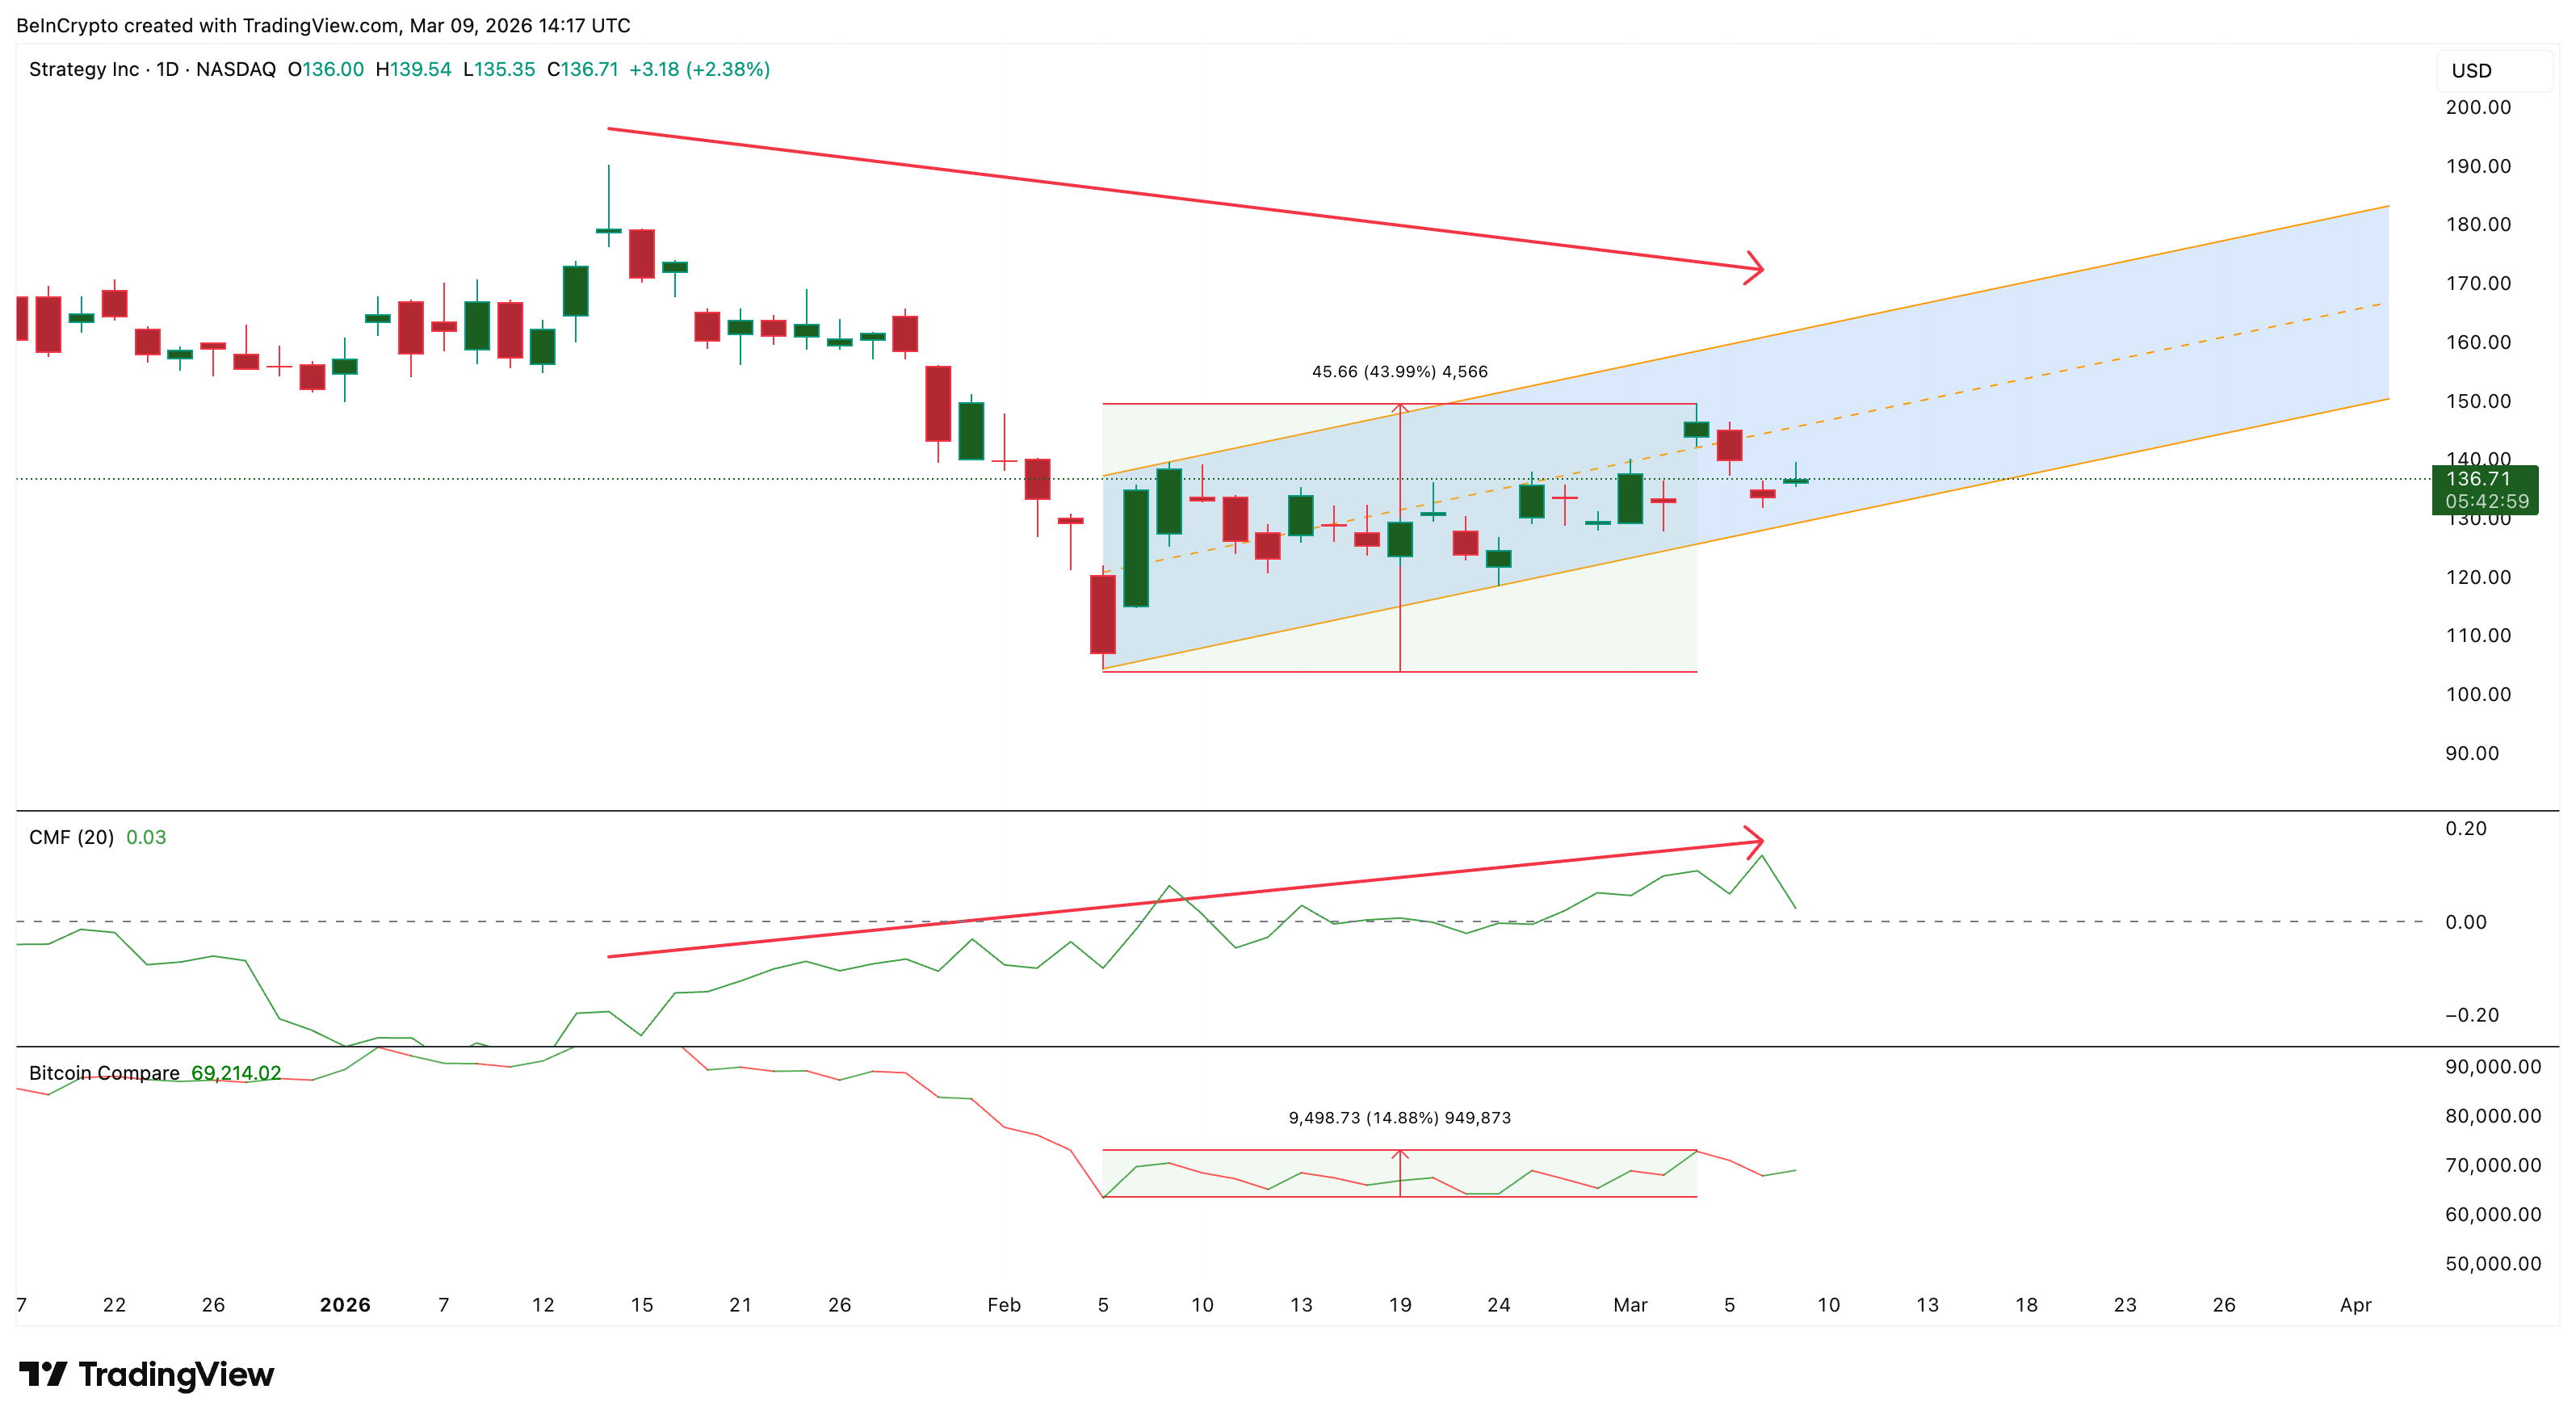
That divergence between falling price and rising CMF is consistent with larger players building positions at discounted levels. But now you can see the CMF dipping, which brings us to the next bit.
The mNAV Discount Pulled Smart Money In, Now the Dividend Keeps Them
The mNAV, or multiple to net asset value, compares Strategy’s market cap to the Bitcoin it holds. The diluted formula divides the effective diluted shares by the BTC holdings, then multiplies the result by the BTC price.
A ratio below 1.0x means the stock trades for less than its Bitcoin (desirable).
In late December 2025, diluted mNAV hit 0.92x: 342.97 million shares at $158.81 versus 671,268 BTC at $87,808. MicroStrategy shares were 8% cheaper than the Bitcoin on the books. That explains why
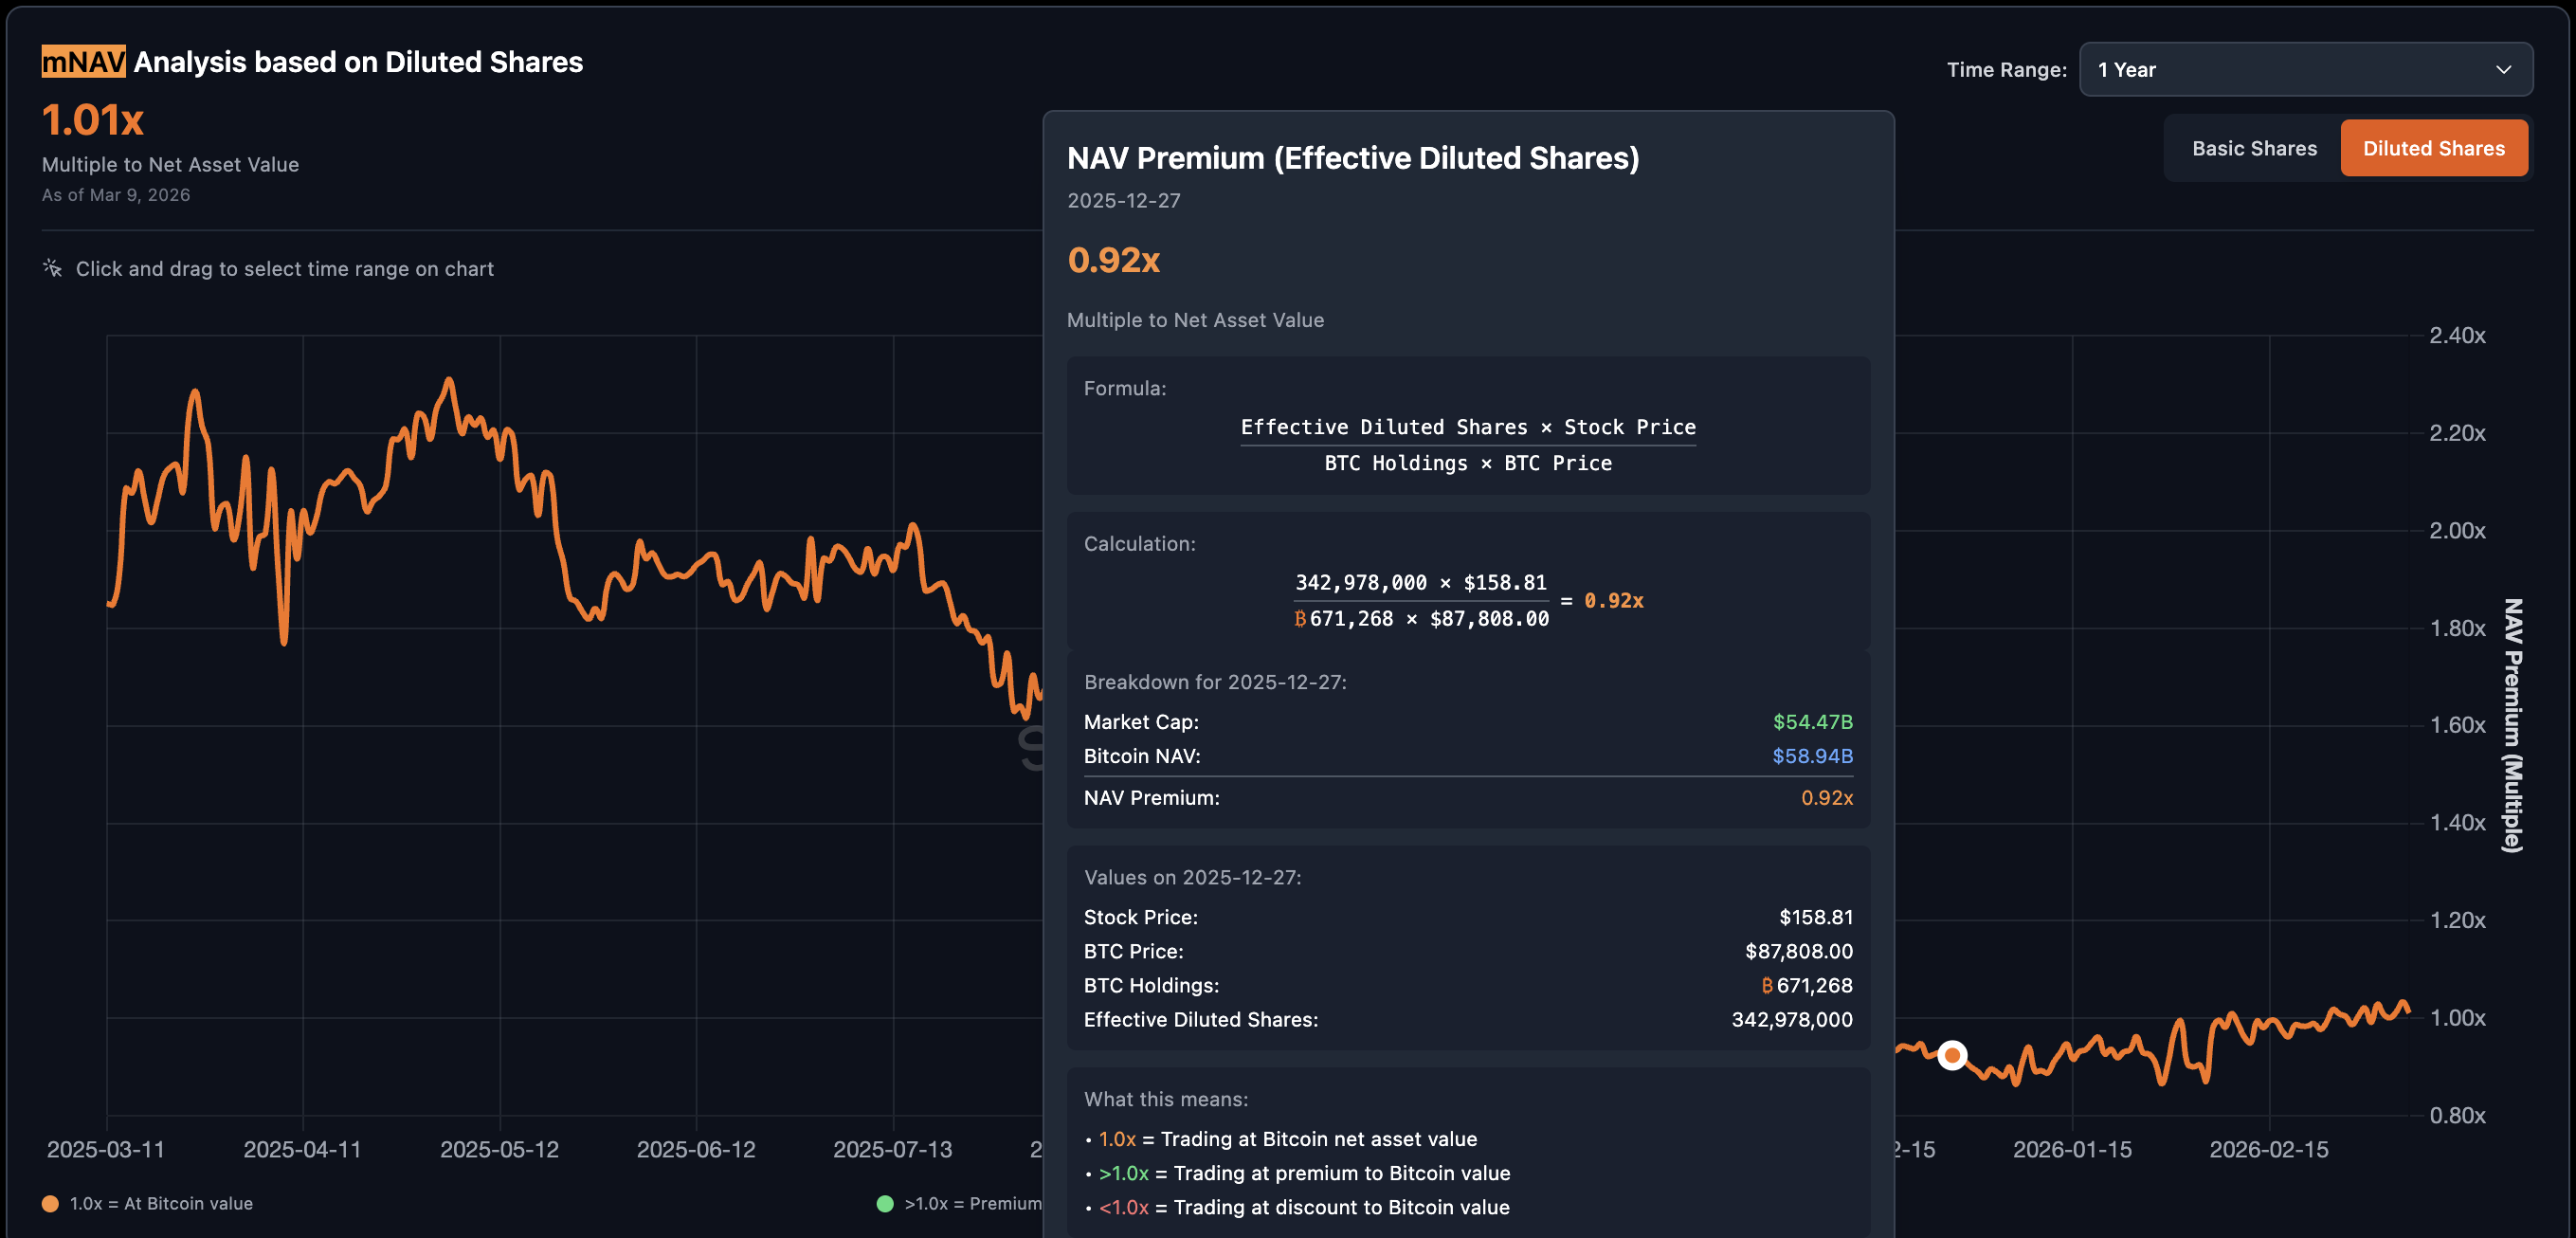
Over the following weeks, CMF crossed above zero, confirming that larger players were buying the discount. But as of March 9, the gap has closed.
With 374.5 million diluted shares at above $137 and 738,731 BTC at above $69,100, diluted mNAV now reads 1.01x. The discount entry has been completed, and CMF is trending back down accordingly.
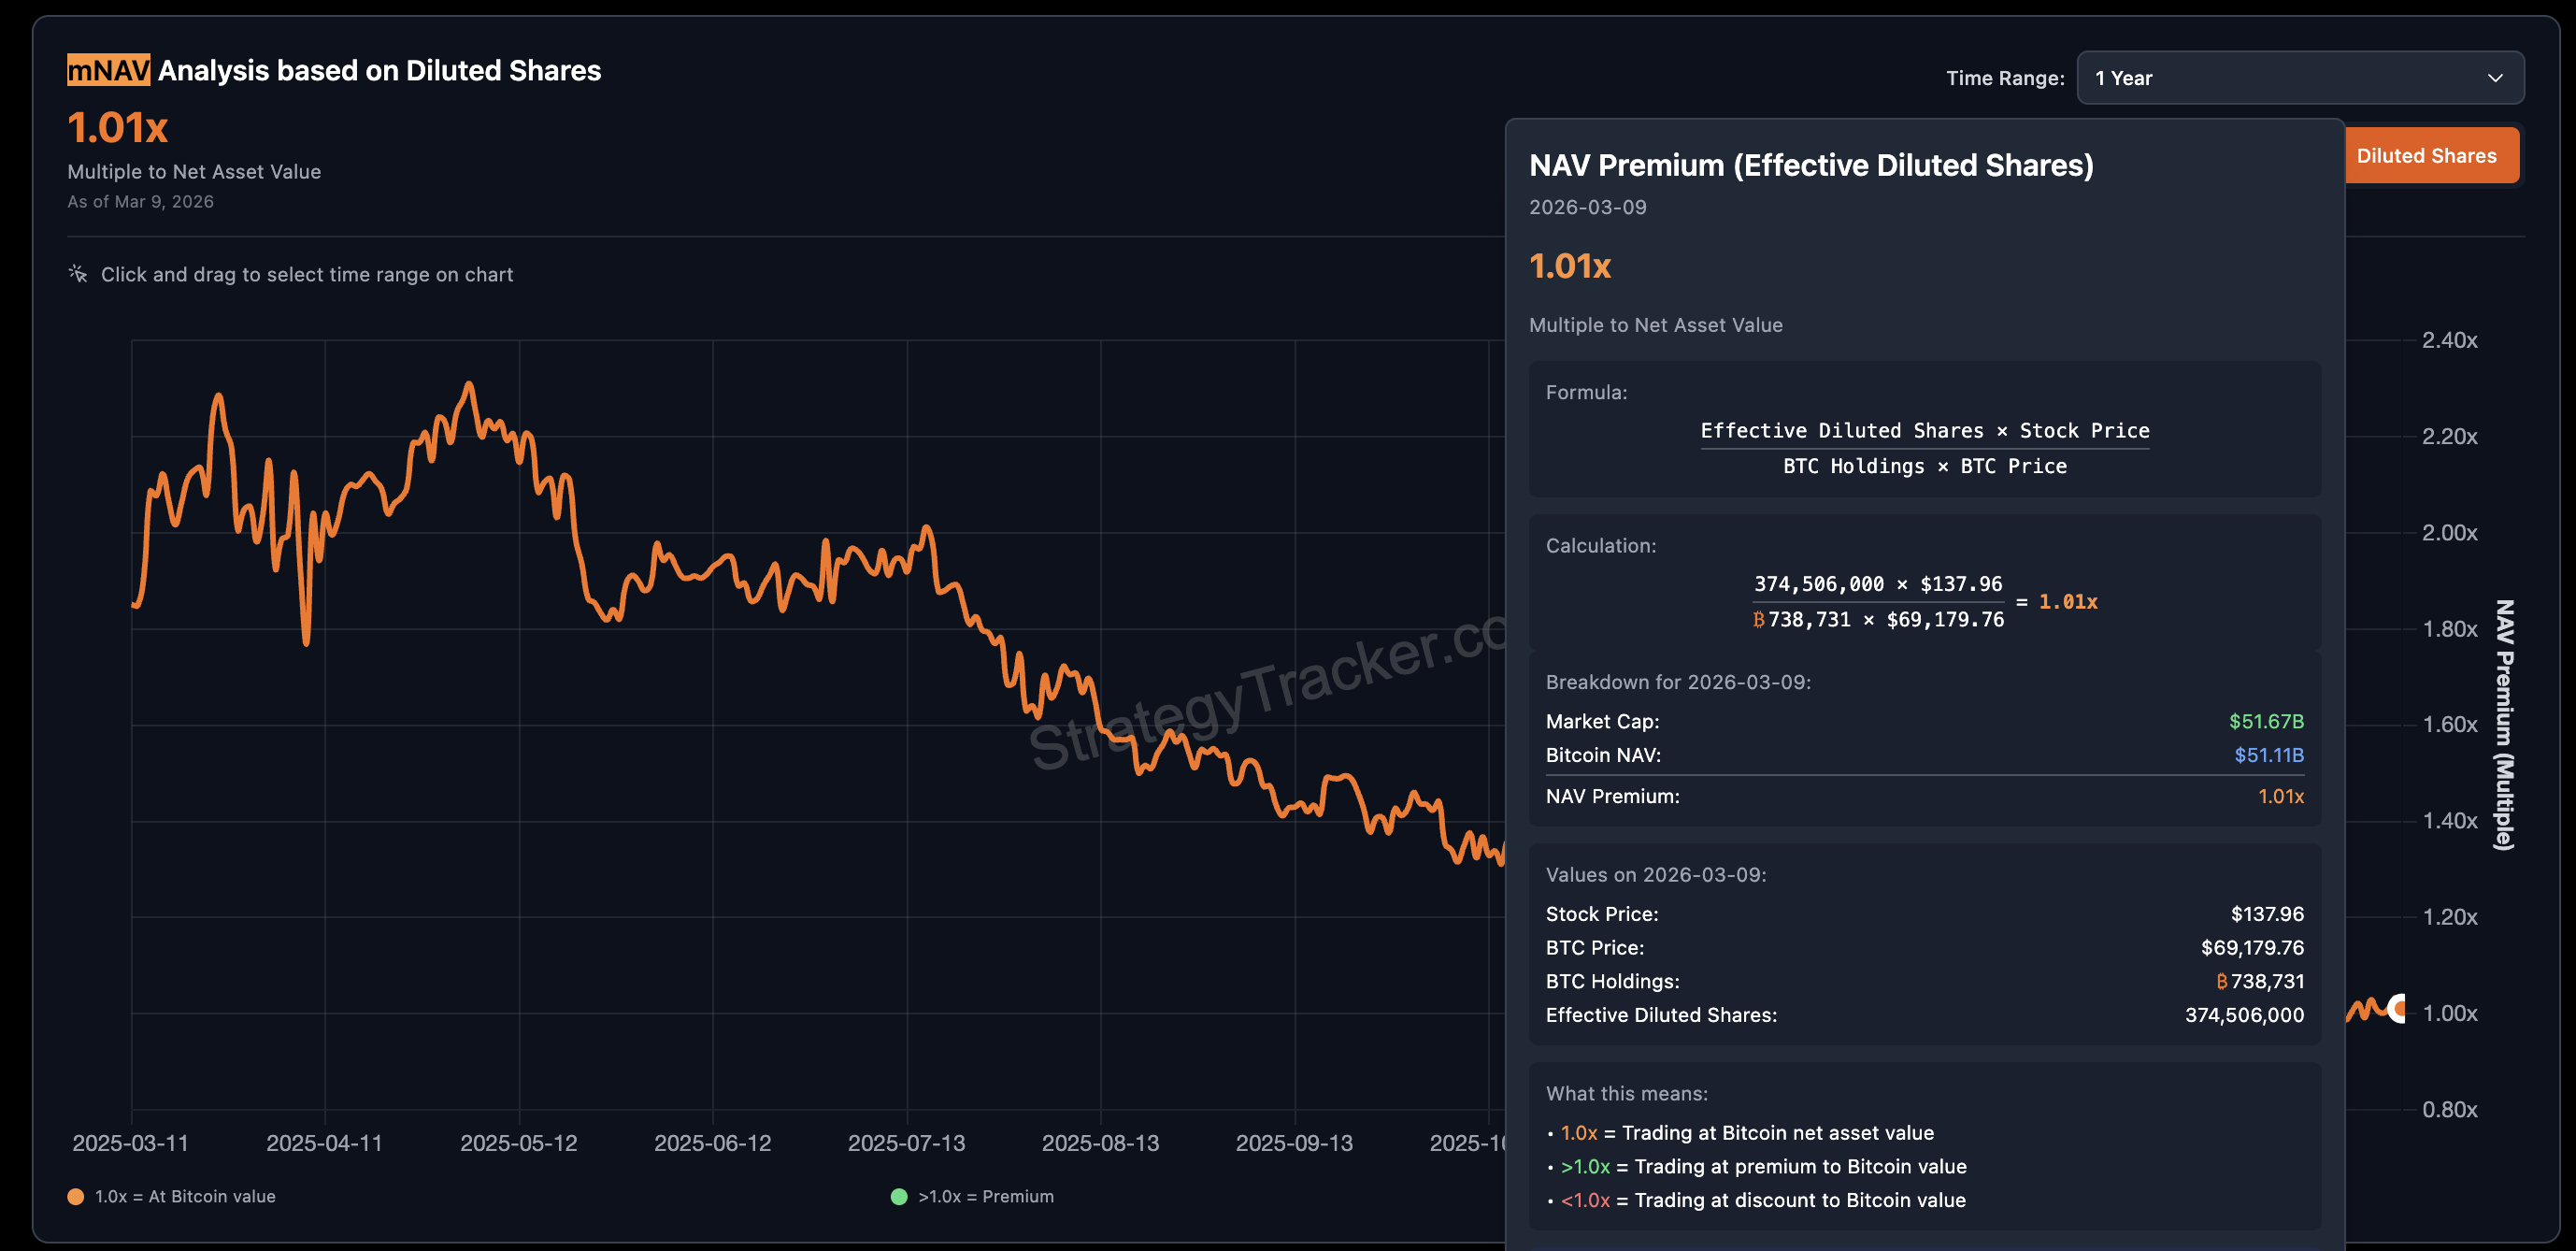
But STRC, Strategy’s Variable Rate Series A Perpetual Preferred Stock, is still working. STRC pays an 11.50% annualized dividend, its seventh consecutive rate hike, distributed monthly in cash.
For income investors with no interest in direct Bitcoin exposure, that yield alone is the draw.
STRC could be a reason why MSTR’s On-Balance Volume (OBV), a proxy for retail interest, trended higher through the entire price rise phase, even as the mNAV discount disappeared.
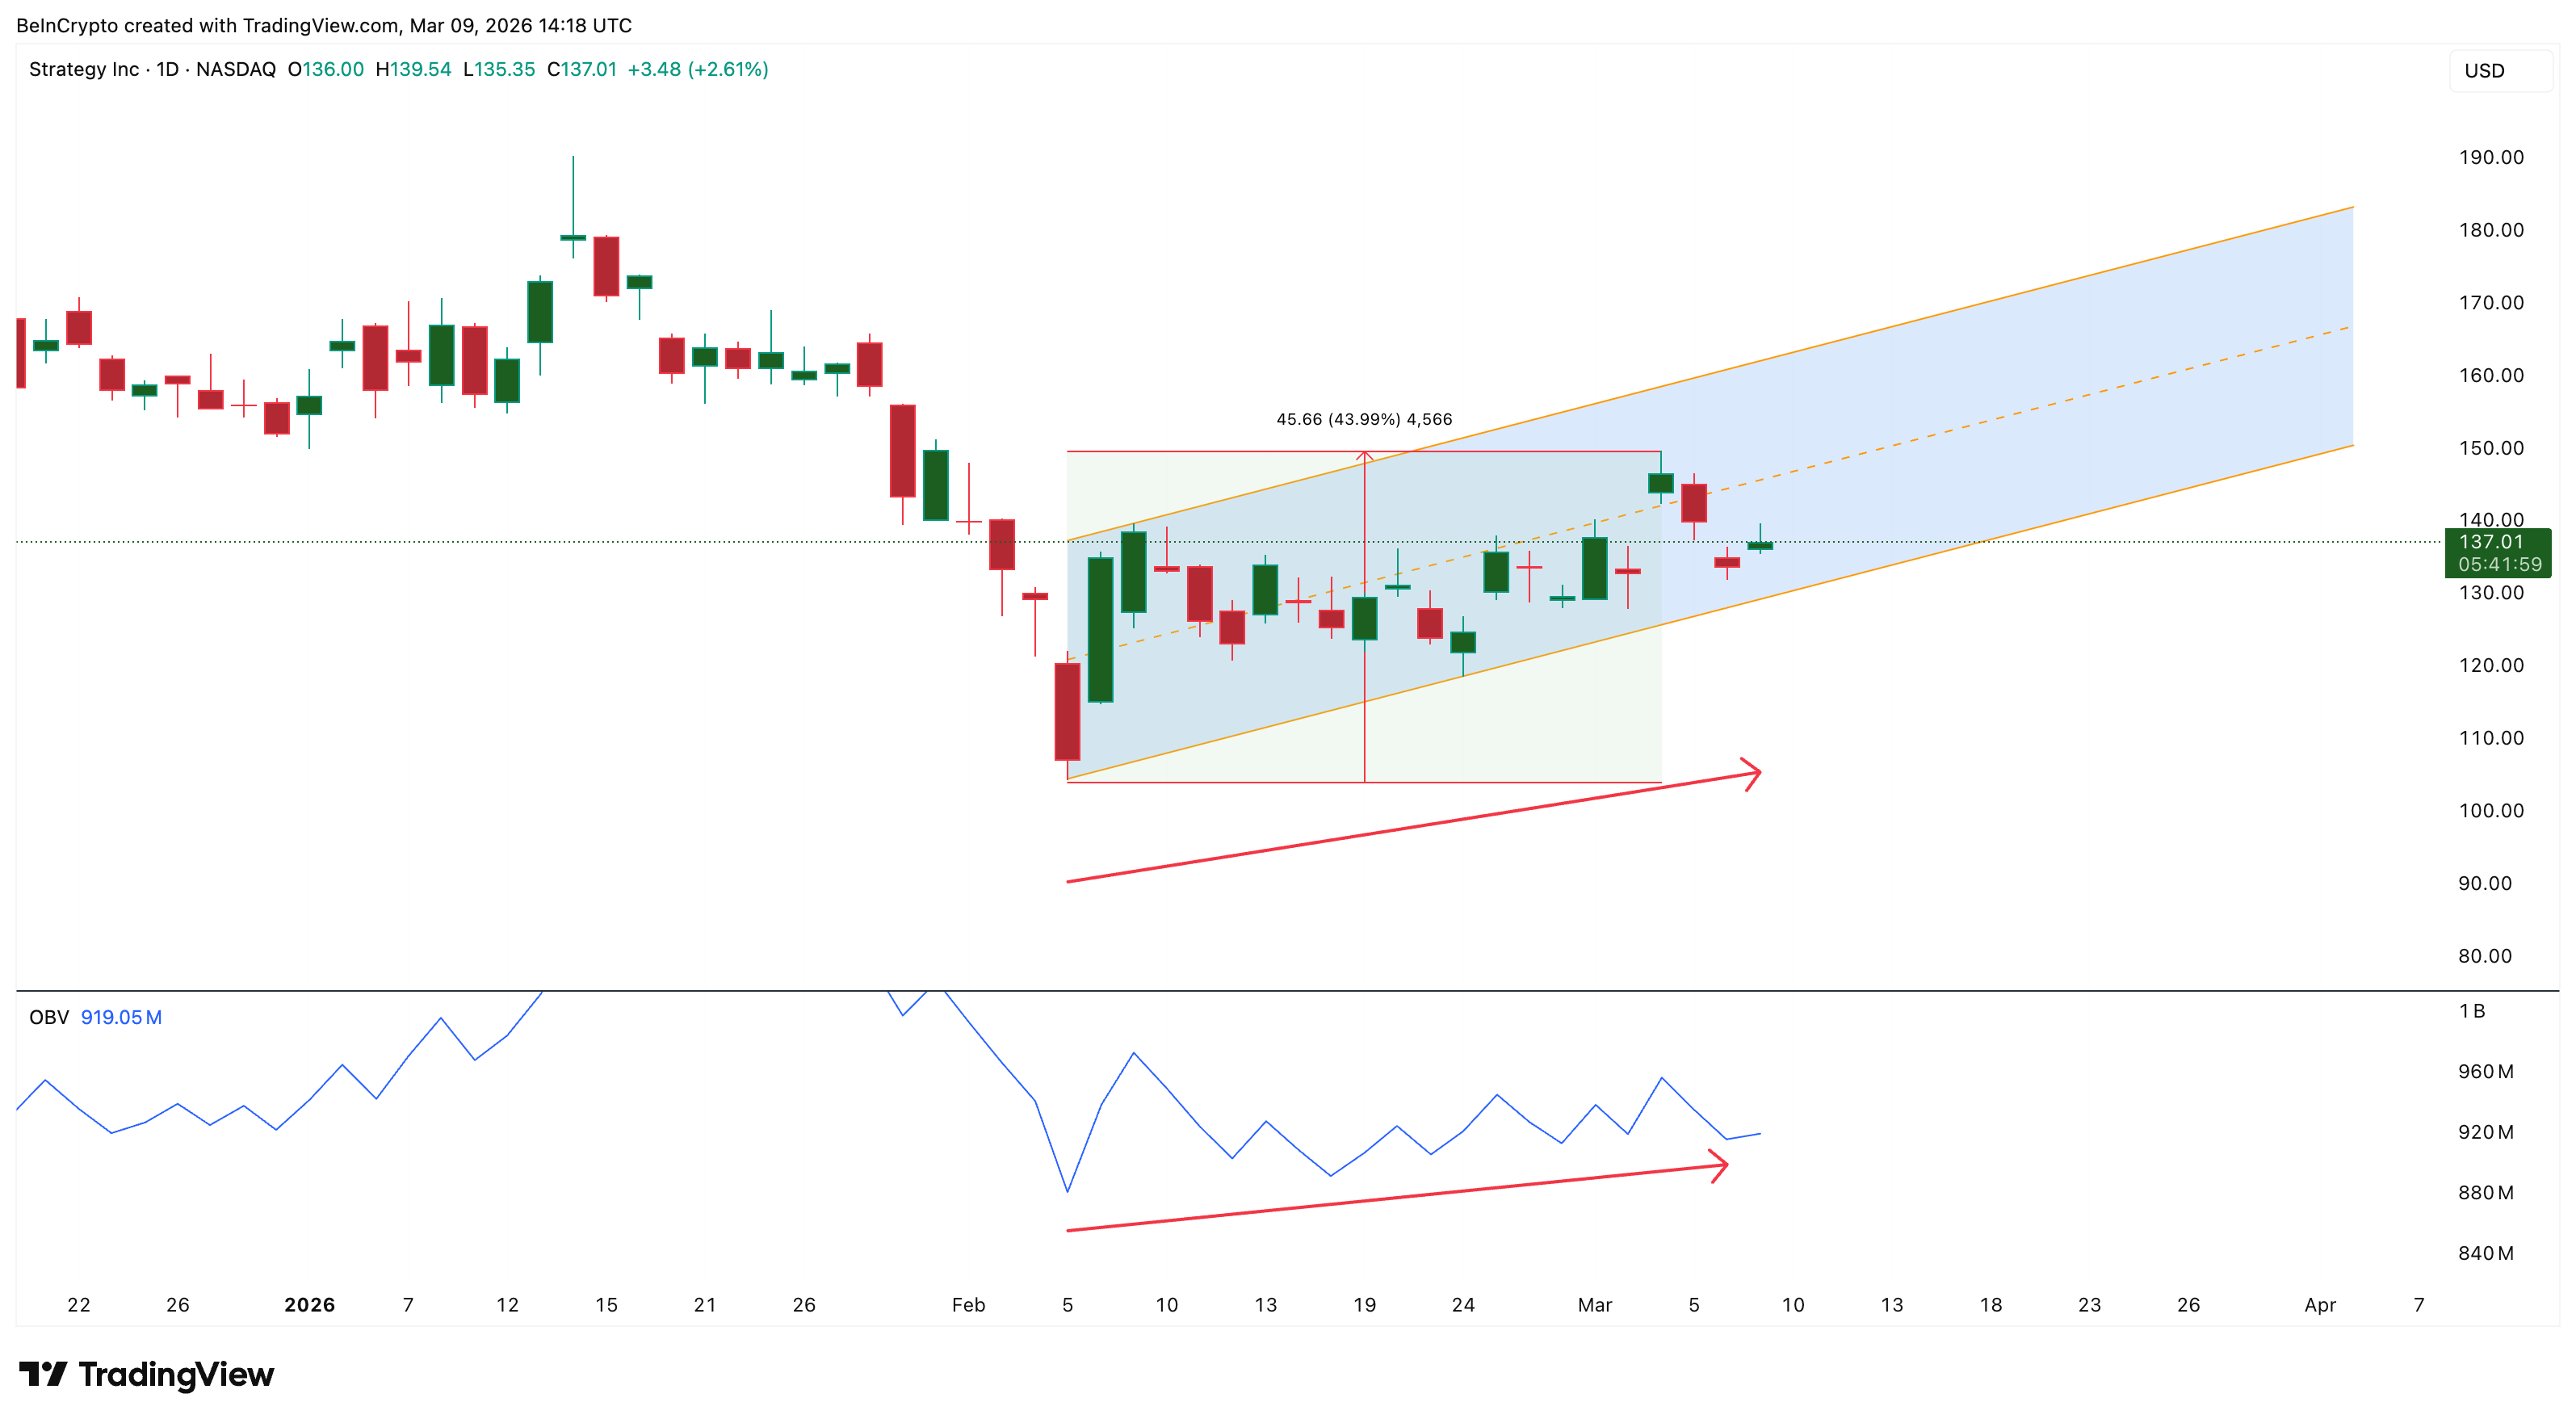
So here is the full loop in 2026:
Down: Bitcoin drops, MSTR drops lower but at a softer ratio than expected. The mNAV still compresses below 1.0x, and common equity investors get BTC at a discount.
Up: Bitcoin bounces, MSTR rises 3x faster, mNAV re-expands above 1.0x & Strategy raises capital at a premium, buys more BTC, STRC coverage ratio improves.
Both sides feed the treasury. Reads more like “Feature, Not a Bug”.
MSTR Price Needs a Close Above $140 to Unlock Higher Levels
The technical structure of MicroStrategy stock supports the fundamental case, but it comes with a clear line in the sand.
Between early January and early March, the price carved out lower lows while the relative strength index (RSI), a momentum indicator, printed higher lows. That’s a standard bullish divergence, and it was active through March 6.
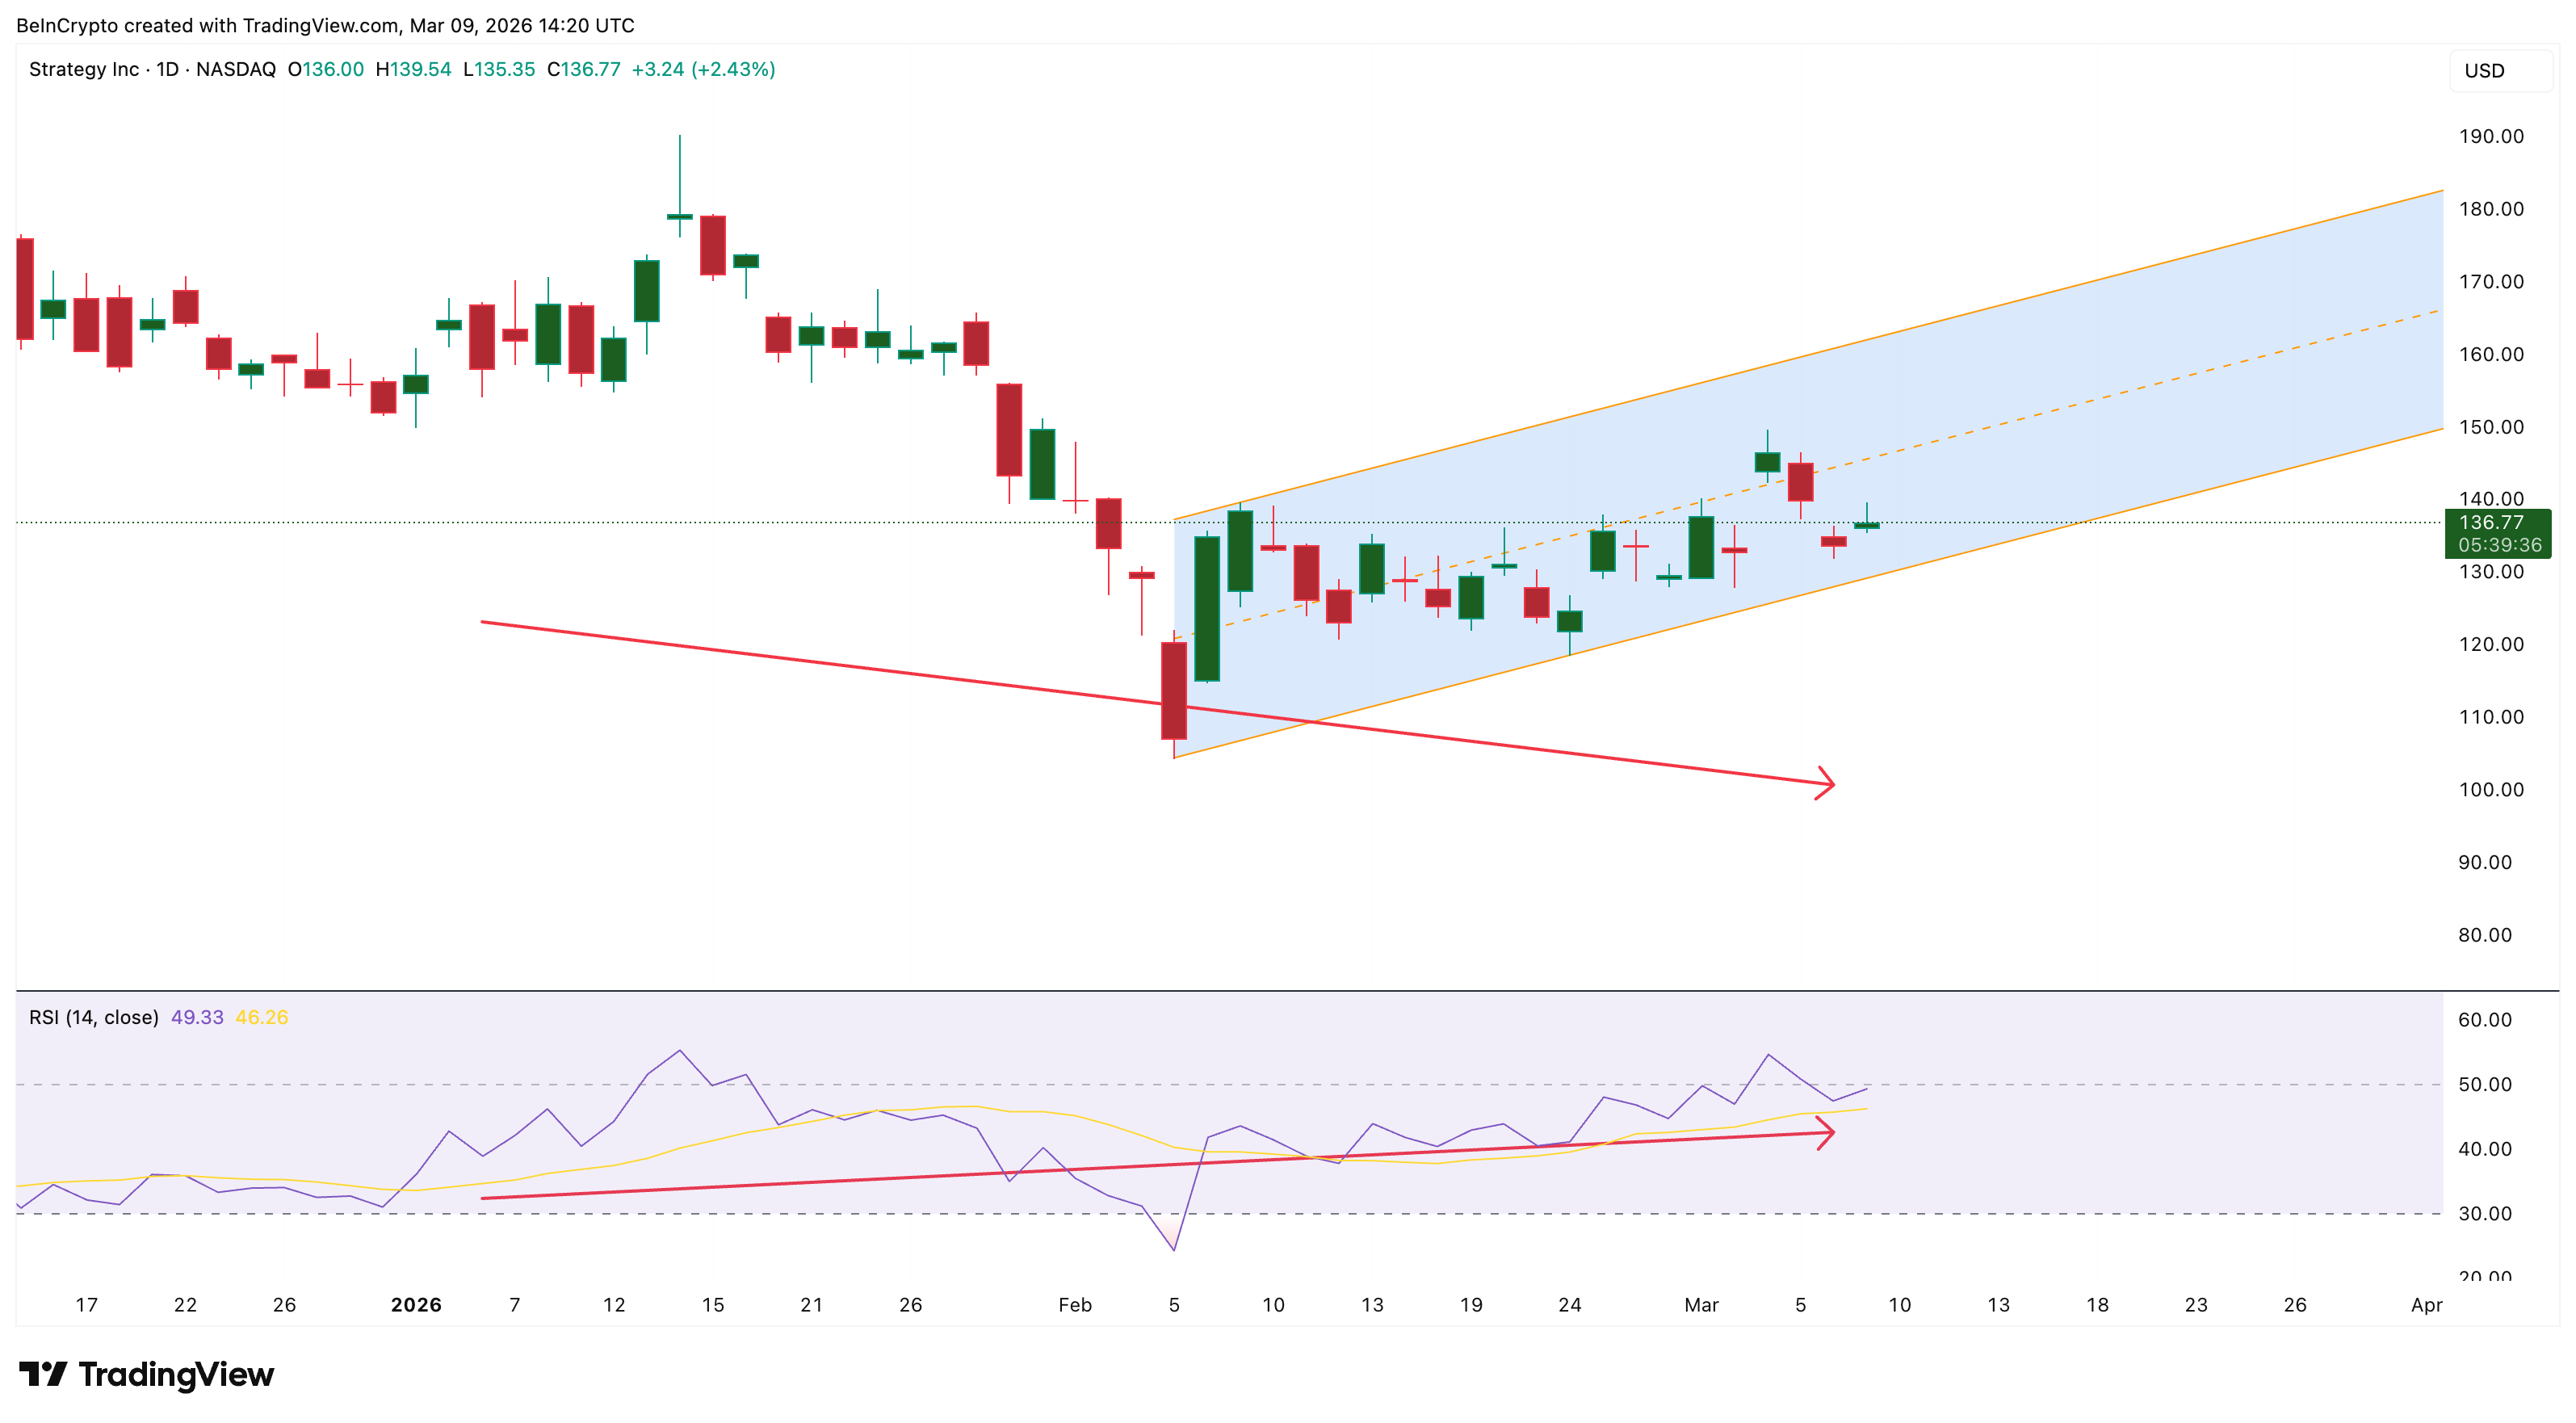
The rising channel from February 5 remains intact. Using Fibonacci levels drawn from that channel’s base, the MSTR price is currently sitting near the 0.5 level at $136. The next resistance is the 0.618 Fib at $140, just about 3% above the current price.
A daily close above $140 would confirm a breakout from the upper half of the consolidation range and open targets at the 1.0 Fib ($154) and the 1.618 extension at $176. That $176 level represents roughly a 29% move from here.
Given the 3x upside beta during this channel, Bitcoin would only need to bounce about 10% to fuel a rally of that magnitude in MicroStrategy shares.
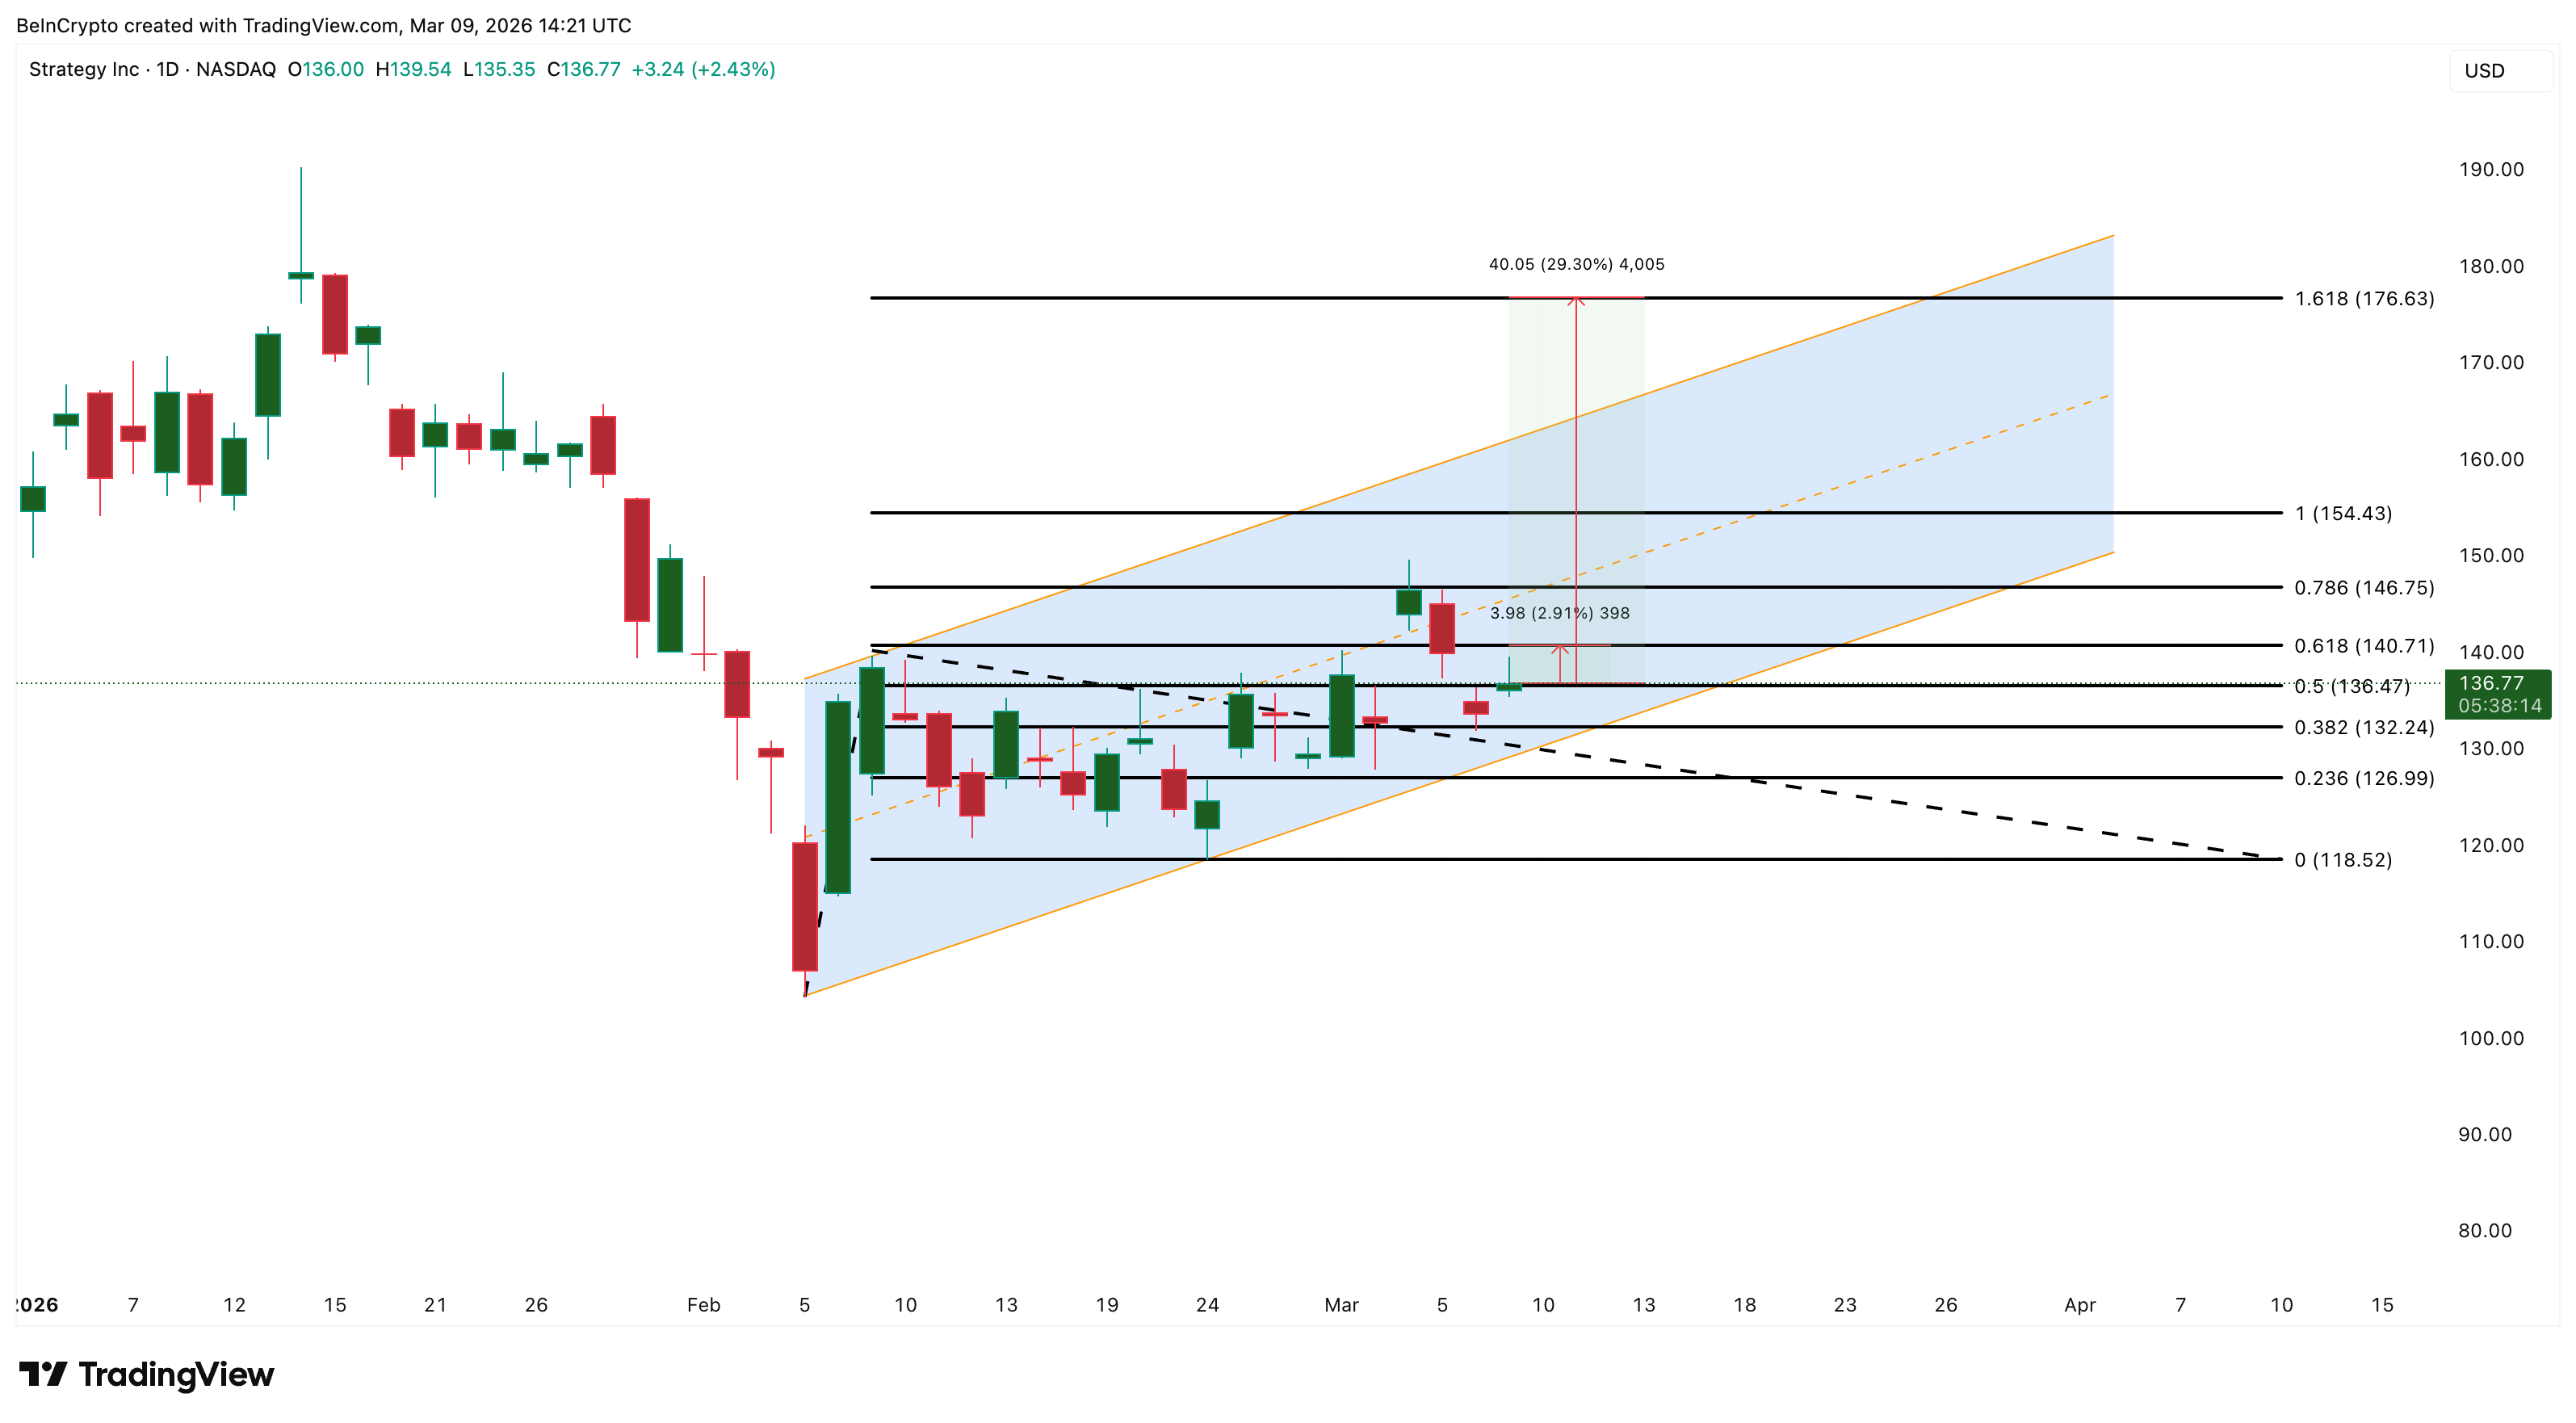
On the other side, a drop below $136 would put pressure on the current setup. If MSTR breaks the $132 level (the 0.382 Fib), the bullish divergence from March 6 will weaken considerably. That opens the door to a slide toward $126 (the 0.236 Fib) and potentially the channel floor near $118.
However, based on the 2026 beta profile, MSTR’s downside ratio has compressed to roughly 0.4x, absorbing less than half of Bitcoin’s drop.
And even if Bitcoin corrects further, a deeper decline would only push the mNAV back below 1.0x, reopening the same discount window that drew institutional capital in late 2025. For MicroStrategy shareholders, the math works both ways
Disclaimer: The content presented above, whether from a third party or not, is considered as general advice only. CFD trading involves significant risk of loss. Past performance does not guarantee future results. This article serves informational purposes only and does not constitute financial advice. Consider your risk tolerance before trading.


