


Top 3 Price Prediction: Bitcoin, Ethereum, Ripple – BTC and ETH rebounds from key support, XRP continues to weaken
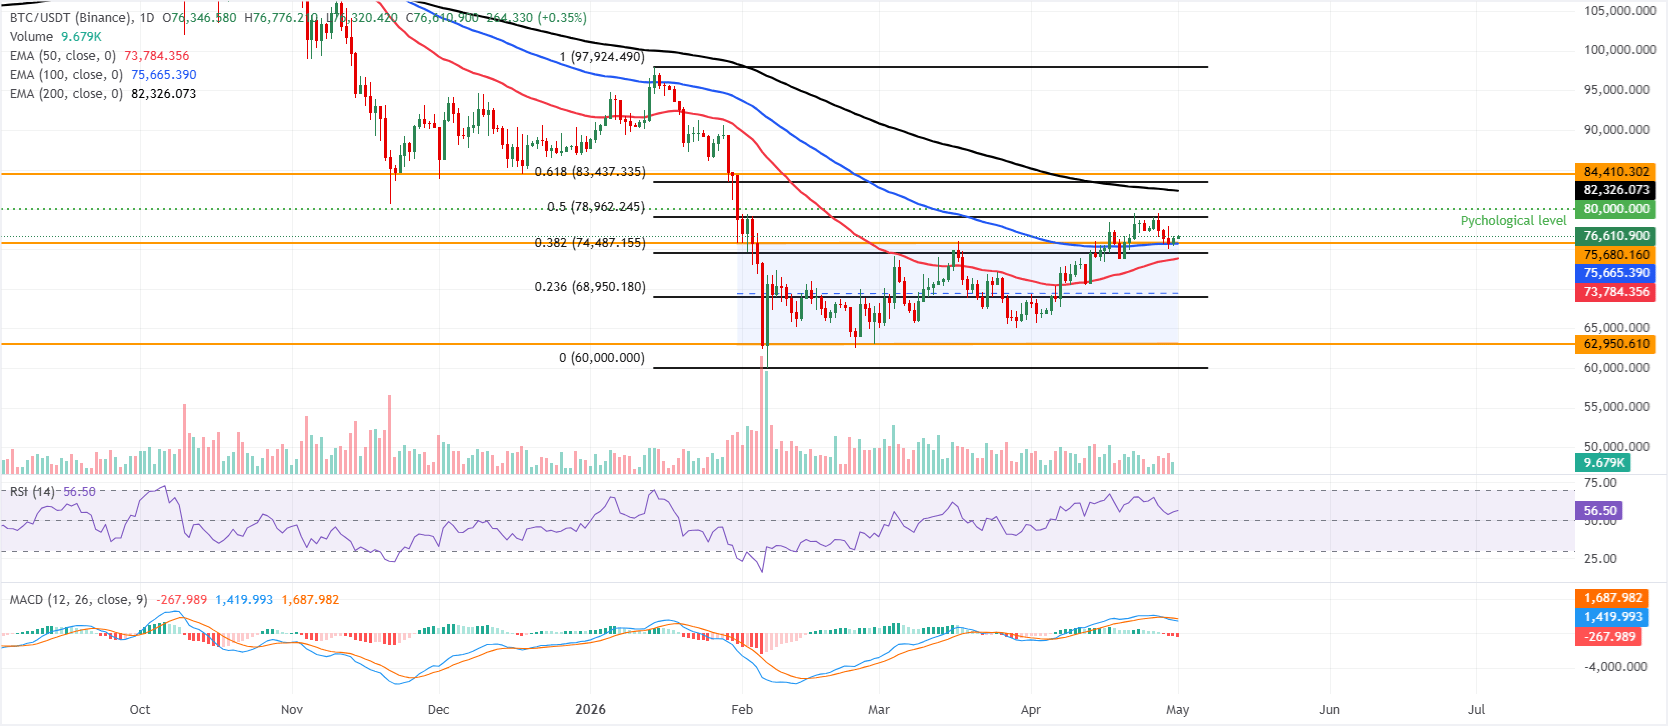
- Bitcoin rebounds, trading above $76,000 on Friday after finding support around the key level the previous day.
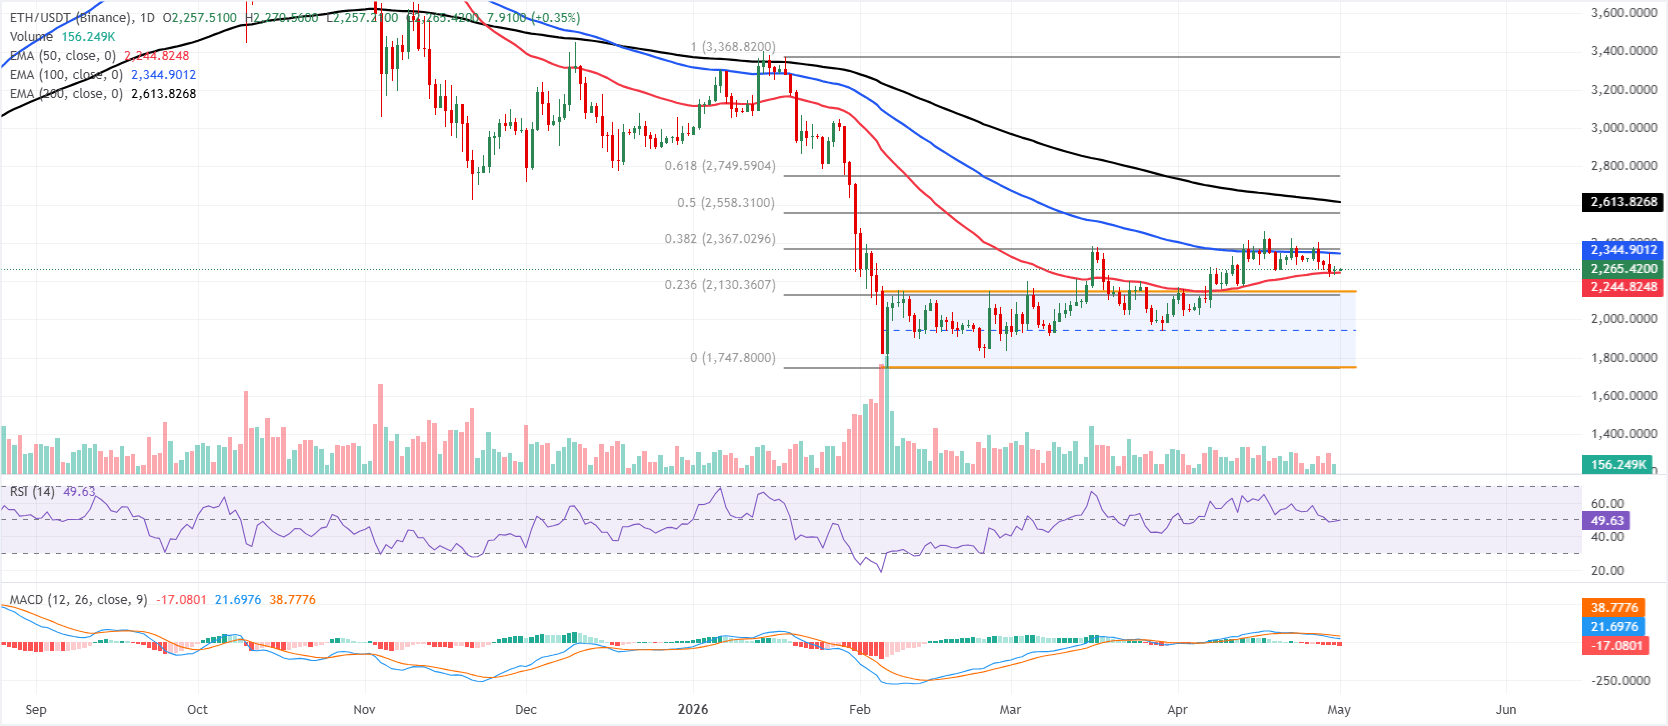
- Ethereum holds above the 50-day EMA at $2,244, hinting at a recovery ahead.
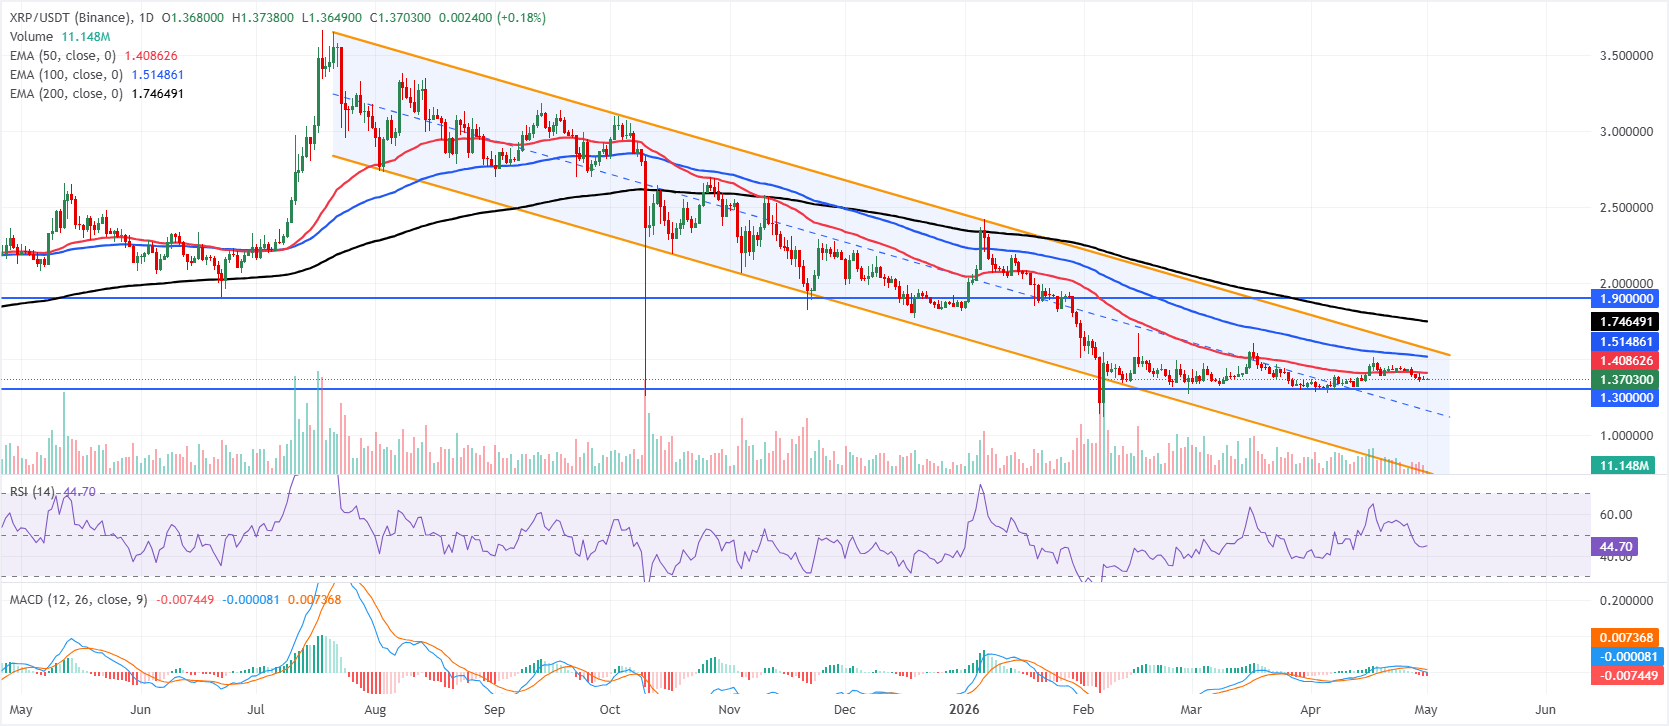
- XRP extends correction after closing below its key 50-day EMA at $1.41 earlier this week.
Bitcoin (BTC) and Ethereum (ETH) are showing signs of recovery on Friday after bouncing from key support levels the previous day. Meanwhile, Ripple (XRP) remains under pressure after closing below its critical support zone. The price action of these top three cryptocurrencies suggests a cautious tone, with traders assessing whether the BTC and ETH rebounds can sustain while XRP continues to lag.
Bitcoin rebounds slightly from key support
Bitcoin price is trading at $76,600 on Friday after rebounding slightly from the key support zone the previous day.BTC is holding a bullish near-term bias as price sits above the 50-day and 100-day Exponential Moving Averages (EMAs) clustered just under $75,700 and within the former channel top now acting as immediate support around $75,680.
The Relative Strength Index (RSI) on the daily near 56 hints at constructive but not overextended momentum, while the negative Moving Average Convergence Divergence (MACD) below the zero line suggests upside is advancing against a still-soft broader momentum backdrop.
On the downside, initial support is seen at the former channel ceiling near $75,680 and the 100-day EMA at $75,665, with the 38.2% Fibonacci retracement (drawn from January high to February low) at $74,487 and the 50-day EMA around $73,783 reinforcing a deeper demand zone.
On the topside, the 50% retracement at $78,962 is the first notable resistance, ahead of the psychological $80,000 barrier, while the 200-day EMA near $82,326 and the 61.8% retracement around $83,437 converge below the horizontal cap at $84,410 to form a broader supply band that could limit the next leg higher.
Ethereum’s 50-day EMA holds strong
Ethereum price is trading at $2,265 on Friday, holding just above the 50-day EMA at $2,244 but still capped well below the 100-day EMA at $2,344 and the 38.2% Fibonacci retracement at $2,367. This configuration suggests a neutral to slightly capped tone within the broader upward parallel channel, as price trades above the former channel top at $2,148, yet lacks the strength to challenge the higher retracement band.
Momentum is mixed, with the RSI on the daily chart hovering near a neutral 50 at 49, while the MACD remains negative, hinting at waning upside pressure despite holding over the short-term EMA support.
On the downside, initial support is seen at the 50-day EMA near $2,244, with additional protection from the prior channel ceiling at $2,148 and the 23.6% Fibonacci retracement at $2,130; a break beneath this cluster would expose the channel base near $1,747.
On the topside, bulls face their first significant hurdle at the 100-day EMA at $2,344, followed by the 38.2% retracement at $2,367; a sustained move above these barriers would open the way toward the 50% retracement at $2,558 and then the 200-day EMA at $2,613, with the 61.8% level at $2,749 marking a more distant objective.
XRP price action shows weakness
XRP is trading at $1.37 on Friday, maintaining a bearish near-term bias as it holds within a broader downward parallel channel and remains below all key EMAs. The 50-day EMA at $1.40 is the nearest capping level overhead, with the 100-day EMA at $1.51 and the channel’s upper boundary near $1.56 reinforcing a layered topside barrier.
Momentum is lackluster, as the RSI on the daily chart at 44 remains below the neutral 50 line, while the MACD indicator has slipped further into negative territory, suggesting rallies are likely to remain vulnerable while price trades below these averages.
On the downside, initial demand is seen at the horizontal support zone around $1.30, where buyers previously defended the lower end of the recent range, ahead of the channel’s distant lower boundary near $0.75 if selling pressure accelerates.
On the topside, a daily close above the 50-day EMA at $1.40 would be the first step toward easing immediate downside pressure, with further resistance emerging at the 100-day EMA around $1.51 and then at the channel top near $1.56; only a sustained break beyond these levels would start to challenge the broader bearish structure, ahead of the more distant horizontal resistance at $1.90.
(The technical analysis of this story was written with the help of an AI tool.)
Cryptocurrency prices FAQs
Token launches influence demand and adoption among market participants. Listings on crypto exchanges deepen the liquidity for an asset and add new participants to an asset’s network. This is typically bullish for a digital asset.
A hack is an event in which an attacker captures a large volume of the asset from a DeFi bridge or hot wallet of an exchange or any other crypto platform via exploits, bugs or other methods. The exploiter then transfers these tokens out of the exchange platforms to ultimately sell or swap the assets for other cryptocurrencies or stablecoins. Such events often involve an en masse panic triggering a sell-off in the affected assets.
Macroeconomic events like the US Federal Reserve’s decision on interest rates influence crypto assets mainly through the direct impact they have on the US Dollar. An increase in interest rate typically negatively influences Bitcoin and altcoin prices, and vice versa. If the US Dollar index declines, risk assets and associated leverage for trading gets cheaper, in turn driving crypto prices higher.
Halvings are typically considered bullish events as they slash the block reward in half for miners, constricting the supply of the asset. At consistent demand if the supply reduces, the asset’s price climbs.
Recommended Articles


