


A 43% Projection Is Calling the Gold vs Silver Winner as Oil Cools

The gold vs silver divergence has widened sharply this month. Silver (XAG/USD) is up 15.47% against gold’s (XAU/USD) 6% gain as Brent crude slides below $99 on continuing de-escalation talks.
The gap is not random. Proprietary indicators, options flows, and chart structure all lean the same way, though one structural force still defends gold’s downside.
Three Forces Are Separating Gold from Silver
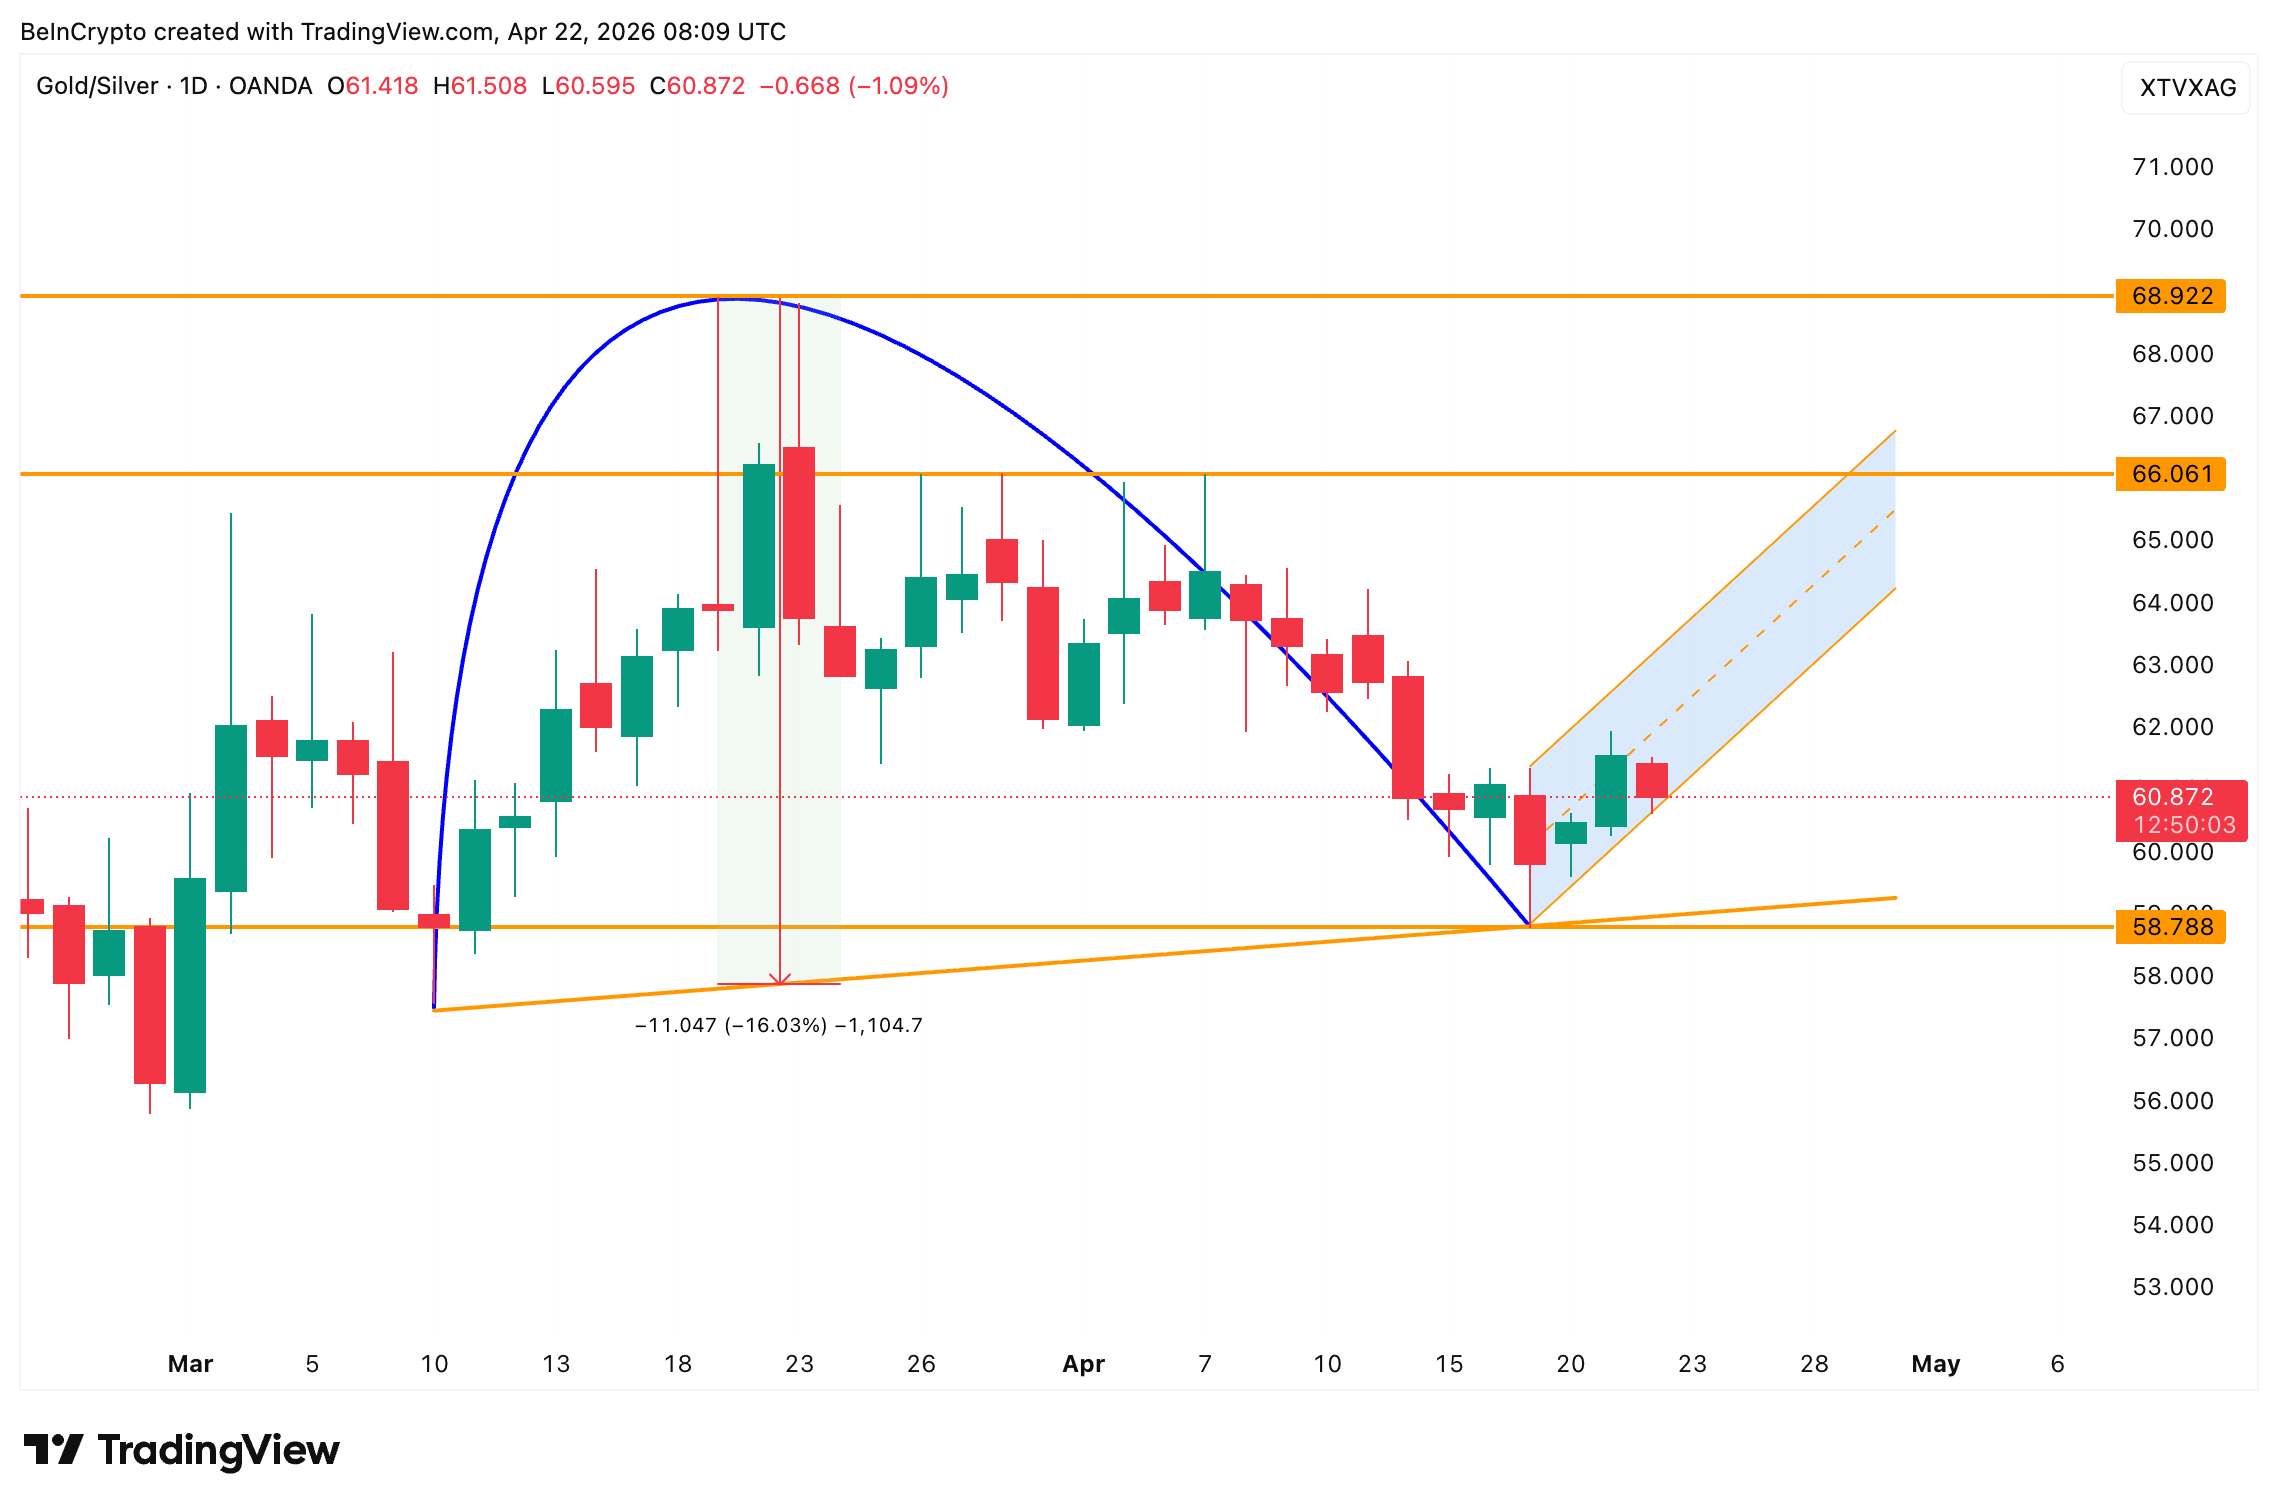
The gold-silver ratio has formed an inverted cup and handle since late March. The ratio now presses against the handle’s lower trendline. A clean breakdown would extend silver’s lead, while a reclaim of the pattern’s upper bound would neutralize the silver-friendly setup.
Its handle low sits near 58, and a break below that level targets a further 16% compression, meaning silver extends the lead. A reclaim of 68 flips it back toward gold.
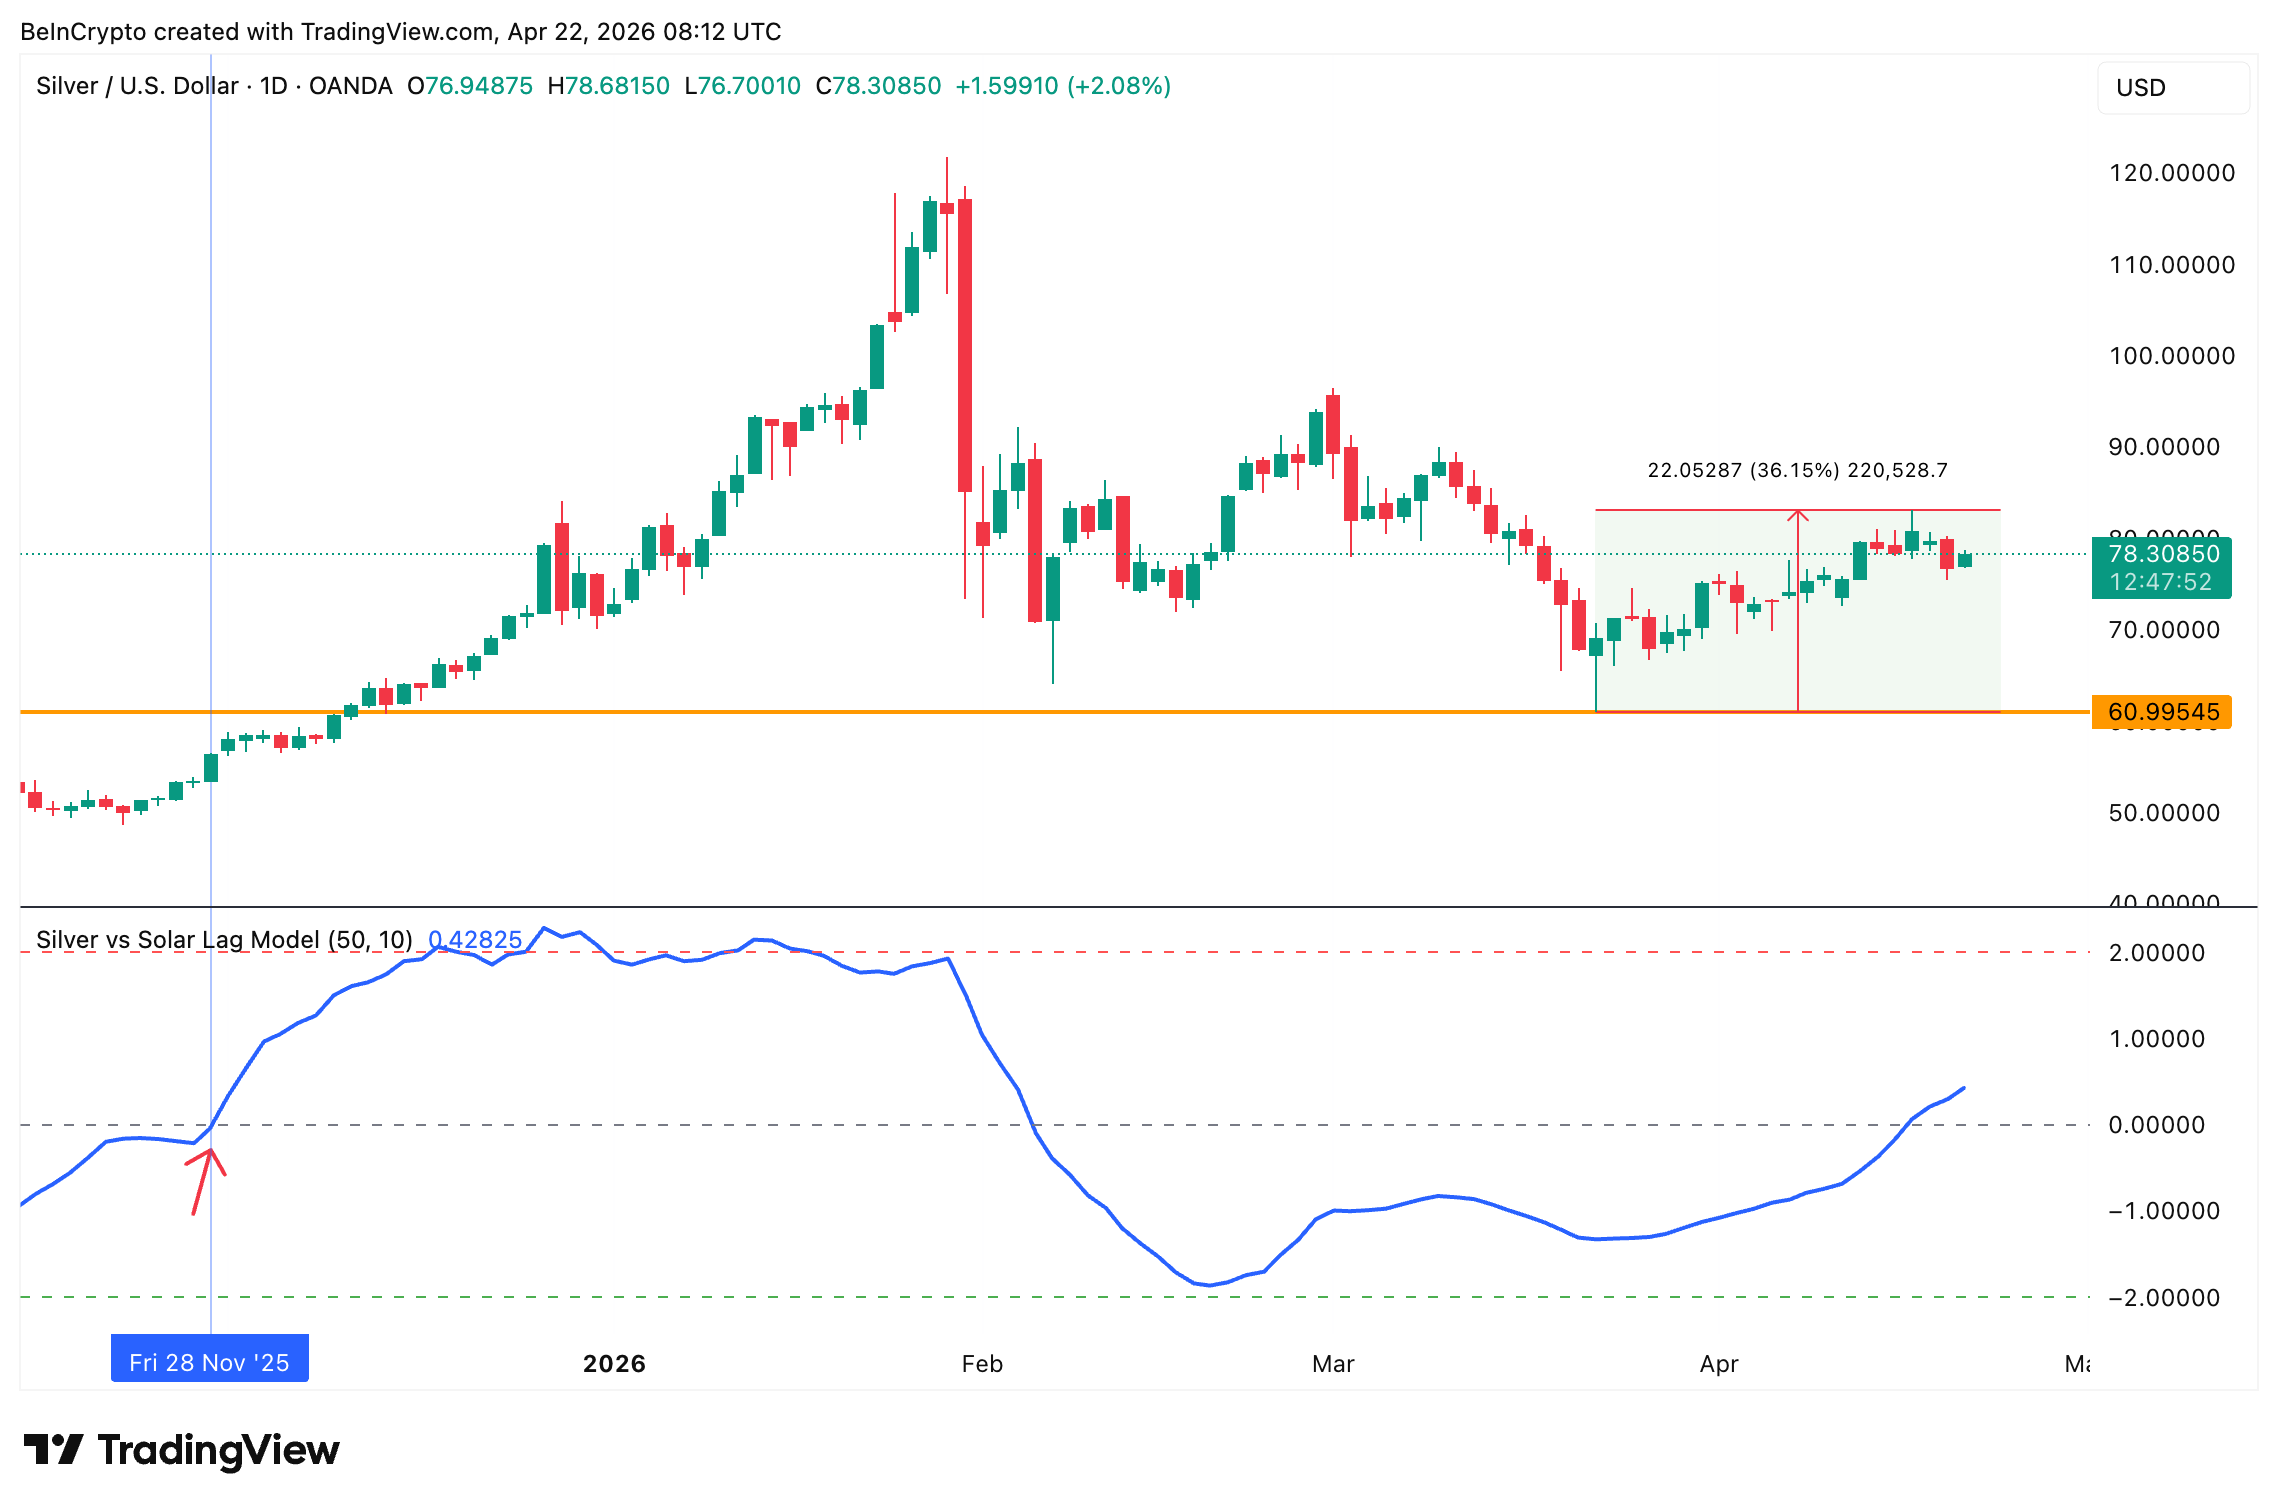
Silver’s Solar Lag Model, which tracks silver against solar-demand-driven industrial flows with a 10-day lag, has crossed above zero for the first time since late 2025. The November 28 cross preceded silver’s multi-week rally.
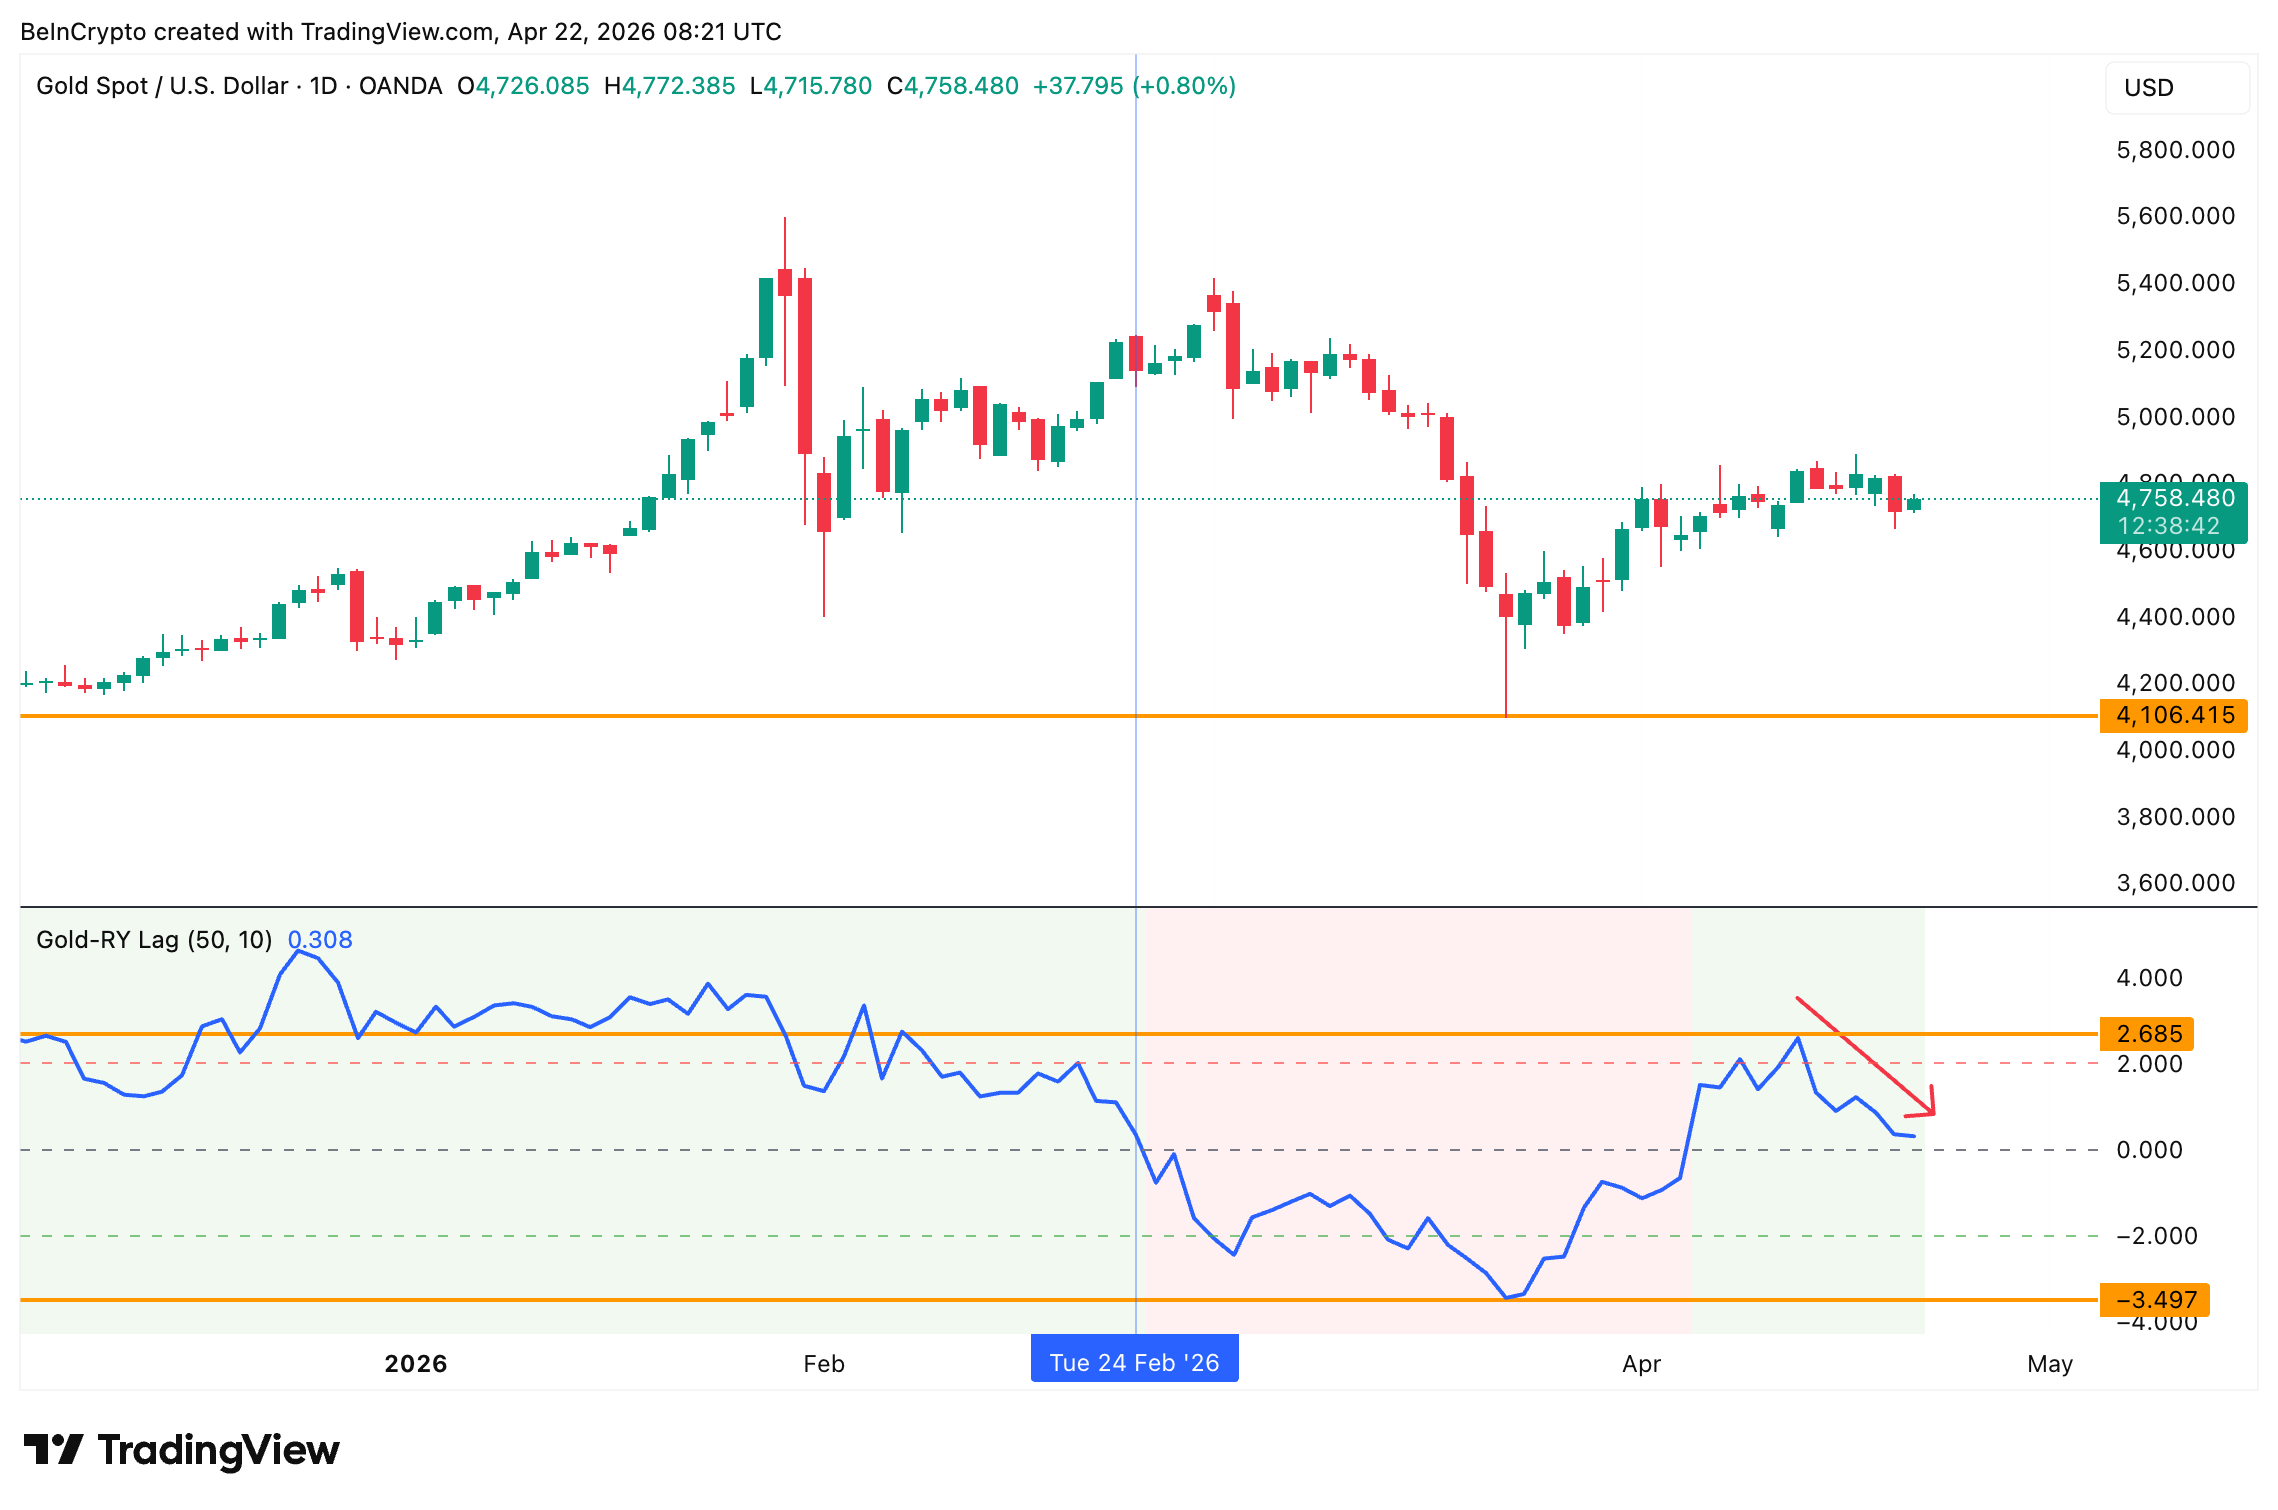
Gold’s Real Yields Lag Model, BeInCrypto’s proprietary indicator, which measures gold’s path against 10-year real yields, is rolling the other way. It peaked at 2.685 earlier this month and now reads 0.308. Its slope mirrors the February rollover that broke below zero and bottomed at -3.497 during gold’s correction.
One structural force still defends gold. Central banks now hold roughly 38,666 tons, about 17% of all gold ever mined, according to data cited by The Kobeissi Letter. Even if gold loses the relative race to silver, its downside is cushioned by a buyer base that does not respond to short-term macro rotations.
Taken together, the ratio is compressing in silver’s favor, silver’s industrial lag model is climbing, and gold’s monetary premium is fading, while central bank demand keeps gold’s floor intact rather than lifting it higher. The scoreboard reads three forces for silver, one defensive line for gold.
Positioning data shows whether options traders are reading the divergence the same way.
Options Traders Stack Long on One, Stay Balanced on the Other
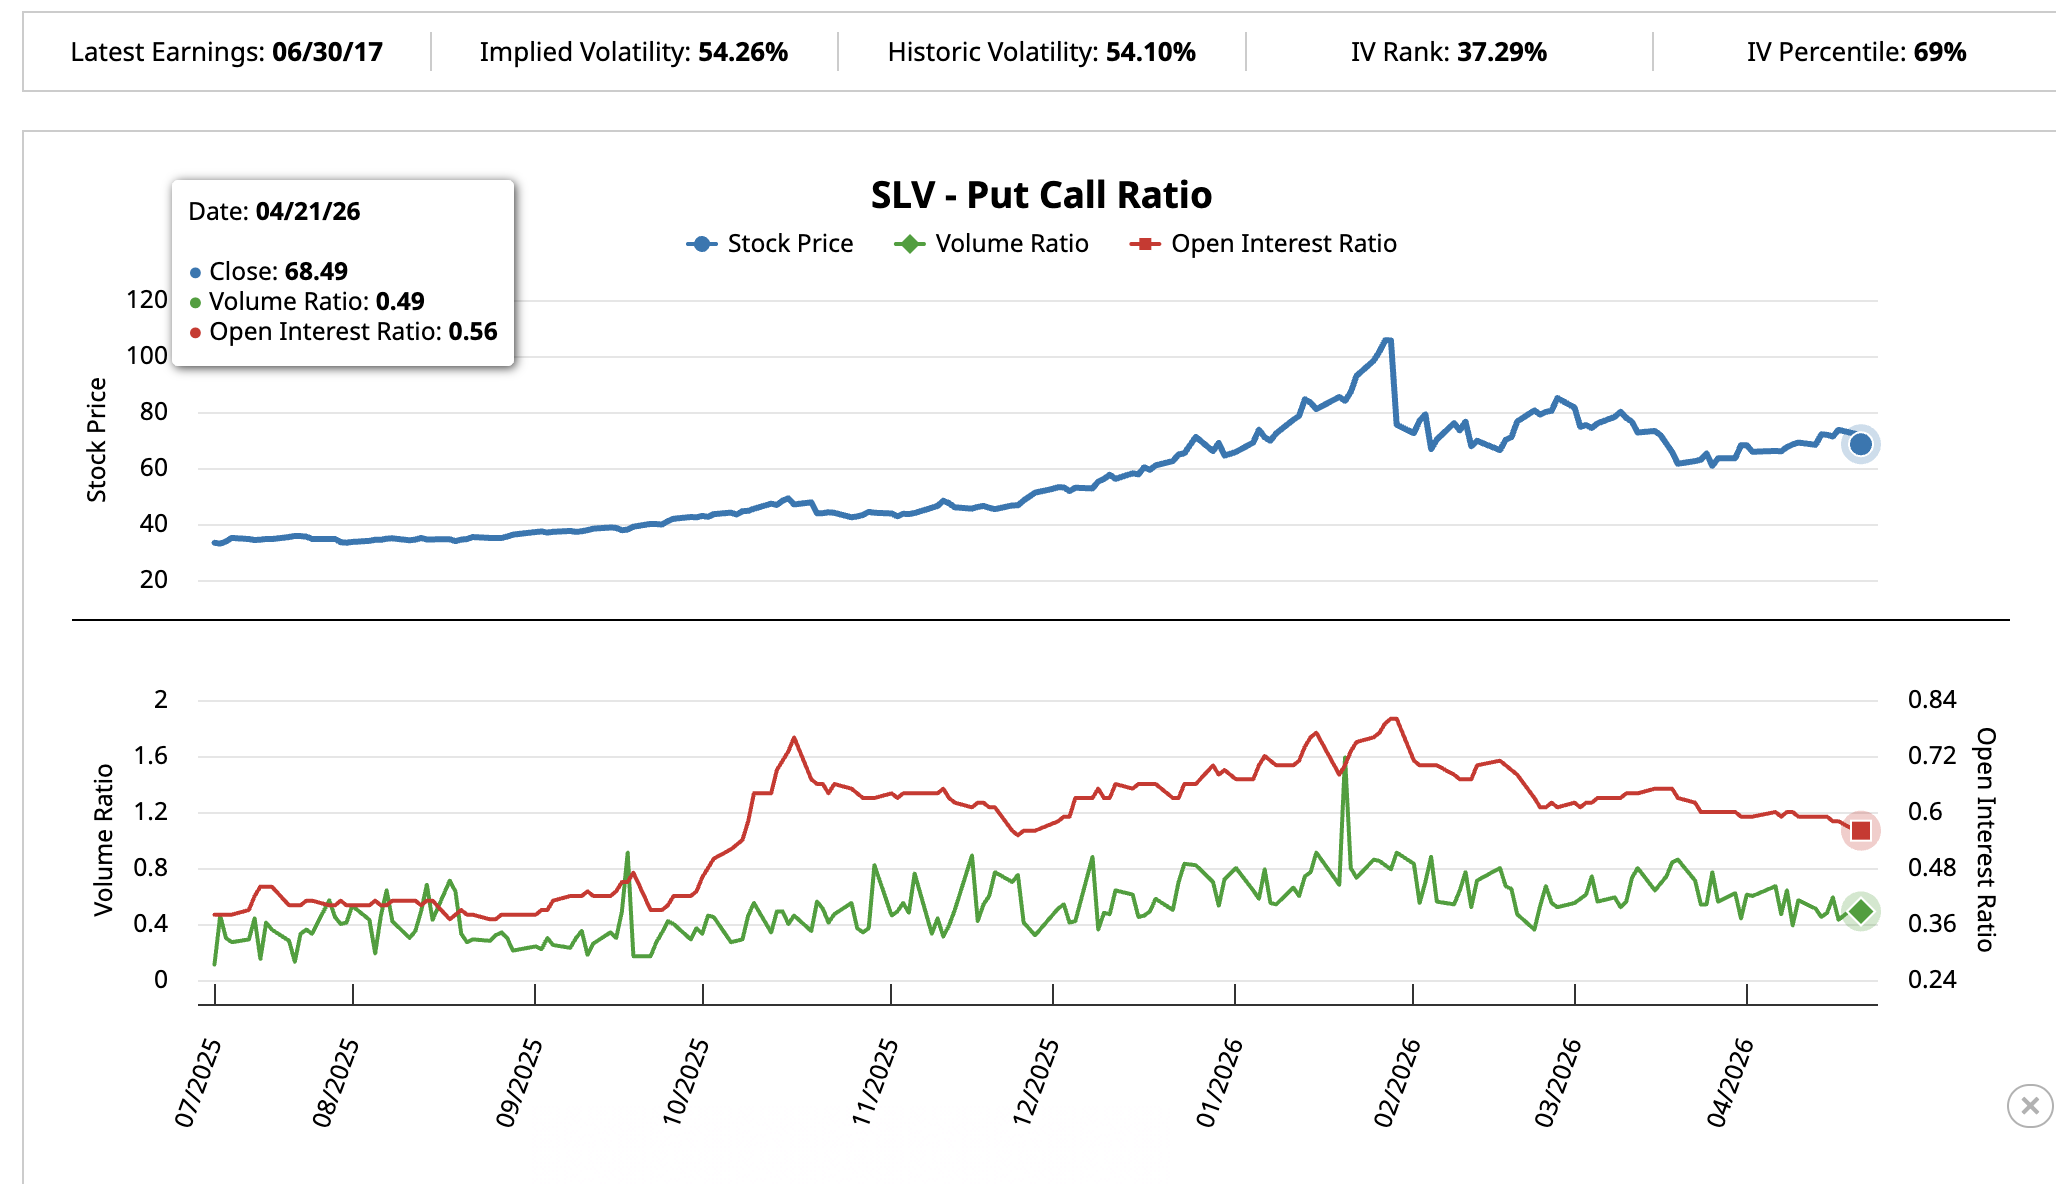
Options activity on the iShares Silver Trust (SLV ETF), the largest silver-backed fund and the main proxy traders use to position on silver without touching futures, has turned sharply bullish since late March.
The put-call volume ratio, where a reading below one means calls outnumber puts, has dropped from 0.77 on March 26 to 0.49 on April 21. The open interest ratio has fallen from 0.60 to 0.56 over the same window. Call activity is outpacing put activity on both intraday and structural horizons.
SLV implied volatility sits at 54.26% with an IV Percentile of 69%, meaning options are pricing expected movement above most of the past year’s range. Traders are leaning long and paying up for the range.
Want more insights like this? Sign up for Editor Harsh Notariya’s Daily Newsletter here.
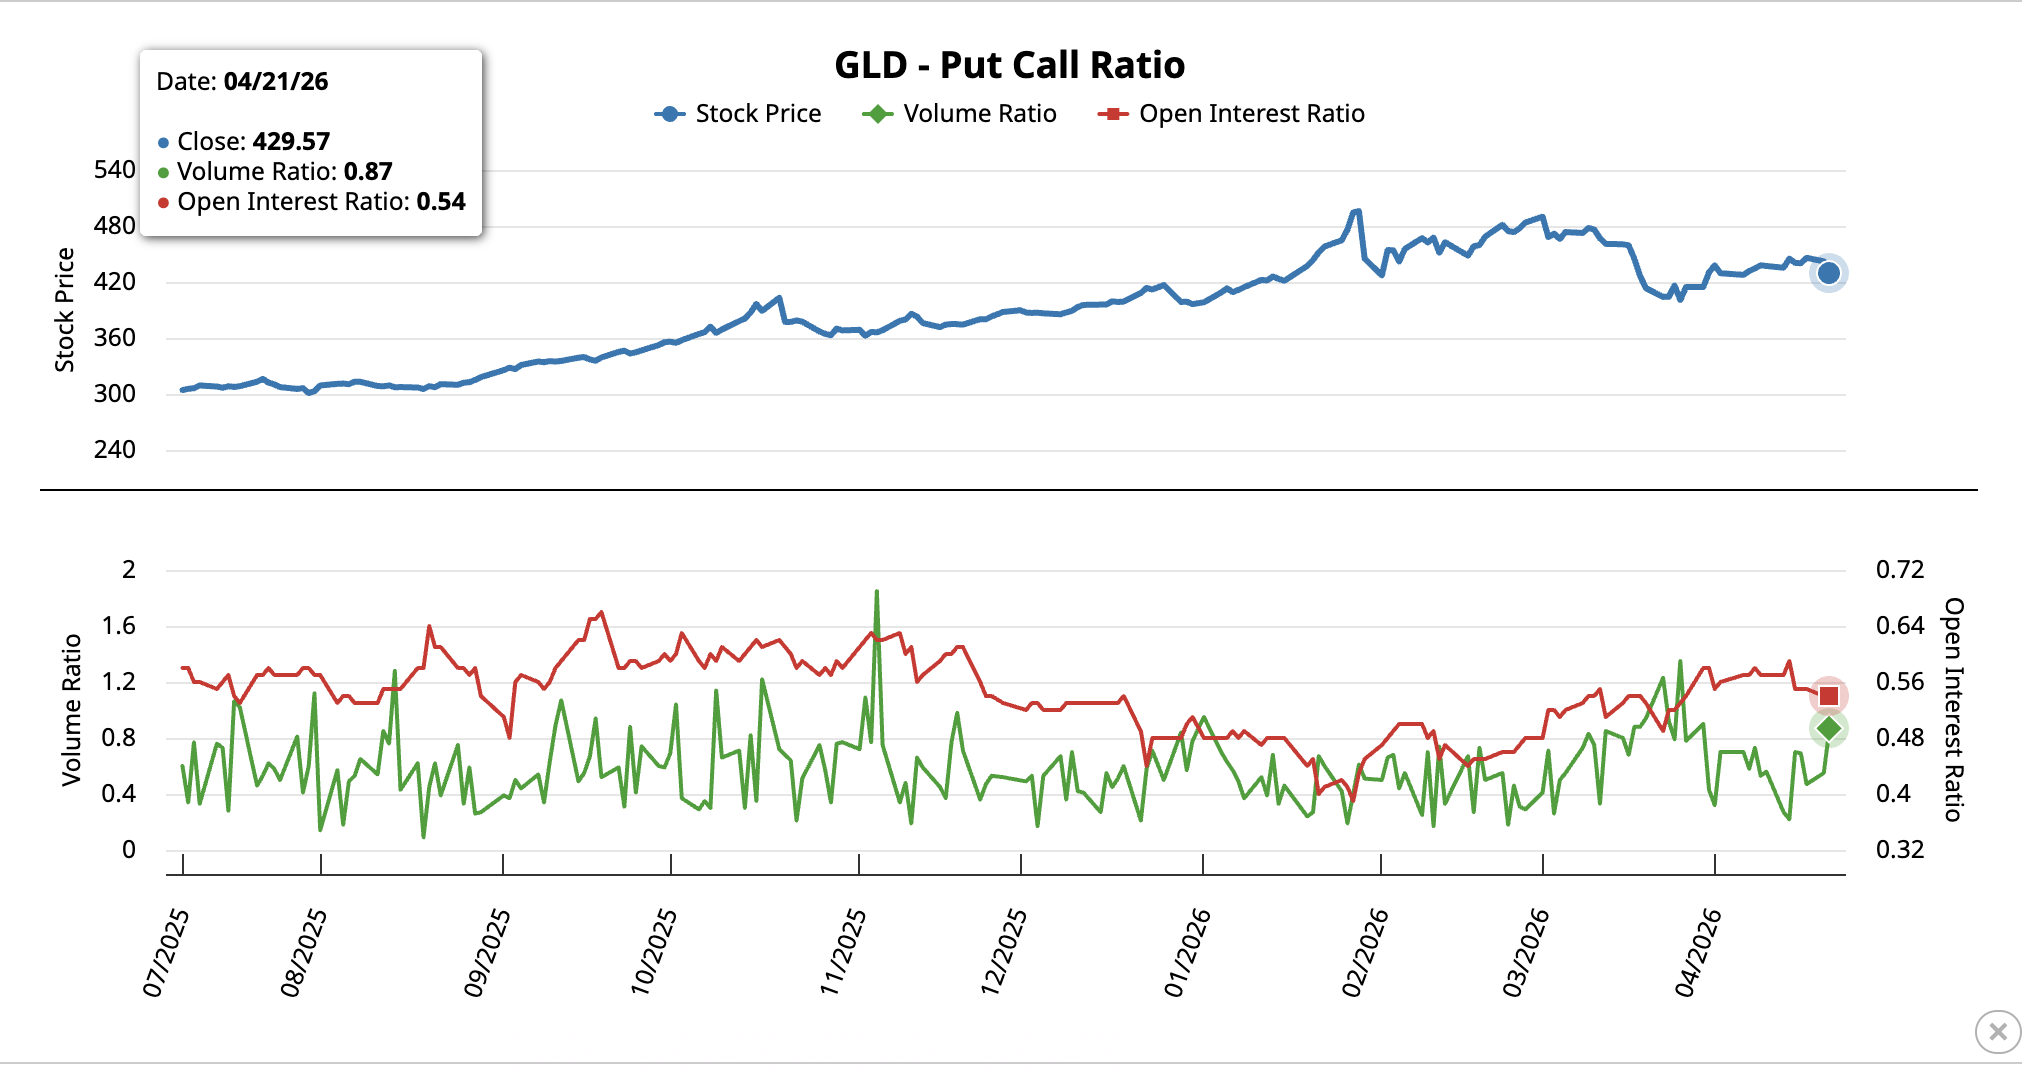
Positioning on the SPDR Gold Shares (GLD ETF), the equivalent physical-backed vehicle for gold exposure, looks different. The volume ratio has dropped from 1.35 on March 26 to 0.87, a shift from bearish to mildly bullish. The open interest ratio has barely moved from 0.53 to 0.54. Traders have stopped stacking downside protection on gold but have not rotated into aggressive call accumulation either.
With indicators and positioning pointing the same way, the charts become the decider.
The Gold vs Silver Verdict Rests on Two Inverse Setups
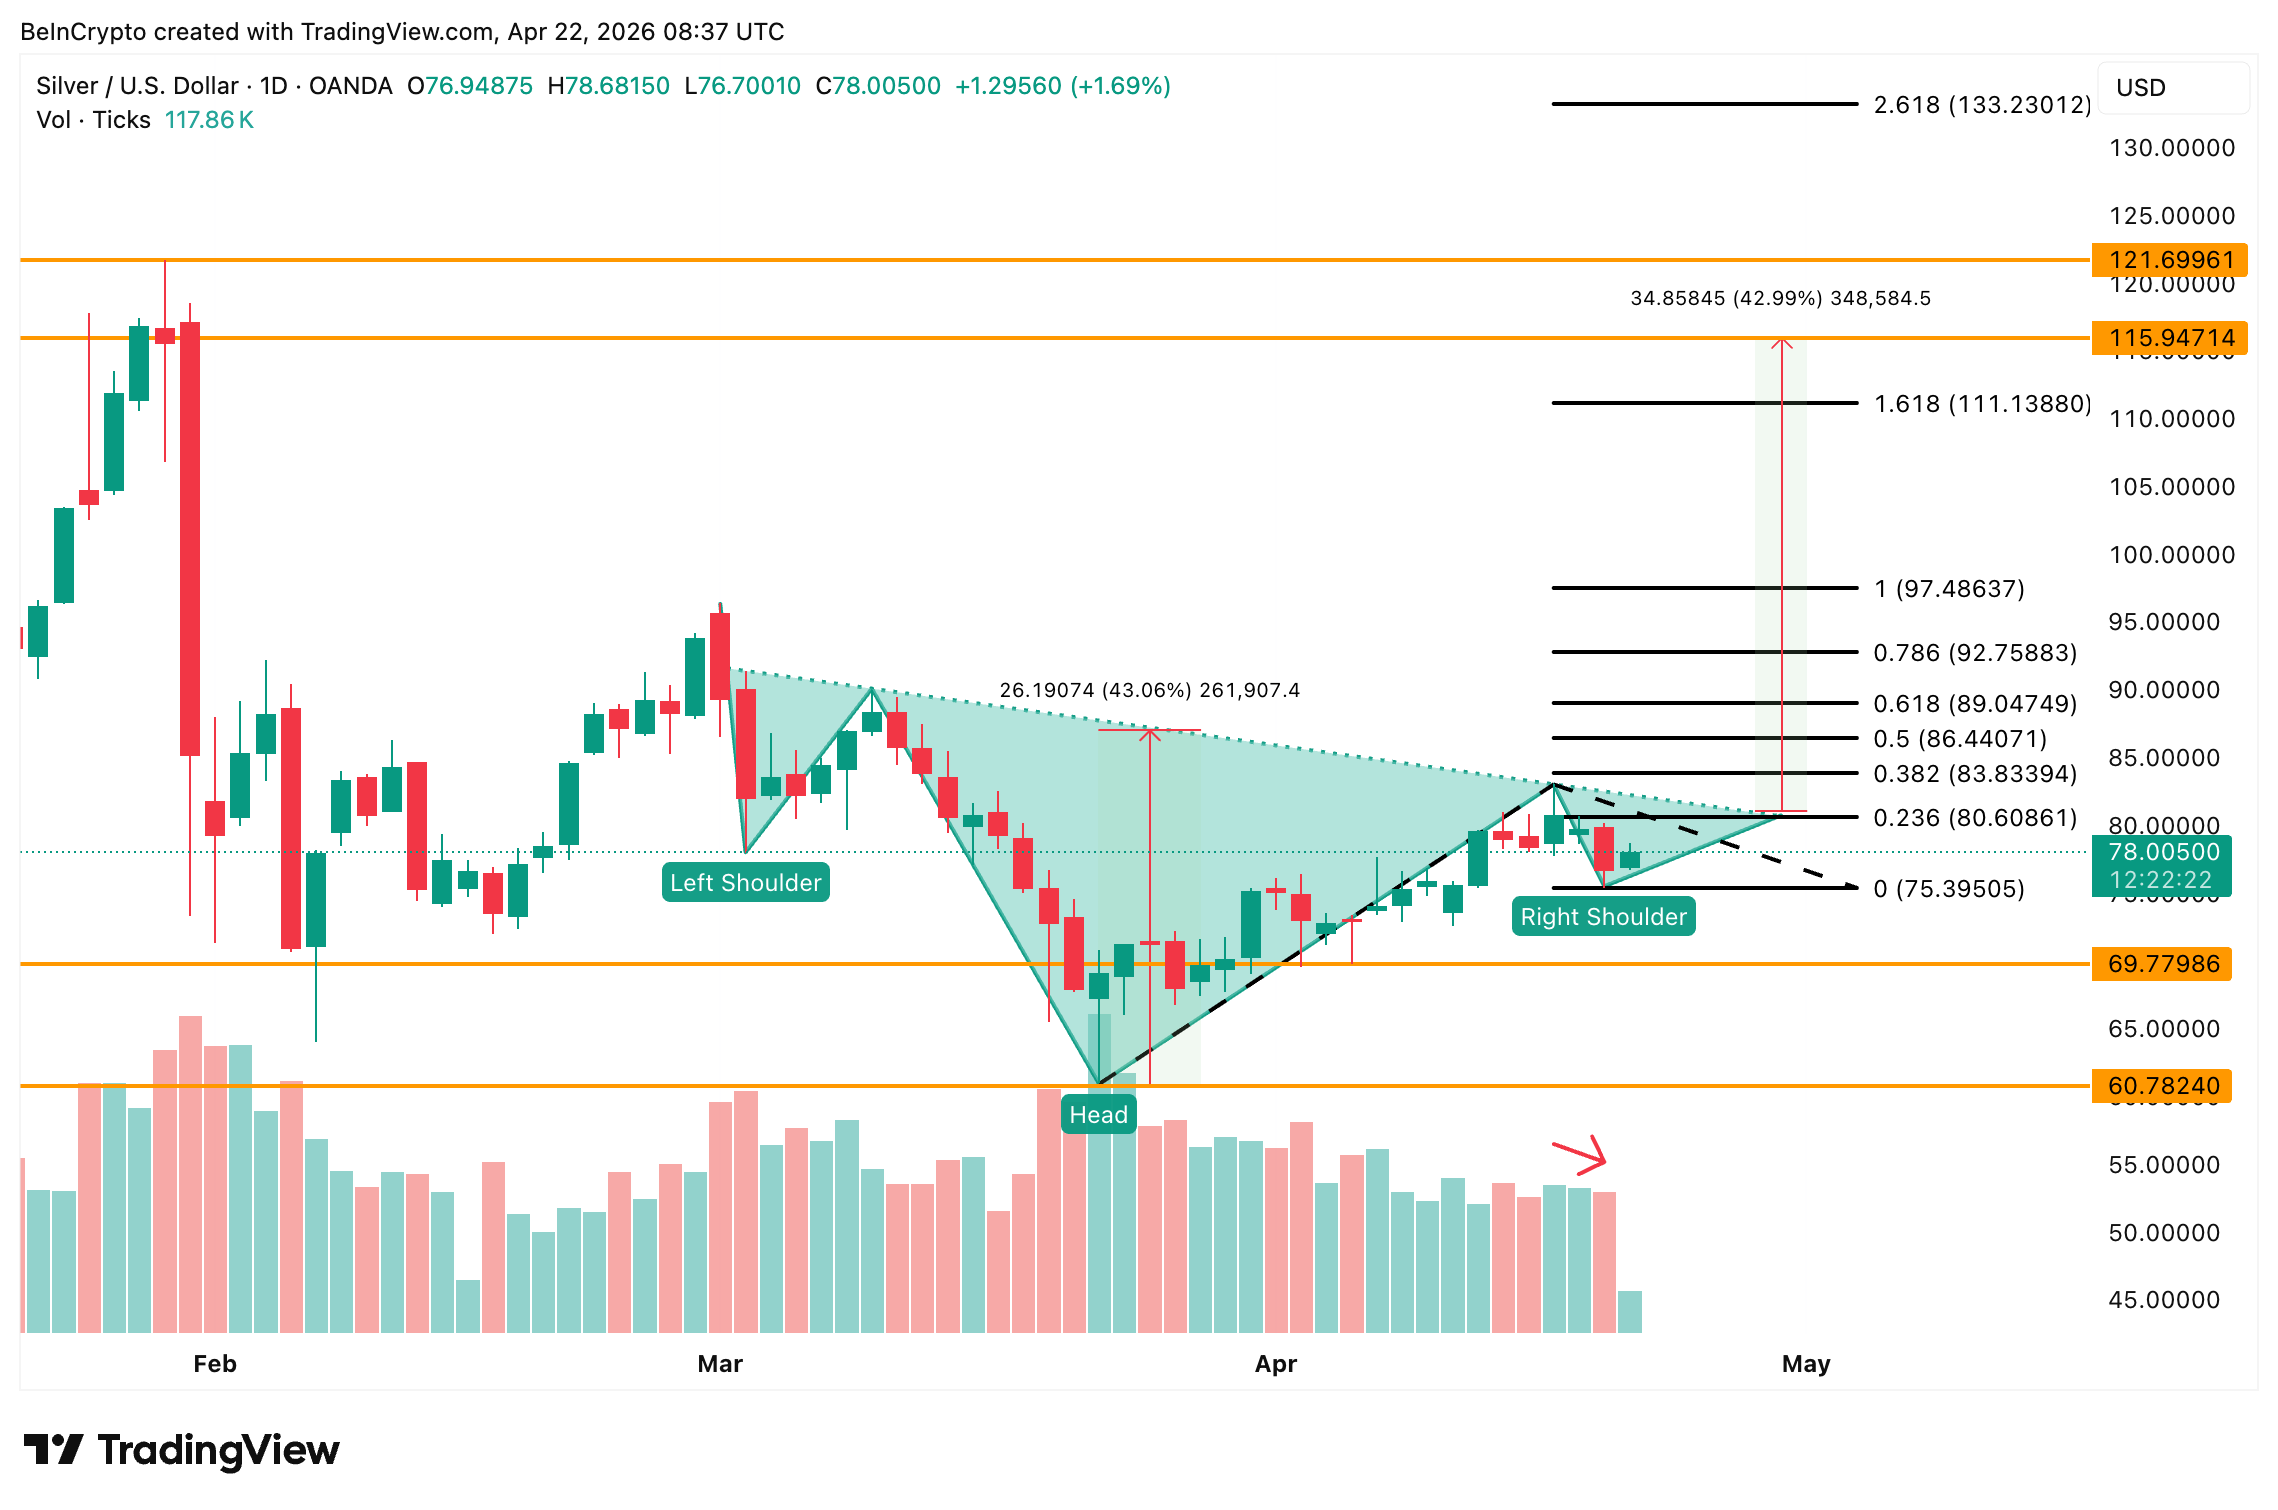
The silver price (XAG/USD) daily chart has been carving out an inverse head and shoulders, a bullish reversal shape made of three lows with the middle one being the deepest. The pattern’s head sits near $60, and the neckline runs close to $80. The right shoulder’s buying volume sits marginally above its matching selling volume, offering subtle confirmation of strength
A clean break above the $80 to $83 zone would activate a 43% projection toward roughly $115, pushing price near the $121 all-time high. The optimistic extension sits at $133 as a stretch target. A drop below $75 weakens the structure, a move under $69 risks invalidation, and a breach of $60 ends the bullish thesis.
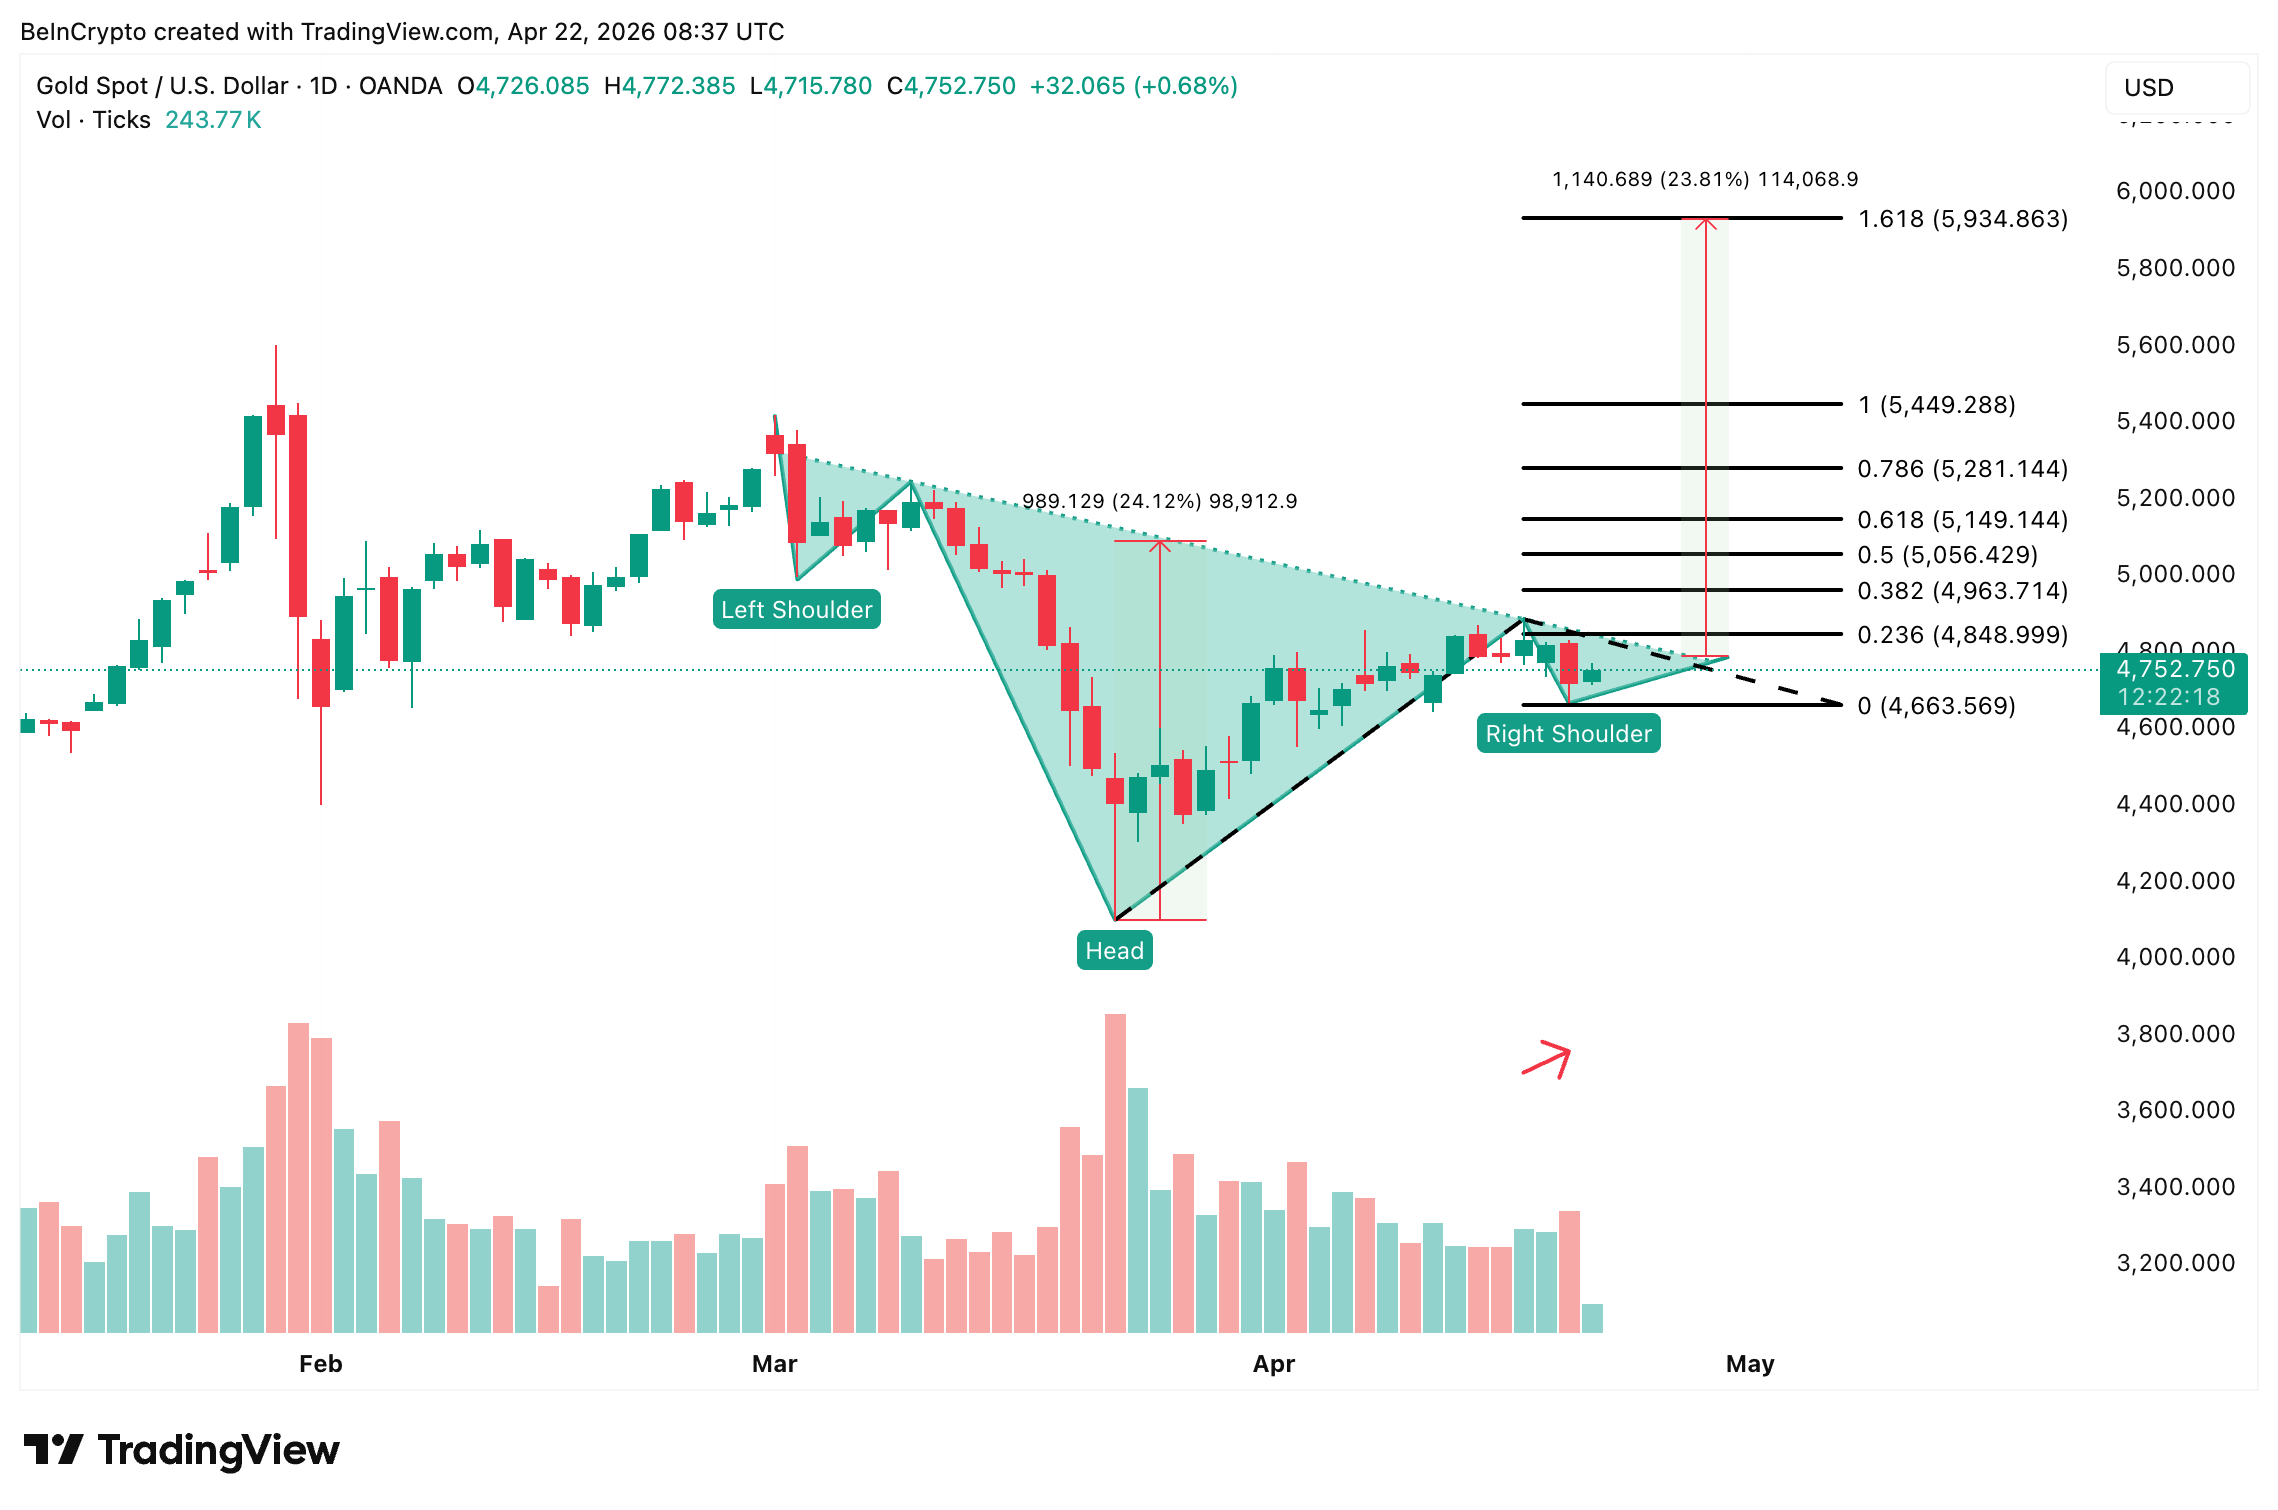
Gold price is building the same pattern but with weaker confirmation. The right shoulder’s selling volume pillar sits above the matching buy volume, the opposite of silver’s read, showing weaker strength. The neckline sits near $4,848, and a confirmed break above that level opens a 24% path to $5,934 from the neckline. That upside is roughly half of silver’s measured move.
The gold-silver ratio from earlier provides the deciding context as the pattern too favors silver for now.
In the gold vs silver race, silver holds the volume confirmation, the cleaner options flow, and the larger projection. However, gold’s safe haven floor rests on central bank demand. Silver’s break above $80 opens a path to $115 and extends the lead. But a rejection there and a loss of $75 could hand momentum back to gold.
 Don't Miss Today's Market Moves Start trading Forex, Gold & Crypto today Regulated platform | Fast withdrawals
* The content presented above, whether from a third party or not, is considered as general advice only. This article should not be construed as containing investment advice, investment recommendations, an offer of or solicitation for any transactions in financial instruments.


