




Silver/AUD (XAGAUD) Moved Sharply on Oct 30: Inventories, the Dollar, or Geopolitics?
Silver/AUD (XAGAUD) is down 2.07% at Oct 30 00:10(ET), now at $72.589, with a 7-day down of 5.19%.
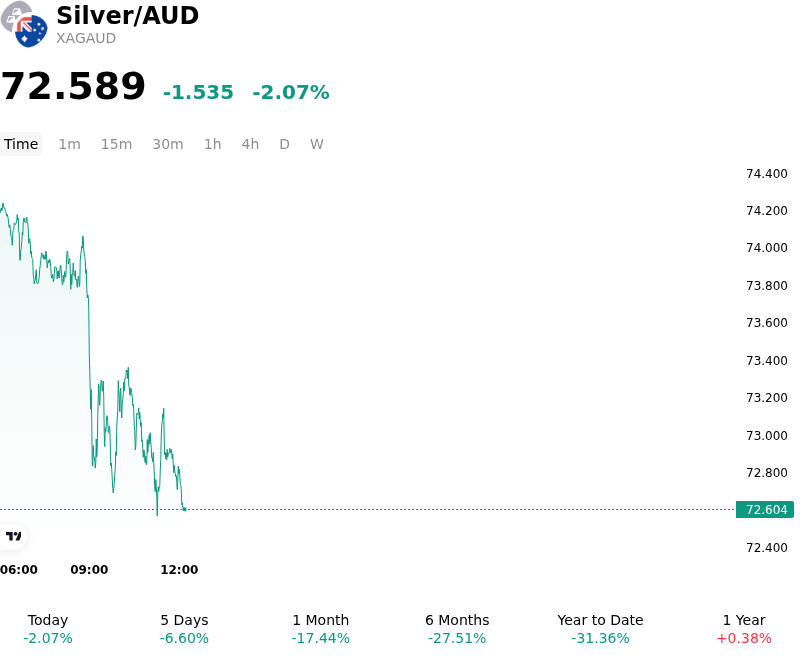
What is driving Silver/AUD (XAGAUD)’s stock price down today?
The decline in silver priced in Australian dollars was primarily driven by a convergence of hawkish central bank policy signals, elevated real bond yields, and currency-specific headwinds that favored the Australian currency over non-yielding precious metals. Global spot silver prices experienced renewed selling pressure following the Federal Reserve interest rate decision, where policy communications and hawkish internal dissents reinforced expectations of prolonged tight monetary conditions. Resilient inflation readings and persistent energy cost pressures further elevated Treasury yields, sharply increasing the opportunity cost of holding non-yielding bullion and prompting institutional liquidation of silver positions.
The weakness in silver was compounded when expressed in Australian dollar terms due to relative exchange rate dynamics. The Australian dollar received localized support from stronger-than-expected domestic inflation data, which bolstered expectations that the Reserve Bank of Australia may be forced to maintain a restrictive policy stance. This relative firmness in the Australian currency created a negative conversion drag for AUD-denominated silver, magnifying price drops for local investors relative to USD-denominated spot trades.
Beyond monetary policy factors, silver encountered distinct headwinds on the physical supply-demand front. Unlike gold, which retained selective safe-haven support, silver was heavily impacted by its dual role as an industrial metal. Market sentiment was dampened by indications of softening industrial fabrication demand, notably within solar panel manufacturing, where elevated material costs have encouraged industrial users to optimize processes and utilize alternative materials. This softer industrial outlook, alongside a widening gold-to-silver ratio and technical selling as key support levels gave way, catalyzed systematically lower institutional positioning.
Technical Analysis of Silver/AUD (XAGAUD)
Technically, Silver/AUD (XAGAUD) shows a MACD (12,26,9) value of -1.445, indicating a sell signal. The RSI at 26.483 suggests sell condition and the Williams %R at 99.318 suggests oversold condition. Please monitor closely.
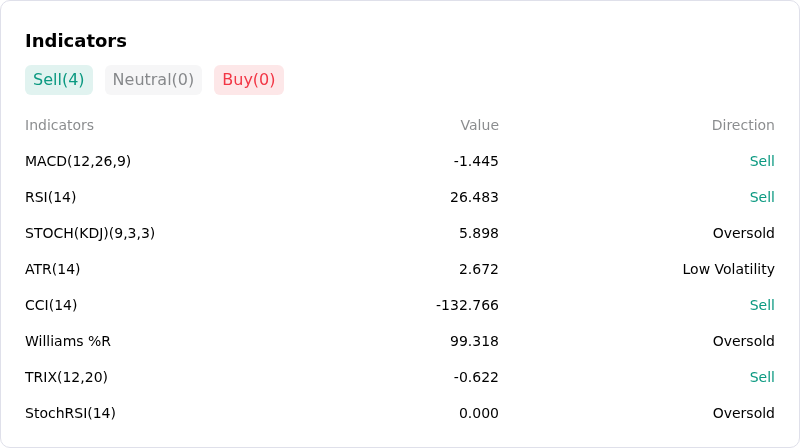
More details about Silver/AUD (XAGAUD)
Recent Events and Risks:
- Surging Physical Inventory and Easing Liquidity Constraints: Industry reports indicate London silver vault stockpiles have risen to 932 million ounces, with available non-ETF inventories nearly doubling from year-ago lows to 267 million ounces. The resolution of physical supply bottlenecks has removed prior squeeze premiums, driving aggressive spot selling and technical breakdowns toward 11-month lows.
- Persistent Yield Pressure and Hawkish Central Bank Expectations: Stronger economic growth data and elevated energy prices continue to keep government bond yields supported while reinforcing expectations of further monetary policy tightening. High real yields increase the opportunity cost of holding non-yielding bullion, dampening investor appetite and fueling capital outflows.
- Industrial Demand Deterioration and Photovoltaic Substitution: Industrial fabrication demand faces increasing pressure as solar panel manufacturers actively reduce silver loading per cell or substitute cheaper base metals like copper. Forecasts showing a contraction in annual industrial silver usage reflect slowing consumption in key green-technology and solar sectors.
- Margin-Driven Liquidations and Speculative Positioning Unwind: Intraday volatility and sharp selloffs in broader equity markets have triggered margin calls for leveraged market participants, forcing hedge funds to liquidate silver positions to raise liquidity. Concurrently, commodity trading advisors are actively trimming precious metals exposure, adding momentum to intraday downside pressure.
Recommended Articles


