


The Hidden On-Chain Signal That Shows Bitcoin Is Closer to a Bottom Than Most Think


Bitcoin is currently trading at one of the most pivotal levels of this cycle, caught between long-term on-chain support and a wall of overhead resistance created by millions of underwater short-term holders.
| Spot price $70,925 | Weekly change +2.74% | Weekly RSI (14) 33.59 | ATH drawdown -43% |
Using Glassnode’s latest on-chain indicators alongside weekly and daily technical charts, this analysis breaks down exactly where Bitcoin stands today and what needs to happen next. Two clear scenarios emerge.
How Bearish is Bitcoin Right Now? Four Cost-Basis Levels are Critical
Glassnode’s latest Risk Indicator chart overlays four key on-chain price models against the Bitcoin spot price. Together, these models reveal where the market stands relative to the cost basis of different investor cohorts.
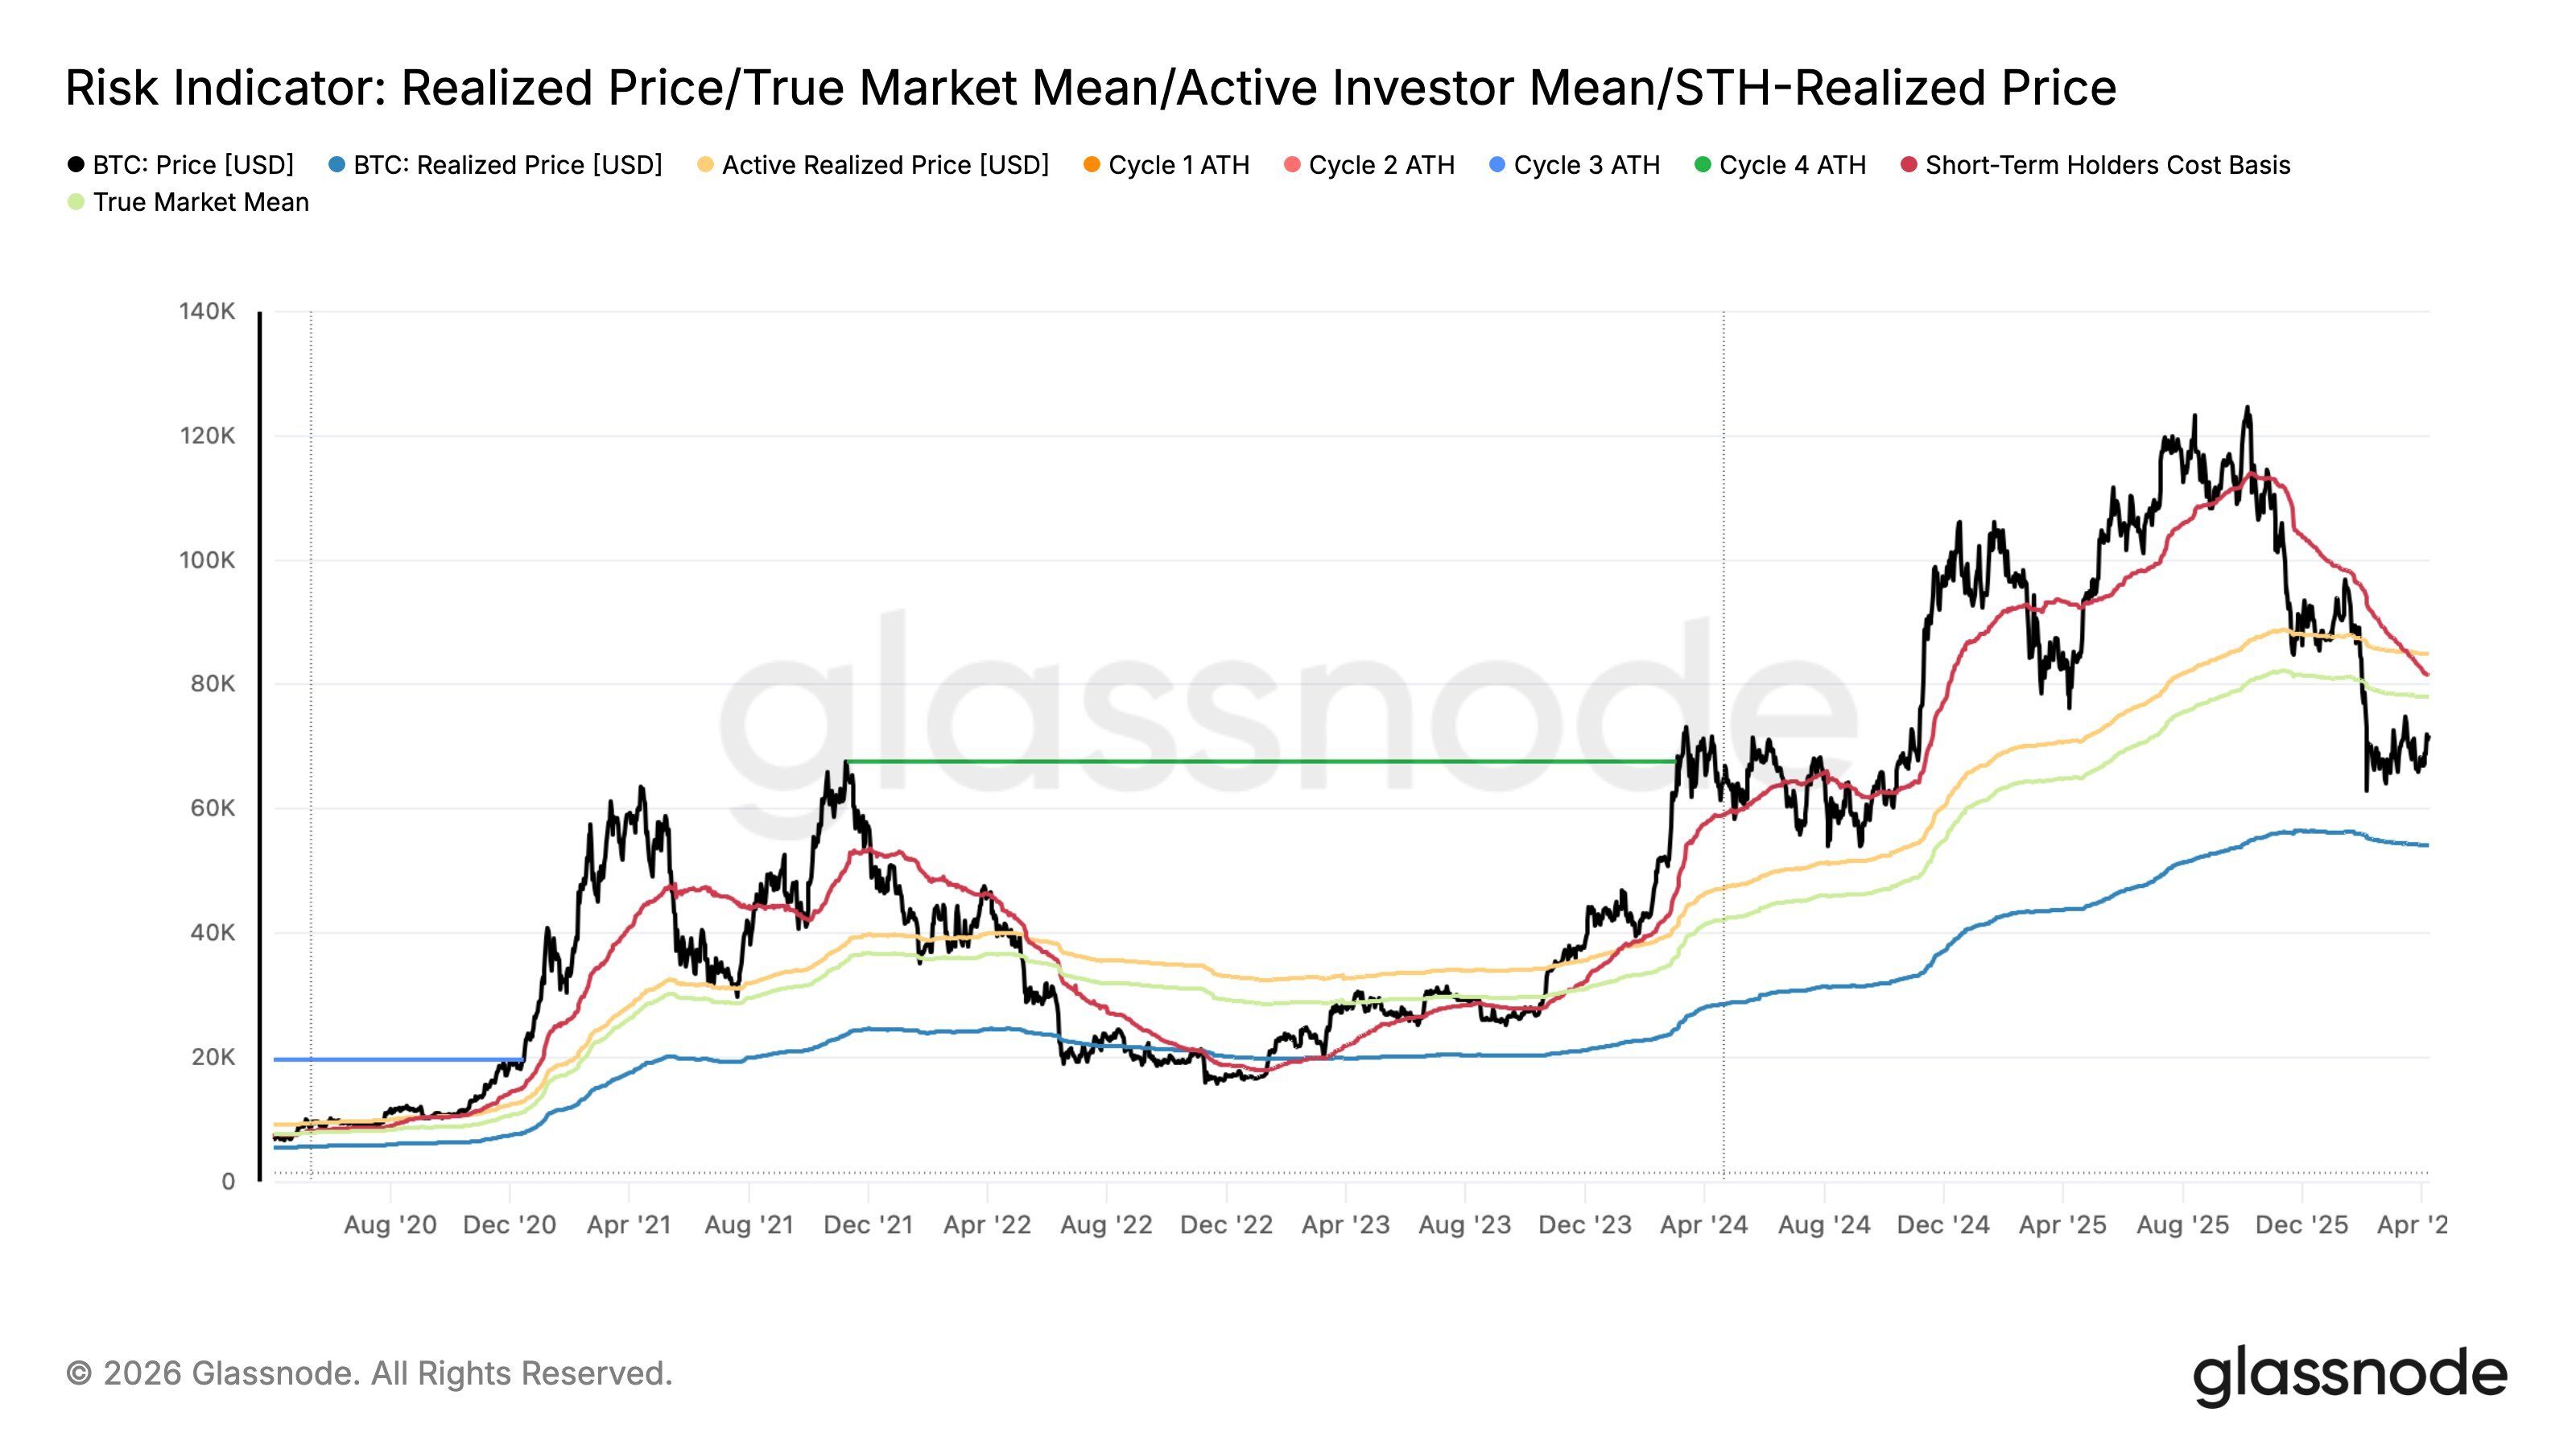
Realized price — $54,000
The average cost basis of every coin on the network. Bitcoin trading above this level means the average holder is in profit. This is the most fundamental long-term support and is currently well below spot, which is a structurally positive signal.
True market mean — $82,000
A more refined cost basis weighted by actual economic activity, filtering out dormant coins. Spot is currently below this level, meaning a meaningful portion of active participants are underwater.
Active investor mean — $88,000
The average cost basis of active market participants. Price trading significantly below this level signals stress among engaged investors and acts as overhead resistance.
Short-term holder cost basis — ($83–$84,000)
The average entry price for recent buyers (coins held for less than 155 days). With spot well below this level, short-term holders are sitting on unrealised losses — historically a source of continued selling pressure, but also a precondition for a capitulation bottom.
The key takeaway: spot at $70,925 sits above only the realized price and below the three other indicators.
This places Bitcoin in a historically recognized stress zone. Not the deep bear market territory of 2022 (when price fell below even the realized price), but a mid-cycle correction where short-term holders are underwater and overhead supply is significant.
Bitcoin’s Macro Structure In a Key Position
The weekly chart (August 2020 to present) provides the macro technical backdrop.
Bitcoin peaked at approximately $126,000 in October 2025 and has since corrected roughly 43% to current levels.
The current price is retesting the previous cycle’s all-time high from 2021 (~$69,000, yellow line), a level that historically transitions from major resistance into long-term support. This week’s green candle suggests early signs of a defense of that zone.
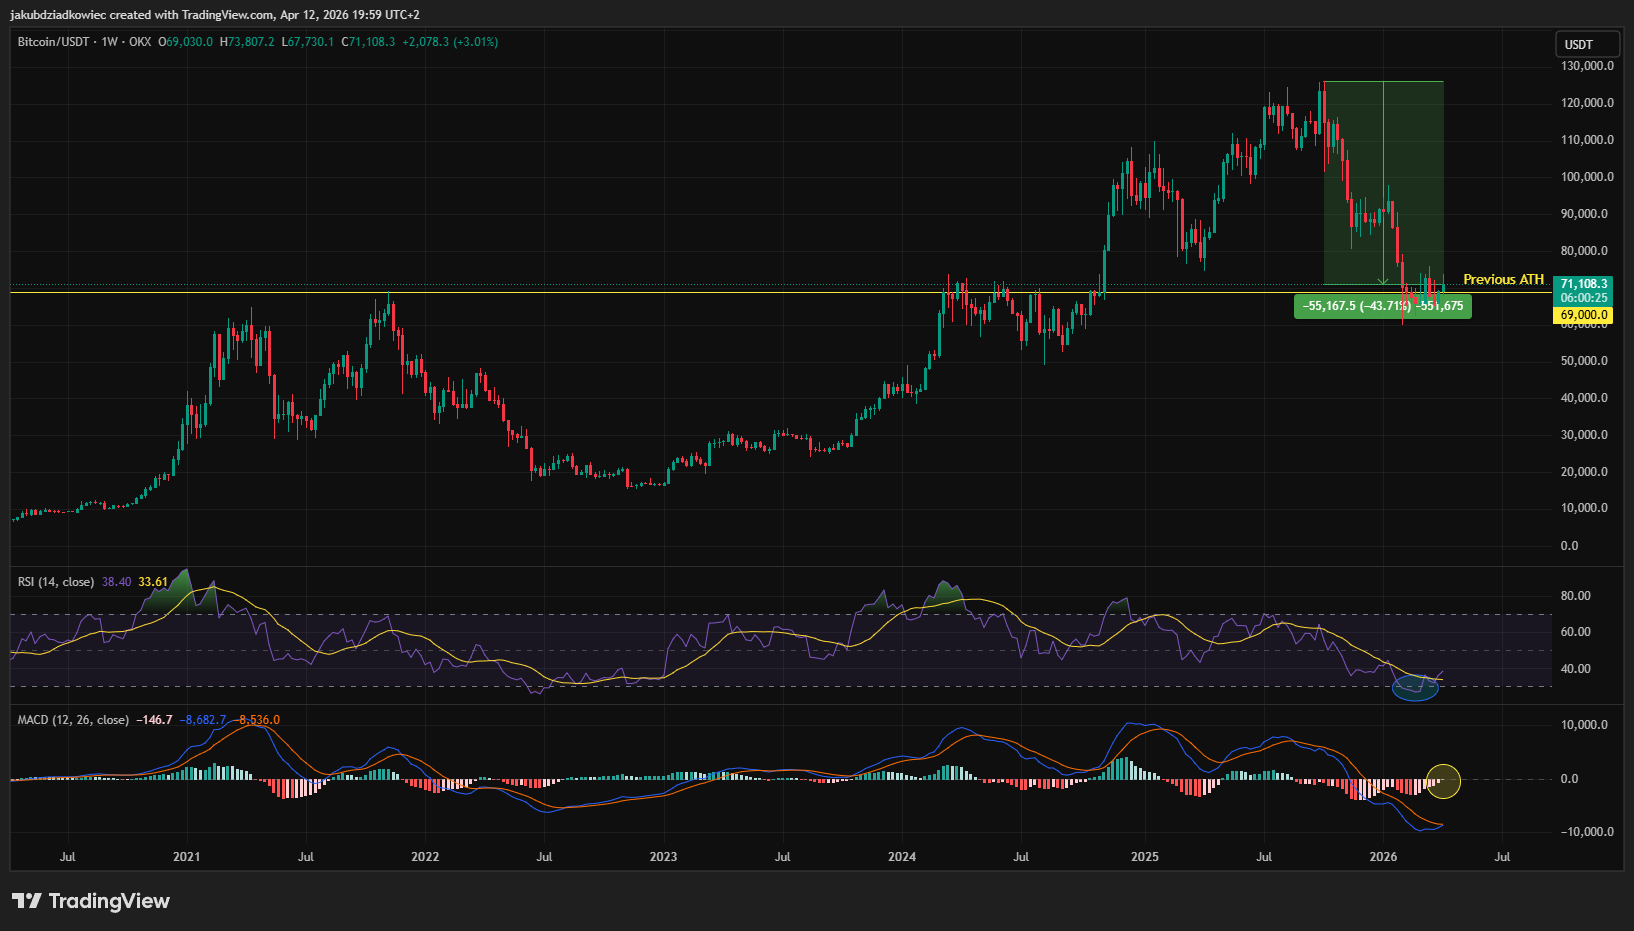
The RSI is right above the oversold territory (below 30) after visiting it for a few weeks in February 2026 (blue ellipse). Historically, the 2022 bear market saw RSI remain deeply oversold for many weeks.
The current reading is approaching those levels, which either signals further downside ahead or that a significant bounce is near. A bullish divergence — price making a lower low while RSI holds higher — would be a meaningful signal to watch.
The MACD is approaching its first bullish crossover (yellow circle) on the weekly chart since May 2025. This is a clear positive signal that has historically led to sharp rallies.
However, during the 2022 bear market, even a bullish MACD crossover failed to trigger a price rebound.
A bullish MACD crossover on the weekly chart would be a high-conviction reversal signal, but it has not yet occurred.
Broken Support, Fragile Crossovers, and a Key Demand Zone
The daily chart (January 2025 to present) provides the shorter-term picture and is where the most actionable signals currently reside.
The green-dotted box on the daily chart, at approximately $73-74,000, represents the March 2024 all-time high. It was a previously important resistance level that briefly became support, and has now been broken to the downside.
This breakdown is technically significant: price is now trading below that structural level, which has flipped into overhead resistance. The February 2026 low around $65,000 remains the key support level below current prices.
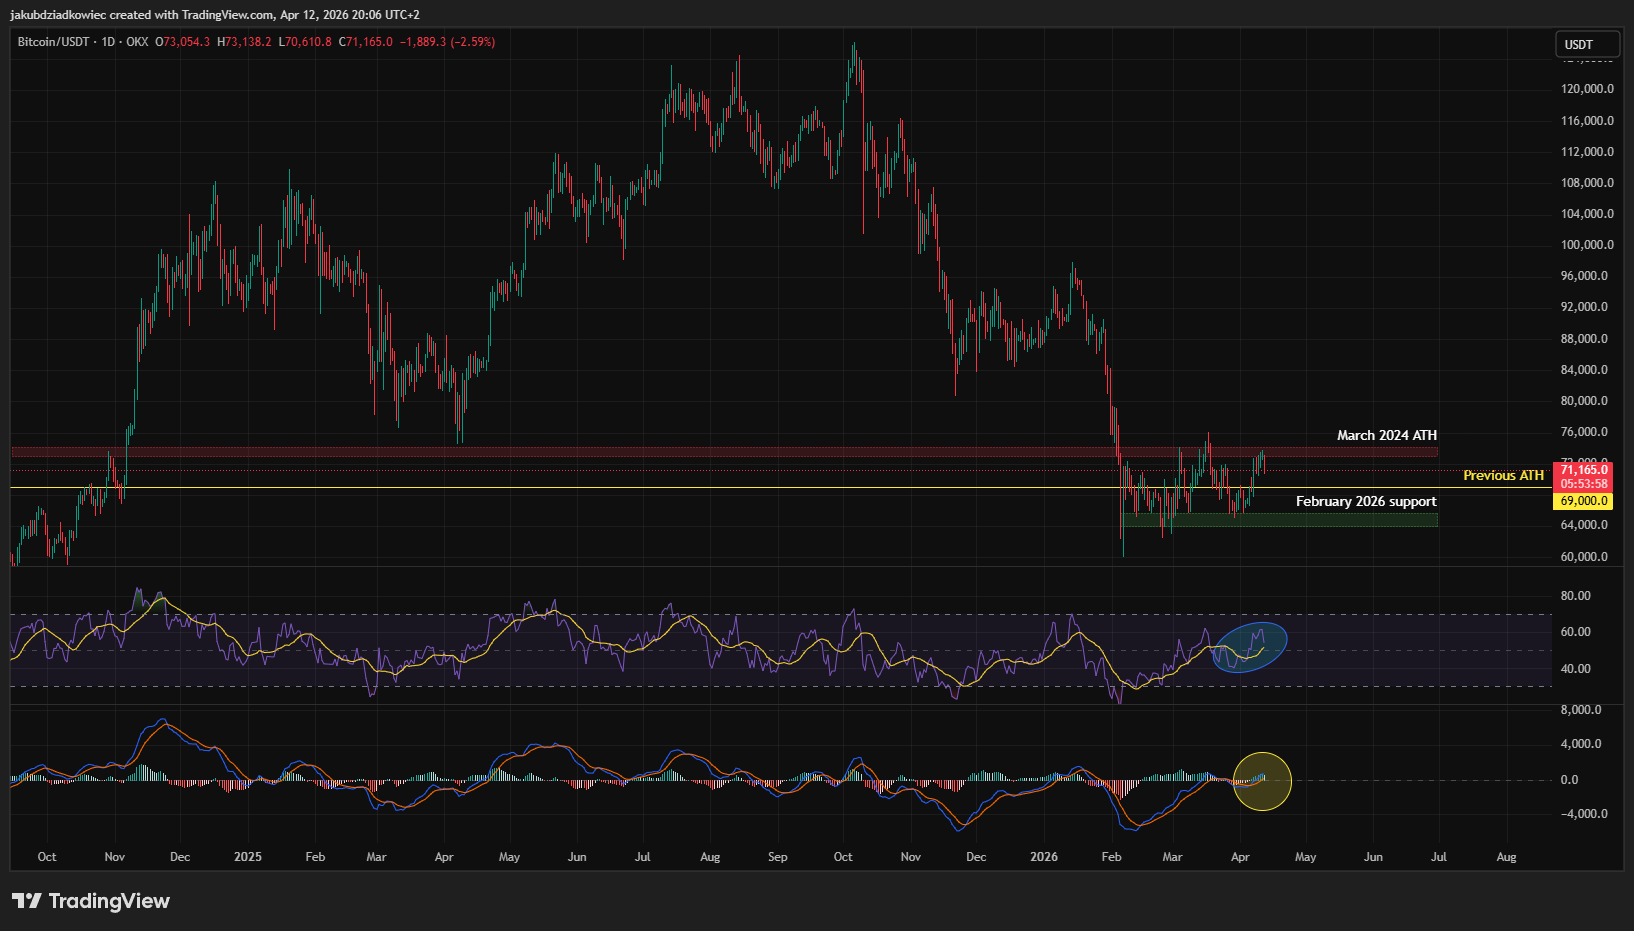
After reaching deeply oversold levels in December 2025 and again in February 2026, the daily RSI has recovered to a neutral mid-40s to low-50s range (blue ellipse).
This suggests panic selling has subsided, but bullish momentum has not yet been confirmed. A move above 60 on the daily RSI would indicate a genuine trend shift.
The daily MACD lines have crossed bullish and are hovering just above zero — a tentative positive signal (yellow circle). The histogram bars are small and mixed, reflecting consolidation rather than directional conviction.
This crossover needs to hold, and the histogram needs to expand into green territory to confirm follow-through buying.
Putting It All Together: Two Scenarios, One Line in The Sand
Combining Glassnode on-chain data with both timeframes of technical analysis yields two scenarios. The levels that confirm or invalidate each scenario are clearly defined.
Bullish Scenario: Mid-Cycle Correction, Continuation Higher
In a bullish scenario, the $69,000 level (previous cycle ATH) holds as support, short-term holders capitulate, and the market resets for a new leg higher:
Price defends the $69,000 weekly support zone and forms a higher low on the daily chart
Daily RSI breaks above 60, confirming bullish momentum restoration
Daily MACD histogram expands into green territory with increasing bar size
Price reclaims the $73-74,000 level (former support, now resistance) — this is the first key confirmation
Price then targets the $80-84,000 cluster (True Market Mean + STH Cost Basis) — reclaiming this zone would confirm a bullish trend reversal
On-chain: STH cost basis reclaimed would mean short-term holders return to profit, removing a key source of selling pressure
Bearish scenario — deeper correction, structural breakdown
In a bearish scenariu overhead supply from underwater short-term holders is too heavy, the $69,000 support fails, and Bitcoin seeks deeper value:
Price breaks below $69,000 on a weekly close. This is the primary bearish confirmation signal
Weekly RSI drops below 30 and stays there, mirroring 2022 bear market conditions
Daily MACD bullish crossover fails, and lines roll back below zero
Next downside target: $65,000 (February 2026 demand zone) — a break here accelerates selling
Deeper target: $54,000 (realized price). Historically the zone where bear markets find their ultimate floor
On-chain: price approaching realized price would represent maximum fear, and historically, the highest-probability long-term entry zone
Overall Assessment: $69,000 is the Line in the Sand
The weight of evidence currently leans cautiously bearish on the short-term but constructive on the medium-to-long term. Bitcoin is in a historically recognized stress zone — below the STH cost basis and the True Market Mean, but well above the realized price floor.
The weekly RSI is approaching oversold territory, and the daily MACD is poised for a bullish crossover, suggesting the worst of the selling may be near, but confirmation has not yet arrived.
The $69,000 level is the line in the sand: hold it, and the bull case builds; lose it on a weekly close, and significantly lower prices become the base case.
* The content presented above, whether from a third party or not, is considered as general advice only. This article should not be construed as containing investment advice, investment recommendations, an offer of or solicitation for any transactions in financial instruments.


