




Ripple Price Forecast: XRP bulls attempt breakout despite softening institutional and retail demand
- XRP eyes a short-term breakout toward $1.20, holding above $1.14 support on Friday.
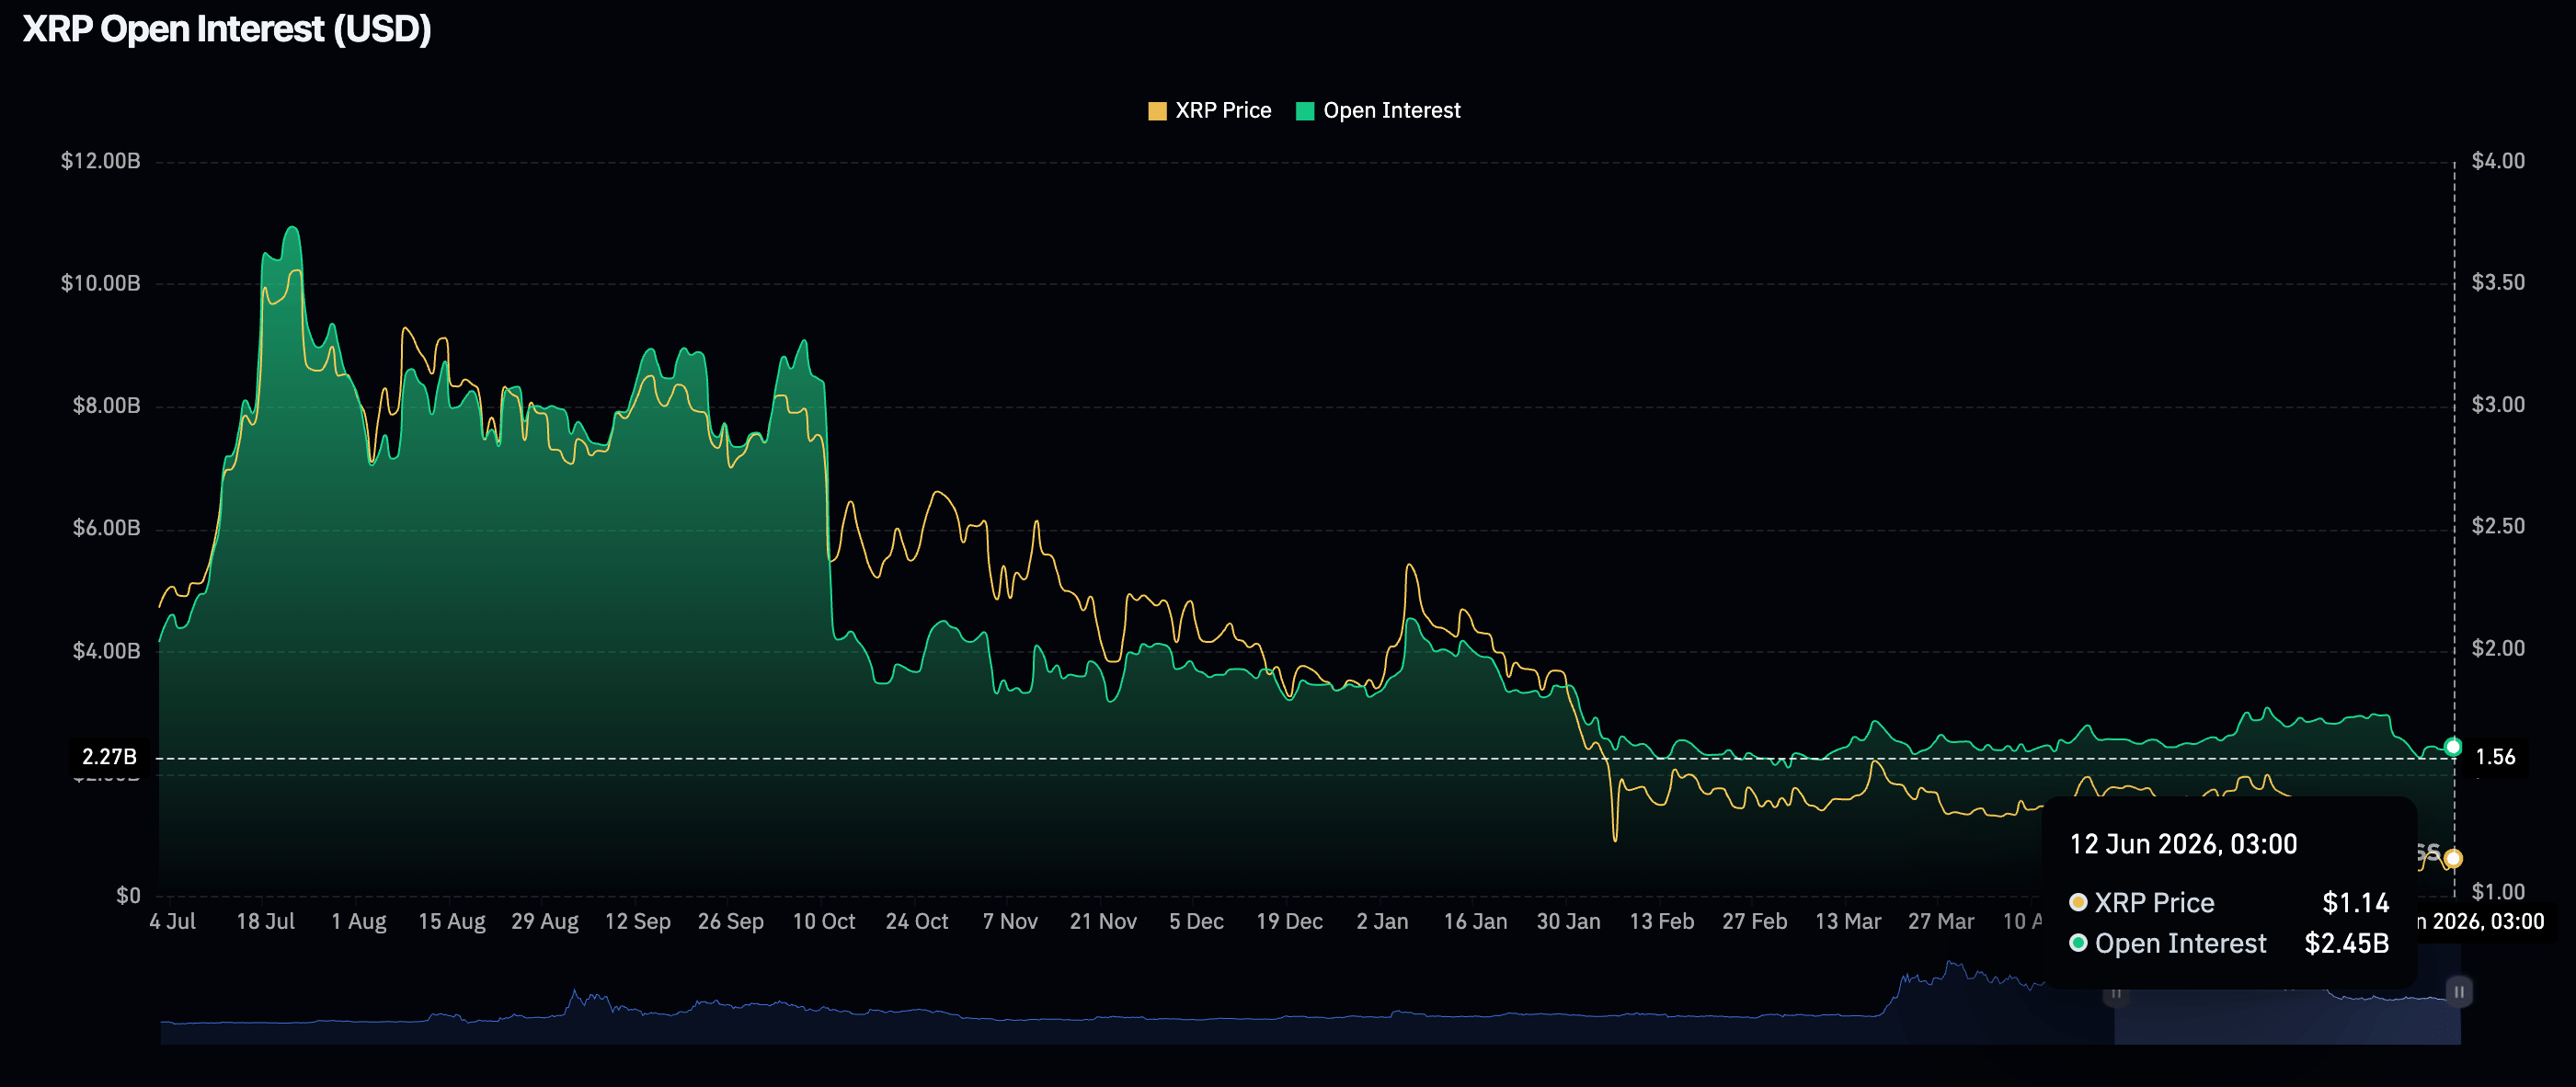
- XRP ETF outflows dry out amid cautious derivatives demand, with futures Open Interest averaging $2.45 billion.
- XRP’s subtle bullish bias builds on gradually improving momentum indicators.
Ripple (XRP) hangs on to $1.14 support at the time of writing on Friday, extending its rebound from its early-week support at $1.10 and June’s low of $1.05. Maintaining this short-term support level is vital for the remittance token to preserve its bullish momentum, with a decisive breakout above $1.20 likely to signal further upside potential.
Risk aversion grows amid capital outflows
XRP retail demand remains on the back foot, with futures Open Interest (OI) steadying at $2.45 billion on Friday. The OI averaged $2.96 billion on June 1 and was slightly above $3 billion on May 15.
A persistent sell-off in the derivatives market signals diminishing investor confidence in XRP’s ability to sustain its upward trajectory, with market participants reluctant to open new positions.
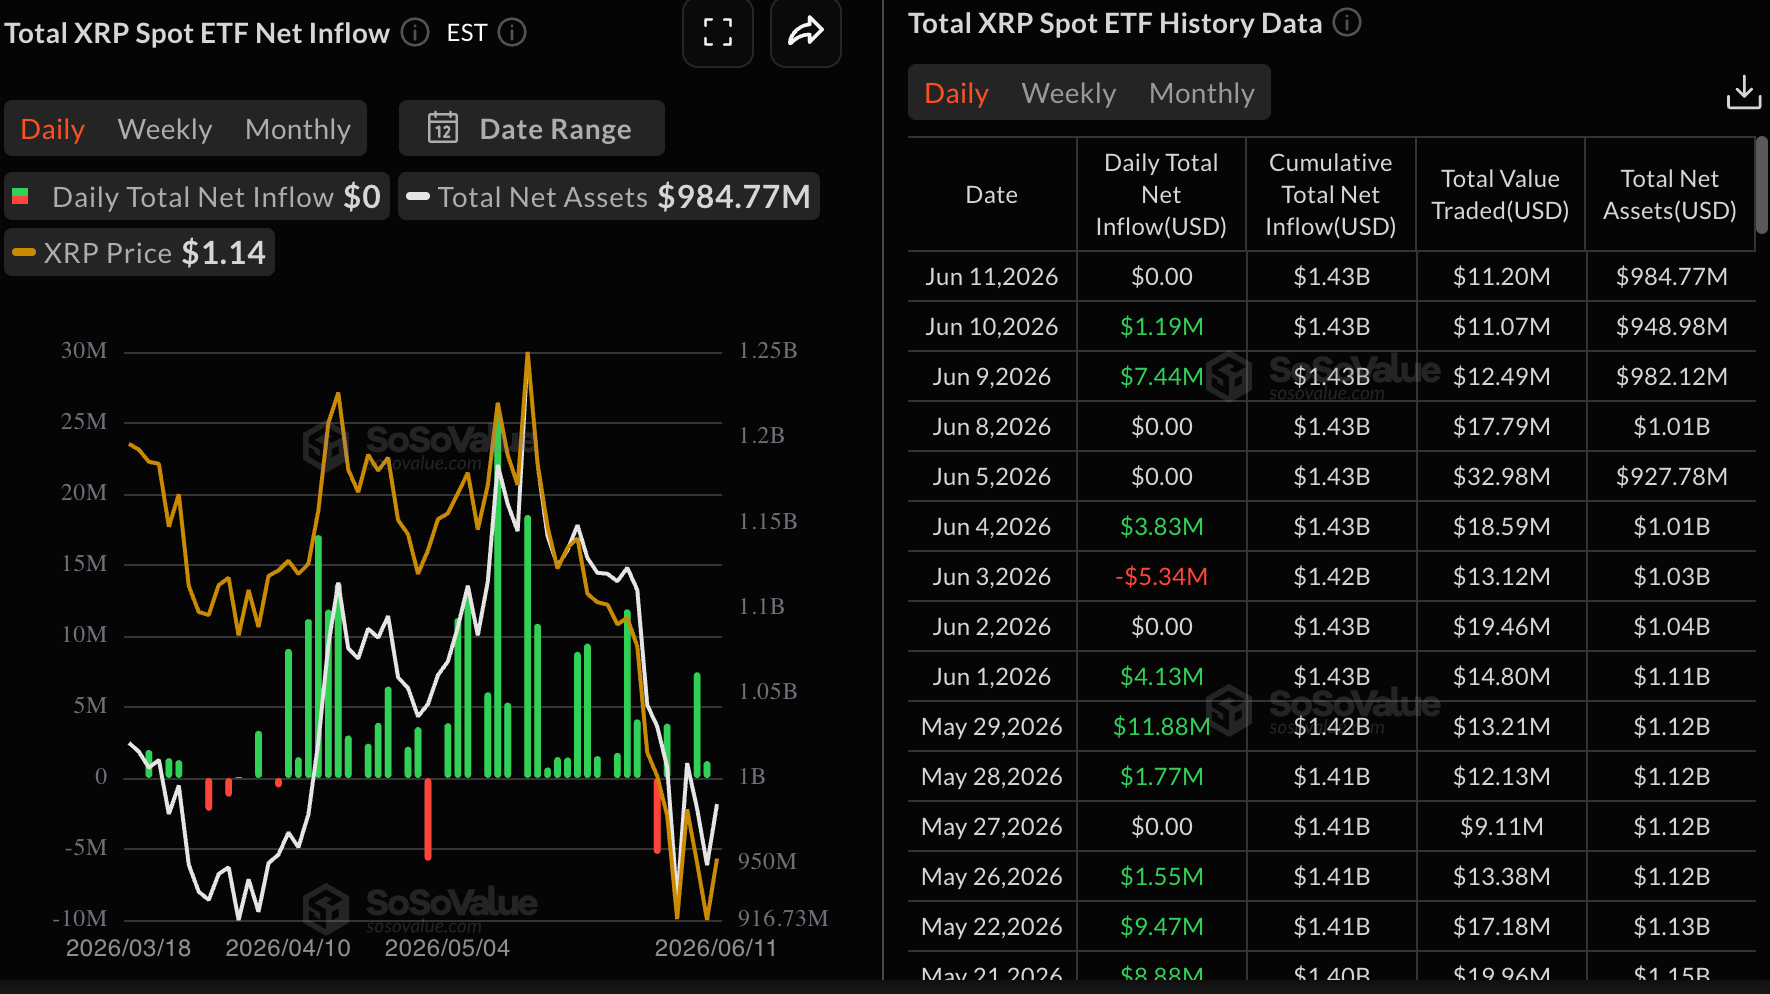
Institutional investors are cautiously increasing their exposure to digital assets, as evidenced by nearly $1.2 million in inflows into spot Exchange-Traded Funds (ETFs) on Wednesday. This follows approximately $7.44 million in inflows on Tuesday, indicating persistent demand for related crypto investment products.
Meanwhile, demand for XRP spot ETFs remained quiet, with zero flows recorded on Thursday, leaving cumulative inflows steady at $1.43 billion and net assets under management at $985 million, according to SoSoValue data. Sustained demand for spot ETFs is critical for supporting a broader recovery.
XRP price analysis: XRP retains subtle bullish bias
XRP trades above $1.14, extending a bearish bias as price holds well beneath the 50-day, 100-day and 200-day Exponential Moving Averages (EMAs). The short-term tone remains pressured while the SuperTrend line at $1.26 tracks above spot, keeping the downside exposed.
Momentum indicators stay subdued, with the Relative Strength Index (RSI) near 36 on the daily chart and Moving Average Convergence Divergence (MACD) histogram still negative, which together hint that sellers retain control despite the recent stabilization off the lows.
On the topside, initial resistance lies at the SuperTrend barrier around 1.26, ahead of the 50-day EMA near $1.30, which caps the next recovery attempt. Further up, the 100-day EMA at $1.39 and the 200-day EMA close to $1.61 build a broader supply zone that would need to be reclaimed to ease the prevailing bearish structure.
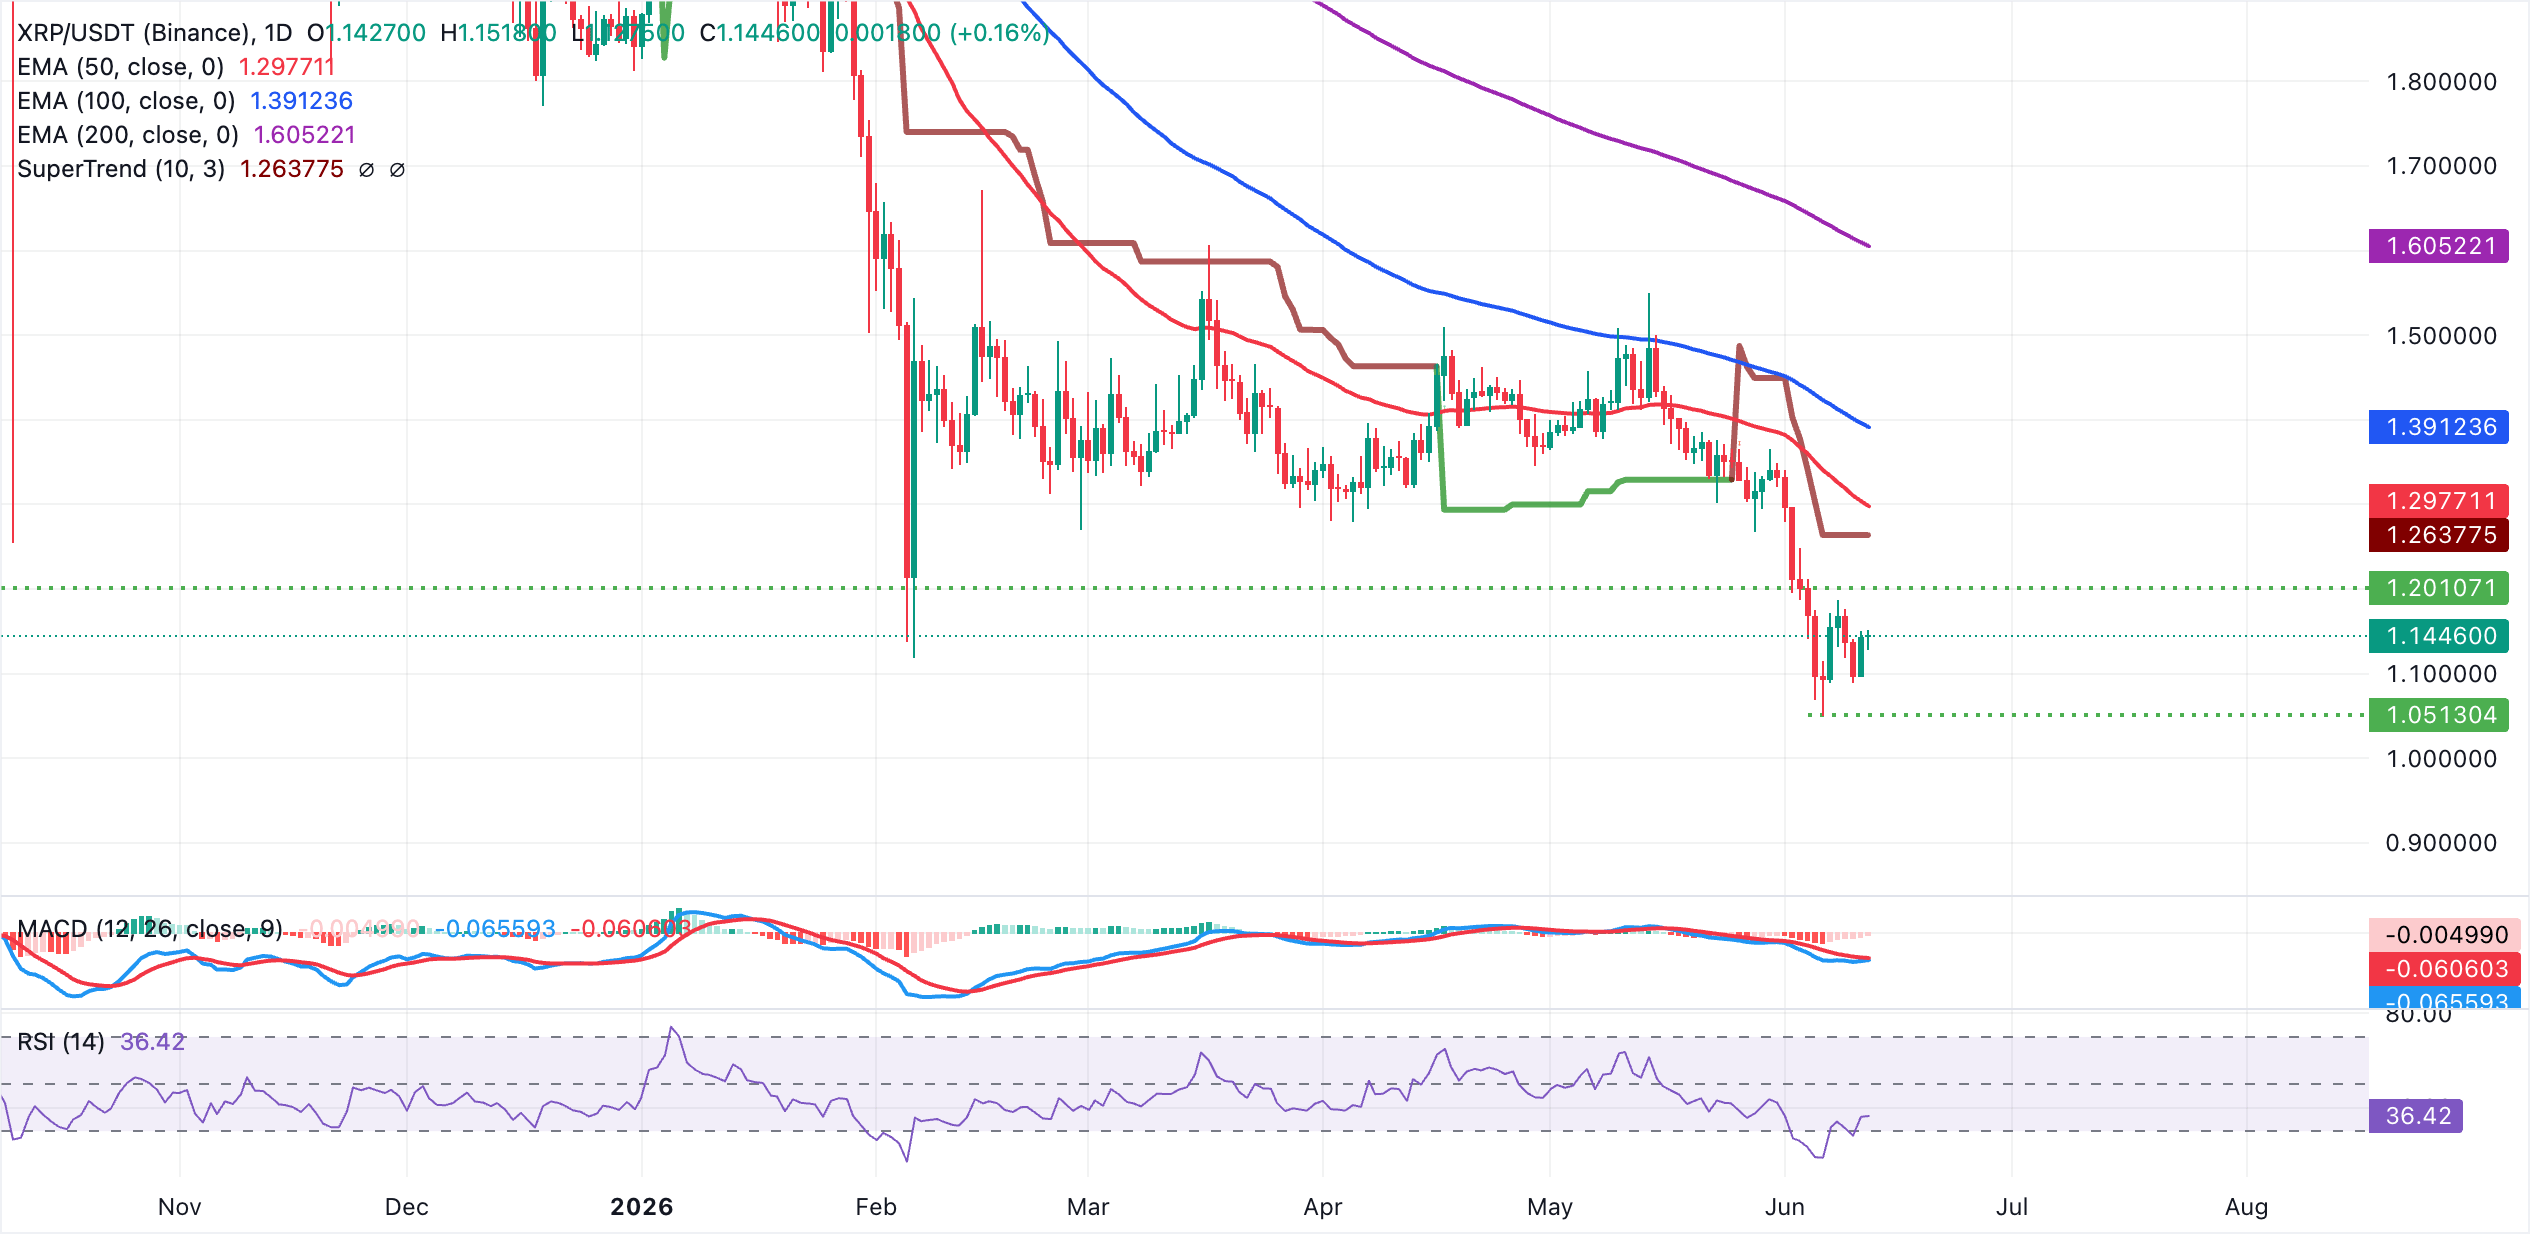
If selling activity continues and headwinds intensify, buyers may seek to re-engage at lower lows and psychological support zones, including $1.05 and $1.00. Renewed dips would leave XRP vulnerable to pressure until buyers can force a sustained move back above the first EMA layer.
(The technical analysis of this story was written with the help of an AI tool.)
Open Interest, funding rate FAQs
Higher Open Interest is associated with higher liquidity and new capital inflow to the market. This is considered the equivalent of increase in efficiency and the ongoing trend continues. When Open Interest decreases, it is considered a sign of liquidation in the market, investors are leaving and the overall demand for an asset is on a decline, fueling a bearish sentiment among investors.
Funding fees bridge the difference between spot prices and prices of futures contracts of an asset by increasing liquidation risks faced by traders. A consistently high and positive funding rate implies there is a bullish sentiment among market participants and there is an expectation of a price hike. A consistently negative funding rate for an asset implies a bearish sentiment, indicating that traders expect the cryptocurrency’s price to fall and a bearish trend reversal is likely to occur.
Recommended Articles


