


Qualcomm (QCOM) Q3 FY2026 Earnings Today: 15x Forward P/E, 90% Beat Probability
TradingKey - Tonight after market close, Qualcomm (NASDAQ: QCOM) will release Q3 FY2026 earnings. Qualcomm Q3 earnings call will begin at 1:45 PM PT. In premarket trading, Qualcomm shares are down about 2.5%, at $165.86, compared to Friday’s close of $170.04, dragging along other semiconductor stocks that have faced headwinds recently. Analysts on average expect Q3 FY2026 revenue to be $9.68 billion and EPS of $2.22.
This represents a 6.6% YoY revenue decline and a 19.5% YoY EPS decline, and both of these were guided by management to bottom out in Q3. Polymarket currently prices in a 90.5% probability that Qualcomm beats EPS estimates. Qualcomm has beaten consensus EPS in each of the last four quarters and has averaged a 3.28% positive surprise over those four quarters. Qualcomm’s forward P/E ratio stands at 15. The average analyst price target is $221.23. A descending trendline and Fibonacci support at $163.87 make up the technical floor for Qualcomm.
Why Revenue Expected to Decline, and Why the Stock Has Risen 15% Since Q2 Earnings
A 6.6% YoY revenue decline consensus isn’t unexpected, as it is what management guided to. Back in April when Qualcomm reported Q2 FY2026 earnings, management guided that Q3 revenue will be between $9.2 billion and $10.0 billion, stating that the impact of memory-industry dynamics and Chinese handset OEM inventory digestion was expected to bottom in Q3. Qualcomm’s handset business made up $6.0 billion of revenue in Q2, and revenue from handsets fell 13% year-over-year. This is due to the ongoing handset inventory correction, where smartphone OEMs over-ordered memory-intensive components in 2025 and are now cutting back orders to work down excess inventories. As Qualcomm’s main Snapdragon chipsets supply smartphones, its handset revenues trail OEM inventory cycles by one to two quarters.
Despite the 3% YoY revenue drop and 7% YoY EPS drop in Q2, Qualcomm shares rallied 15.1% on the day of Q2 results, as Qualcomm beat consensus EPS while also delivering a very bullish automotive forecast. In Q2, automotive revenue jumped 38% YoY to $1.3 billion, with Qualcomm saying the segment would end fiscal 2026 at an annualized run rate above $6 billion. Over one million vehicles are now running Qualcomm’s Snapdragon Ride ADAS processors. Tonight’s report will tell us whether that $1.3 billion automotive quarter was a one-off or the first quarter of a multi-quarter uptrend.
The Three Numbers That Will Move QCOM Tonight
First, the automotive numbers. If Q3 automotive is above $1.3 billion, or the $6 billion annualised run-rate management referred to, then the bull thesis that Qualcomm is successfully diversifying away from the handset market is proven. The second straight record quarter for automotive would be the most visible proof that Snapdragon Digital Chassis, Qualcomm’s unified platform that combines connectivity, infotainment, telematics, and ADAS, is capturing more content in vehicles.
Second, Q4 guidance for Chinese handset revenue. Management said Q3 was the bottom, but if Q4 guidance shows that handset revenue has begun to recover, then 15x forward earnings for QCOM is too cheap given the recovery potential.
Finally, the hyperscaler update. Qualcomm has been chasing hyperscaler data centre / custom silicon deals as part of its diversification away from handsets. Any named customer or timeline for that deal is new information that isn’t reflected in any current price targets.
In terms of the valuation for which the market is already pricing in a QCOM beat: 15x forward earnings, 7.28% FCF yield, 2.16% dividend yield, $20B share repurchase approved in March 2026. The market prices QCOM as a defensive semiconductor play. The consensus analyst target of $221.23, representing 31% upside, is based on the idea that the handset trough will be short-lived and that there’s a multi-year revenue ramp from auto + IoT + hyperscaler. QCOM will come off of a much lower valuation base than other AI semiconductor players. The trailing P/E for NVIDIA is 30 vs 18 for QCOM. And the 7.28% FCF yield for QCOM is much higher than the 1.93% FCF yield for NVIDIA.
QCOM Technical Setup
QCOM is currently trading at $164 on the 4-hour timeframe. The stock is sitting under a descending trendline that has capped the rallies since the start of July. It’s also below the 50-period EMA ($173.75) and the 200-period EMA ($186.50). With an RSI reading of 42, the stock is trading below the neutral line. The 0.786 Fib at $167.04 and the 0.618 Fib at $169.52 are the first two resistances in any rally.
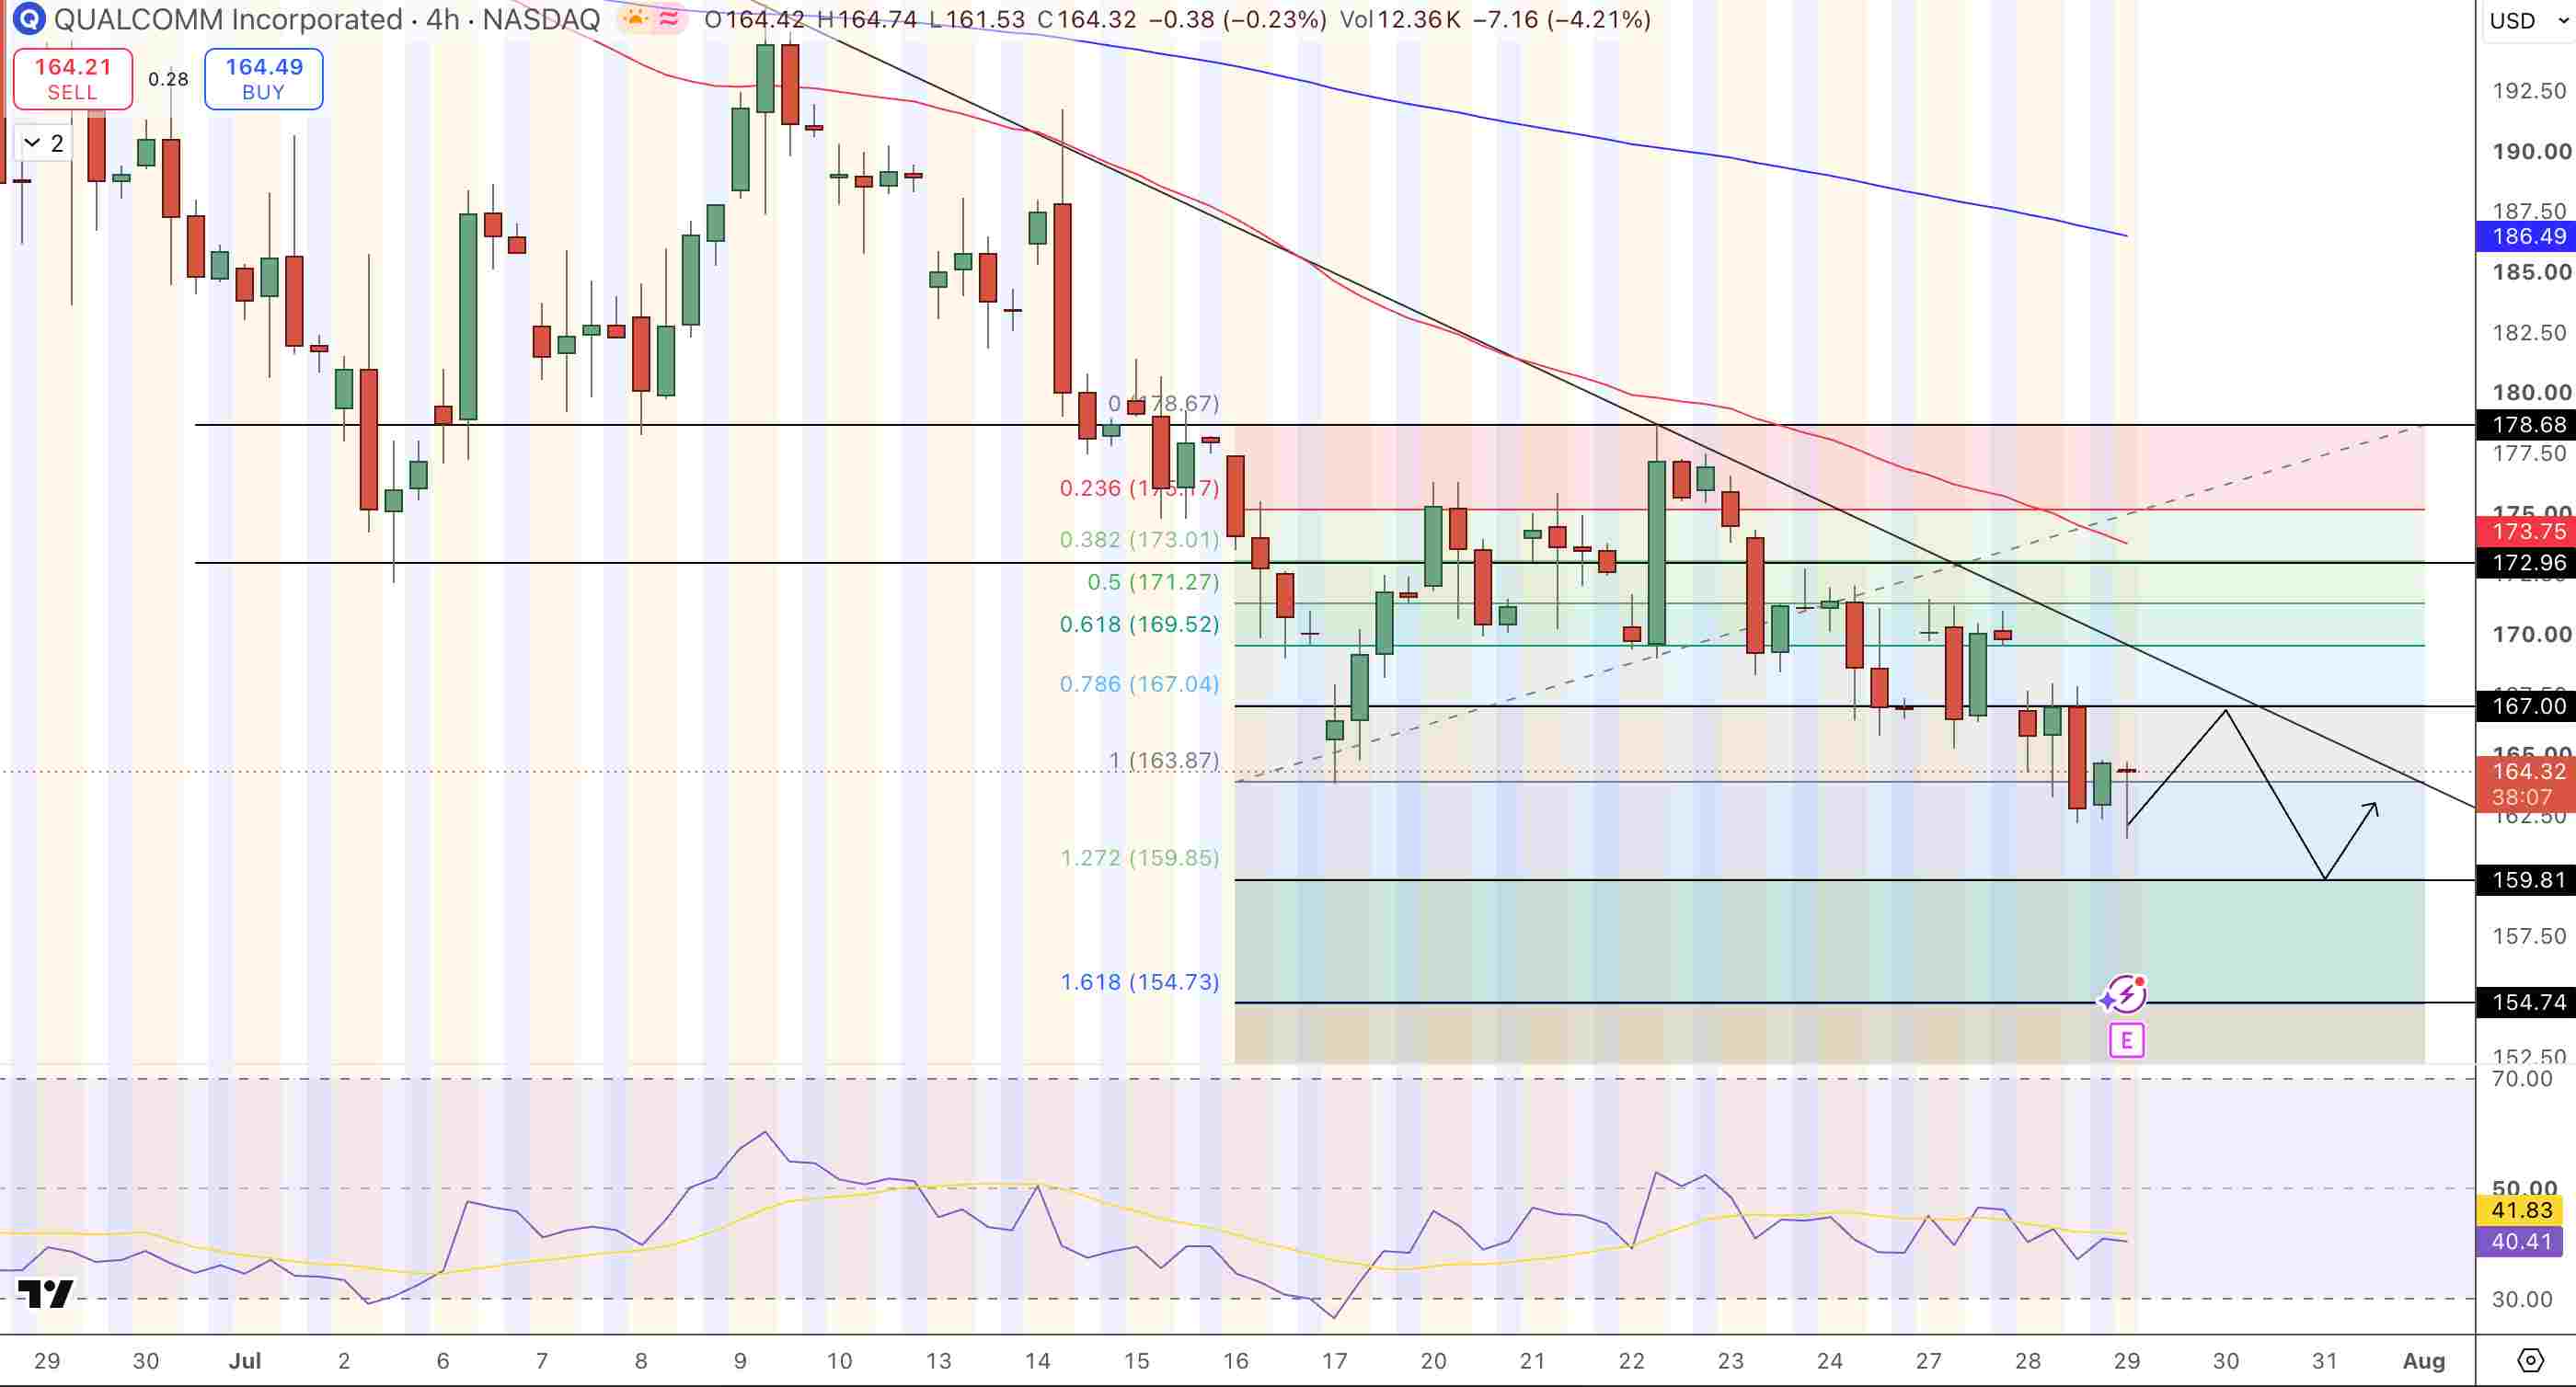
Qualcomm (QCOM) Price Chart - Source: Tradingview
A break of the trendline and a clean close above $167.04 would be the first sign that a rally has started. QCOM’s first support sits at $159.81, while a secondary level sits at $154.74 (the 1.618 Fib extension). A solid Q3 earnings beat with Q4 guidance raised could force QCOM to gap above the trendline, something that the technical indicators are struggling to achieve on their own.
QCOM Key Levels
- Q3 Consensus: EPS: $2.22, Revenue: $9.68B (-6.6% YoY). Guided to $9.2-10.0B in April
- Probability of beat: Polymarket: 90.5%. QCOM has beaten estimates 4 consecutive times. Average positive surprise: 3.28%
- Automotive: Q2 Automotive revenue hit a record $1.3B (+38% YoY). Management guided for an FY2026 exit run-rate above $6B annualised
- Valuation: Forward P/E: 15. FCF Yield: 7.28%. Dividend Yield: 2.16%. Average Analyst Target: $221.23
- Capital returns: $20B buyback approved March 2026. Dividend raised to $0.92
- Resistance: $167.04 (0.786 Fib + trendline), $169.52, $172.96, $173.75 (50 EMA)
- Support: $159.81, $154.74 (1.618 Fib extension)
Why Is Qualcomm's Revenue Expected to Decline in Q3 Despite Being a Profitable Business?
It’s not surprising, as this has been guided by management. And it’s not indicative of Qualcomm’s competitive position. Smartphone OEMs who buy Qualcomm’s Snapdragon chips over-ordered in 2025, and are working through the inventory glut in calendar 2026. They’re still selling the phones, they just aren’t ordering chips at the normal rate, hence the lower volumes in the near term.
Management specifically said that the impact from memory-industry dynamics will bottom out in Q3, implying a sequential improvement in Q4. Indeed, the Q2 FY2026 report showed an EPS beat despite the revenue decline, and the stock rallied 15.1% on the day. So the market clearly knows that the handset trough is only temporary.
What Makes Qualcomm's Automotive Business Significant?
Qualcomm’s Snapdragon Digital Chassis combines digital cockpit, connectivity, telematics and ADAS into a single chip-and-software solution used by car manufacturers around the world. Currently, more than 1 million cars on the road are using Snapdragon Ride ADAS processors.
Automotive revenue was $1.3 billion in Q2 FY2026, up 38% YoY, putting it on track to exceed $5 billion for the first time this fiscal year. Management is guiding for the automotive segment to exit fiscal 2026 at an annualised run-rate of above $6 billion.
It’s important because automotive revenue has a better margin profile and longer contract lengths than handset chips. It also reduces Qualcomm’s reliance on smartphone OEM buying cycles.
Bottom Line
Qualcomm reports Q3 FY2026 tonight at 15x forward earnings with Polymarket 90.5% probability of an EPS beat vs consensus $2.22 on $9.68B revenue. The revenue decline is guided and expected, and it’s all about whether automotive keeps the record streak going above $1.3 billion, whether Q4 handset guidance validates the Q3 bottom that management called in April, and whether there’s any hyperscaler silicon news.
Four consecutive beats at a mean of +3.28%. Average analyst target $221.23, or +31% from $165.86. Descending trendline around $167, plus Fib resistance, are the final gates. An EPS beat, combined with improved forward guidance, might just be the key to opening the gates.
Recommended Articles


