


Tesla (TSLA) Price Forecast: $299 Is the Line in the Sand Heading Into the Fed
TradingKey - Tesla (NASDAQ: TSLA) finished Friday at $313.03, with after-hours trading slipping to $311.38. This has the stock now trading roughly 14% lower versus where it was before earnings last week. It is also trading only 4.5% above its 52-week low of $297.82. On the technical side, an RSI at around 28 indicates oversold conditions. The overall picture still appears bearish though, with the price falling below the 50-day EMA ($392.11) and 200-day EMA ($394.77). Investors will pay attention to the Fed decision, updates on the Robotaxi and analyst revisions after Tesla's earnings, this week.
Q2 Mixed Results Continue to Hold Investors Back
Tesla announced Q2 revenue of $28.24 billion, topping the consensus estimate by 6.8% after it delivered 480,126 vehicles, a record high for the quarter. However, non-GAAP EPS of $0.33 came in short of the consensus at $0.54 as margin erosion from incentives continued to drag on profitability. Automotive gross margin without regulatory credits dropped to 16% from 19% in Q1, while free cash flow decreased to -$1.09 billion as capital expenditures increased 142% to $5.79 billion. Management also added 2026 would be Tesla’s highest investment year since it went into mass production.
Cybercab And Large Order Backlog Remain Positive For The Future
Although there were negative aspects, Tesla also delivered some positive information, such as it ended the quarter with the largest vehicle order backlog since 2023. This shows that demand is still higher than deliveries. Musk also added that production of the Cybercab has commenced and that the vehicle is expected to be sold under $30,000 before 2027. These remain positive factors for Tesla in the long run, although investors seem more concerned by margin pressure and cash flow this time around.
Fed Decision And Robotaxi Progress To Watch
This week’s Federal Reserve policy decision could be the major catalyst externally. If the Fed moves in a way that changes interest rate expectations, it would potentially affect the cost for vehicle financing and the valuation of growth stocks like Tesla.
Expectations also for the next round of the Robotaxi rollout in general, or specifically on any new updates on plans to scale or regulatory approval. Finally, analysts are due to revise their earnings estimate and price targets after last week’s earnings.
TSLA Technical Setup
On the daily chart, TSLA is below both EMAs in a confirmed downtrend from the $498.83 52-week high. RSI at 28 is deeply oversold, which statistically increases the probability of a relief bounce but does not signal reversal while price is below major moving averages. The $299.15 Fibonacci support is 4.5% below Friday's close.
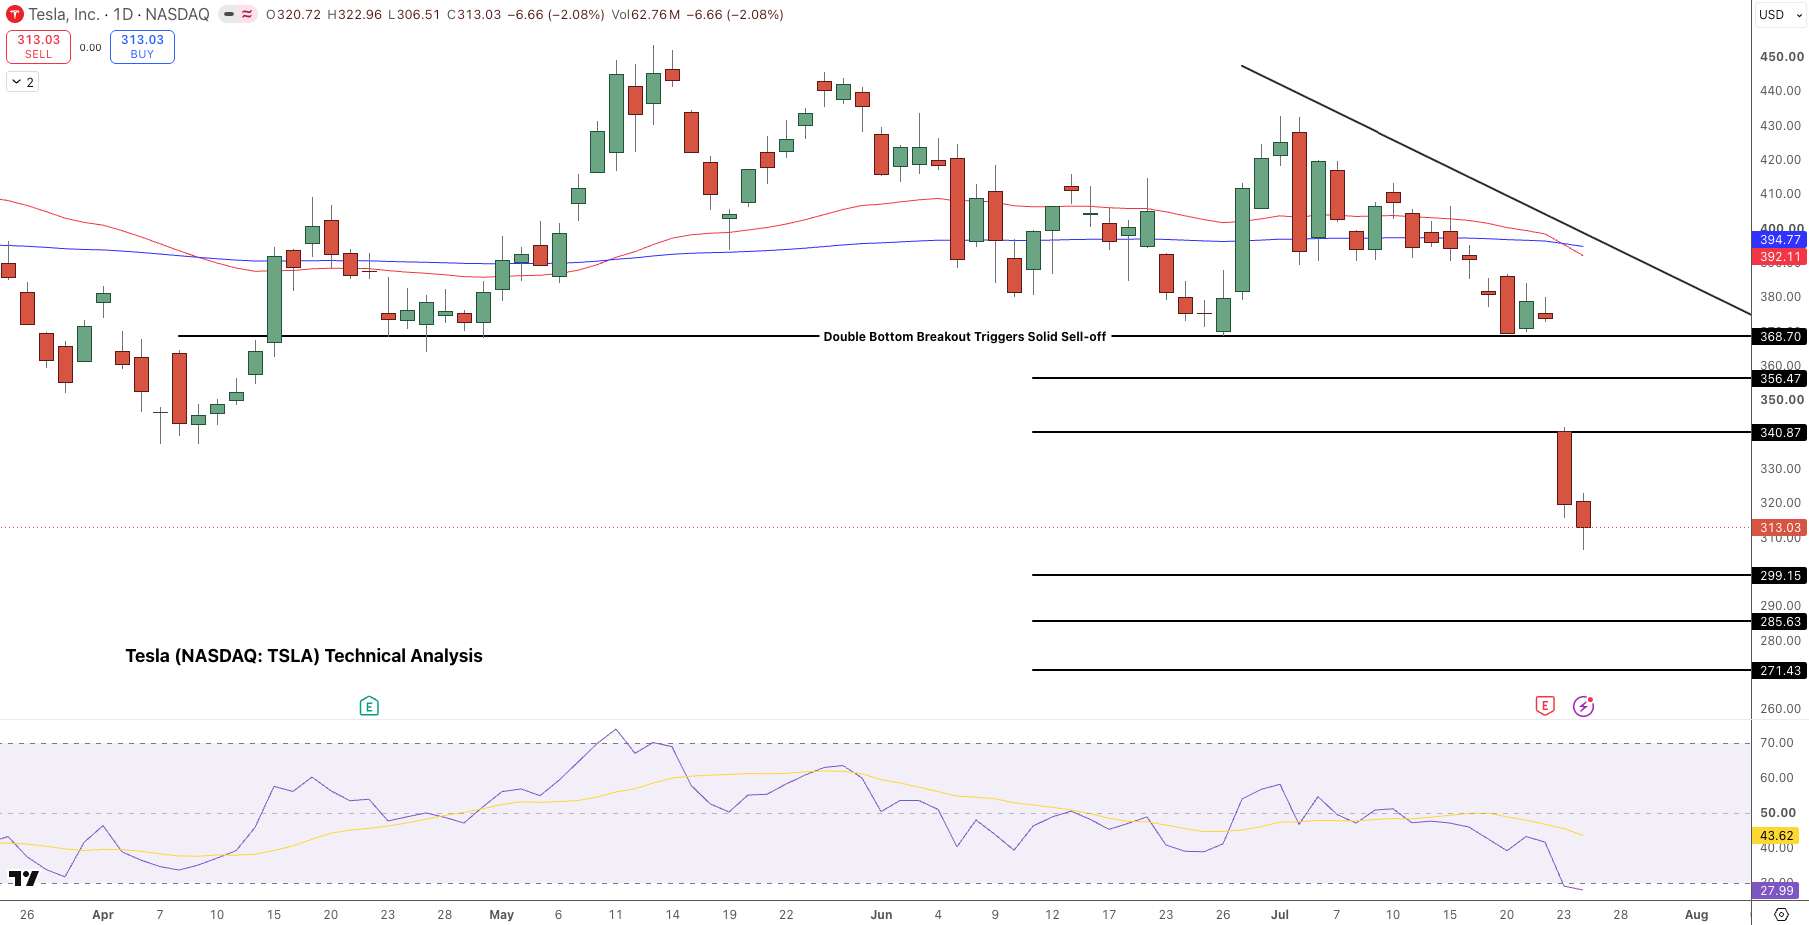
Tesla (TSLA) Price Forecast Chart - Source: Tradingview
A hold above $299.15 into the week sets up a corrective bounce toward $340.87, then $356.47 and $368.70. A decisive close below $299.15 opens $285.63 and then $271.43. The 52-week low at $297.82 is the last technical floor before the stock enters price territory not seen since 2024.
Key Levels
- Friday close: $313.03. After-hours $311.38. 52-week range: $297.82 to $498.83
- Q2 EPS: $0.33 vs $0.54 consensus (-38%). Auto margin ex-credits 16%, down from 19%
- Bull signals: Largest auto backlog since 2023 at Q2 exit. Cybercab under $30K confirmed, production begun
- This week: Fed policy decision. Robotaxi updates. Analyst revisions post-earnings
- Critical support: $299.15 (4.5% below Friday close). Below: $285.63, $271.43
- Recovery levels: $340.87 (first target on bounce), $356.47, $368.70
Why Did Tesla Fall 14% After Beating Revenue?
While Tesla cleared top-line estimates by 6.84% ($28.24B in Q2), it missed the non-GAAP EPS estimate by 38% at $0.33 vs $0.54. The EPS surprise was largely due to aggressive discounting and subsidy programs that helped boost Q2 deliveries to a record 480,126, but in doing so, ate up margins on a per-car basis.
Quarterly automotive gross margin, absent regulatory credits, was down to 16%, from 19%. Regulatory credit revenue dropped 67% to $146M. Operating income was down 57% at $398M. Free cash flow was a negative $1.09B due to a 142% jump in CapEx to $5.79B.
Record volume does not necessarily mean record cash earnings, and the market at a 350-plus P/E is focused on whether Tesla can generate earnings at scale, not just units.
What Is the Cybercab and Why Does Under $30,000 Matter?
The Cybercab is Tesla's first purpose-built autonomous robotaxi, designed for fleet deployment without a driver or manual controls like a steering wheel or pedals. On the July 22 earnings call, Musk announced that production has started, and he reiterated the vehicle will be priced under $30K prior to 2027.
This price point is the critical assumption underpinning the business case: only if the Cybercab is sold for less than $30K can the economics support deployment costs that beat Waymo's current ride-hail pricing while delivering enough profit per car to justify the capital outlay.
It is the under-$30K number that transforms the autonomous ride-share thesis from speculative to a tangible investment opportunity; analysts need a price to build a return model.
What Is $299 and Why Does It Matter?
At $299.15, TSLA sits in its 283-times trailing earnings territory. It also corresponds with the Fibonacci support level, as well as the 52-week low of $297.82. The implication is that if TSLA closes above $299 this week, it would mean buyers are stepping in at the 52-week low range, an area where value-oriented and long-term investors often start adding to positions in response to sharp downside.
However, a break and hold below $299.15 would send the stock into price levels not seen since the start of 2024, which has historically accelerated selling as the lack of technical support prompts more traders to step out of their losses, resulting in a significant gap to the subsequent support level at $285.63.
Bottom Line
With TSLA sitting near $313, which is 4.5% higher than the 52-week low of $297.82 and the $299.15 Fibonacci support, the current RSI is in deep oversold territory. A near-term relief rally should be the more probable outcome provided $299 holds. Fundamentals on the positive side include record revenue and the largest automotive backlog since 2023.
However, there are negatives including 16% automotive margins, negative free cash flow, and a 38% miss on earnings. Macro events this week include the Federal Reserve's policy decision and any additional details regarding the Robotaxi rollout.
If $299 holds and the Fed signals a dovish tone, a move back up to $340 is likely. But a clear break below $297.82, which is the 52-week low, would constitute a significant breakdown for TSLA and leave the stock with little visible support to the downside.
Recommended Articles


