


Warren Buffett's "Playing With Fire" Warning Is Back: Here's What History Says Happens Next for Stocks, and What Investors Can Do About It
Key Points
The Buffett indicator takes the total market cap of the U.S. stock market and divides it by GDP.
Buffett has warned that when this ratio eclipses 200%, stocks have become overvalued.
Currently, the Buffett Indicator is hovering over 230% -- an all-time high.
- 10 stocks we like better than S&P 500 Index ›
Warren Buffett stands as one of the most celebrated investors in history. Under his leadership at Berkshire Hathaway beginning in 1965, the investment conglomerate delivered a compound annual gain of 19.7% through 2025, almost double the S&P 500's (SNPINDEX: ^GSPC) 10.5% average annual return over the same period.
That performance turned modest early investments into generational wealth for patient shareholders, validating Buffett's reputation for focusing on long-term value rather than short-term profits.
Missed Nvidia in 2009? This Rare Signal Is Flashing Again. In 2009, a "Double Down" signal flashed for a little-known chipmaker called Nvidia. For the first time in years, that same "Total Conviction" signal is flashing for a company 1/100th the size of Nvidia. Continue »
One tool the Oracle of Omaha has long employed for gauging the health of the stock market is the aptly named Buffett indicator, which compares the total value of U.S. stocks to gross domestic product (GDP). Its currently elevated reading raises questions about whether stocks are outrunning underlying economic growth and what that could signal for future returns.

Image source: Getty Images.
What is the Buffett indicator, and how is it calculated?
The Buffett indicator is a ratio between the aggregate market capitalization of all publicly traded U.S. companies -- typically captured by a broad index such as the Wilshire 5000 -- and nominal U.S. GDP. This metric offers a snapshot of how large the stock market has become relative to the size of the economy that ultimately supports corporate profits.
The Buffett indicator has historically hovered below 100%, with notable spikes near 140% during the dot-com bubble and around 190% in late 2021. A rising indicator implies that stock prices are expanding faster than economic output. This can occur during periods reflecting heightened investor optimism, abundant liquidity, or expectations of future growth that may ultimately prove difficult to sustain.
In Buffett's own words, a reading approaching or exceeding 200% is a territory where investors are "playing with fire." Currently, the Buffett indicator stands at roughly 234% -- an all-time high.
Image source: The Motley Fool.
What is fueling the stock market higher right now?
There are a number of powerful forces lifting stock prices at the moment. Over the last few years, spending related to artificial intelligence (AI) has surged to hundreds of billions of dollars annually, with major technology companies committing unprecedented sums to data centers, chips, and infrastructure. These capital outlays have driven outsize earnings growth for semiconductor makers and related suppliers.
In addition, steady consumer spending and supportive fiscal measures have further reinforced the narrative of durable macroeconomic expansion. Resilient employment data and the absence of severe recession signals have encouraged investors to look beyond geopolitical tensions and energy-driven inflation, keeping risk appetite intact.
How should investors structure their portfolio as the Buffett indicator rises?
Elevated readings on the Buffett indicator often precede periods of subdued or even negative returns. After prior peaks, the stock market generally experienced meaningful drawdowns. With that said, the metric is not necessarily a precise timing device.
Smart investors understand that valuations can remain stretched for years, and a high Buffett indicator alone does not guarantee an imminent sell-off or recession. Other variables surrounding economic fundamentals and monetary policy will also determine the trajectory of the stock market.
Investors can prepare for corrections by maintaining a diversified portfolio across different asset classes, emphasizing blue chip companies with durable competitive advantages and reasonable valuations rather than pure momentum plays. In addition, supplementing your stock positions with a cash reserve provides financial flexibility to deploy capital during periods of decline.
^SPX data by YCharts
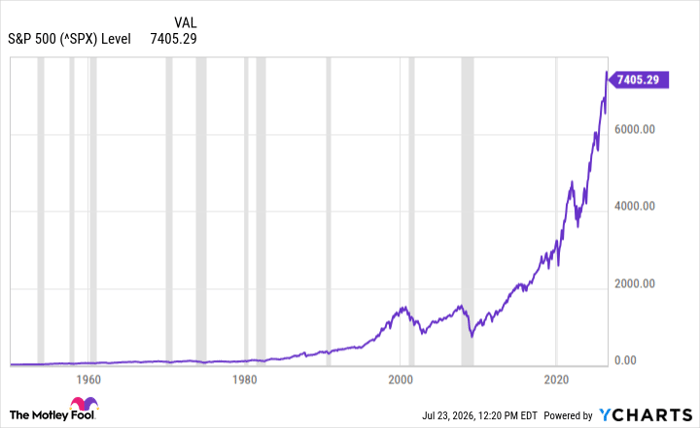
What should be avoided is chasing the latest high-flying growth stocks, frequent short-term trading, or abandoning a high-conviction, long-term plan in response to volatility. The chart above illustrates the S&P 500 over the last several decades, annotating recessions with the grey-shaded columns. As investors can see, the index always went on to notch a fresh all-time high following periods of digestion or declining economic growth.
In the long run, patience, discipline, and an unwavering focus on intrinsic value remain the most reliable guides to create wealth when the stock market appears expensive by historical norms.
Should you buy stock in S&P 500 Index right now?
Before you buy stock in S&P 500 Index, consider this:
The Motley Fool Stock Advisor analyst team just identified what they believe are the 10 best stocks for investors to buy now… and S&P 500 Index wasn’t one of them. The 10 stocks that made the cut could produce monster returns in the coming years.
Consider when Netflix made this list on December 17, 2004... if you invested $1,000 at the time of our recommendation, you’d have $377,990!* Or when Nvidia made this list on April 15, 2005... if you invested $1,000 at the time of our recommendation, you’d have $1,269,518!*
Now, it’s worth noting Stock Advisor’s total average return is 896% — a market-crushing outperformance compared to 206% for the S&P 500. Don't miss the latest top 10 list, available with Stock Advisor, and join an investing community built by individual investors for individual investors.
See the 10 stocks »
*Stock Advisor returns as of July 26, 2026.
Adam Spatacco has no position in any of the stocks mentioned. The Motley Fool has no position in any of the stocks mentioned. The Motley Fool has a disclosure policy.
Recommended Articles


