


Tesla Stock Price Forecast: Earnings Revenue Beats Expectations, Why Did the Stock Price Fall?
TradingKey - As of July 23, Eastern Time, Tesla ( TSLA) shares closed at $319.69, tumbling 14.56% from the previous trading day. According to the financial report, although the company's Q2 results showed a marked improvement in both revenue and delivery figures, the stock price did not receive a sustained boost. This was primarily due to earnings falling short of expectations, compressed automotive gross margins, free cash flow turning negative, and continuing increases in capital expenditures related to AI, Robotaxi, and Optimus.
Tesla Revenue Grows but Profit and Cash Flow Weigh on Stock
According to Tesla's Q2 financial results, the company's revenue reached $28.24 billion, up 26% year-over-year, beating market expectations; Q2 deliveries reached 480,126 vehicles, up 25% year-over-year, which also beat Wall Street expectations. This indicates a recovery in Tesla's vehicle sales, particularly driven by a rebound in European EV demand and lower-priced versions of the Model 3 and Model Y, resulting in a delivery performance that was better than previous market fears.
However, the core pressure on the stock price lies on the profitability side. Tesla's Q2 net income was $1.11 billion, and adjusted EPS was $0.33, below the market expectation of about $0.51. The earnings report shows that while revenue beat expectations, profitability was significantly below investor expectations.
The decline in automotive gross margin is the most direct source of pressure. Tesla's Q2 automotive gross margin was 16.3%, lower than the market expectation of 18.04% compiled by Visible Alpha. Meanwhile, average revenue per vehicle fell from the previous $45,345 to $42,730, indicating that while price cuts and low-priced model strategies drove sales volume, they also squeezed profitability per vehicle. For Tesla, this means that price cuts did indeed boost sales, but at the cost of continued pressure on profit margins.
Negative free cash flow also weighed on market sentiment. Tesla's Q2 capital expenditures reached $5.8 billion, more than doubling both the same period last year and the first quarter, and dragging free cash flow down to negative $1.1 billion; meanwhile, the company expects full-year capital expenditures to exceed $25 billion this year, and capital expenditures could still continue to grow over the next 2–3 years. For a company whose valuation relies highly on its future AI and autonomous driving narrative, negative cash flow will make investors focus more on the return-on-investment cycle.
Can Tesla Stock Still Rise?
Tesla's share price still has upside potential, but making short-term gains is visibly more difficult than in the past. First, the recovery in vehicle deliveries indicates that the core business has not stalled. Deliveries of 480,126 vehicles in the second quarter show that demand remains resilient. If lower-priced versions of Model Y and Model 3 continue to drive sales going forward, Tesla's revenue will remain supported. Second, the energy storage business grew robustly, with deployments of 13.5 GWh showing that demand for grid storage, data center power stability, and renewable energy integration continues to expand, which could become a significant growth driver beyond automotive.
More importantly, the market remains willing to grant Tesla a high valuation, primarily because of FSD, Robotaxi, Cybercab, and Optimus. Both Morgan Stanley and Barclays believe that the improvement in Tesla's automotive business helps support short-term earnings and fund AI investments, but what truly determines Tesla's valuation is still businesses like Robotaxi, FSD, and Optimus. If the rollout of Robotaxi goes smoothly and FSD subscriptions continue to grow, Tesla has an opportunity to pivot from hardware sales to higher-margin software and services revenue. For the stock price, once these businesses are proven to have commercialization capabilities, they will continue to support long-term valuations.
In the short term, however, investors need to pay close attention to three risks. First, whether automotive gross margins can stabilize. If Tesla continues to rely on price cuts to boost sales, the share price may find it difficult to shake off earnings pressure. Second, whether free cash flow can improve. If investments in AI and robotics continue to drive up capital expenditures while the return on investment is slow to materialize, the market may continue to compress the valuation. Third, whether the commercialization pace of Robotaxi and Optimus is sufficiently clear. If management only emphasizes the long-term vision but fails to provide a more concrete path for revenue contribution, the stock's rebound could be limited.
Tesla Stock Price Technical Analysis
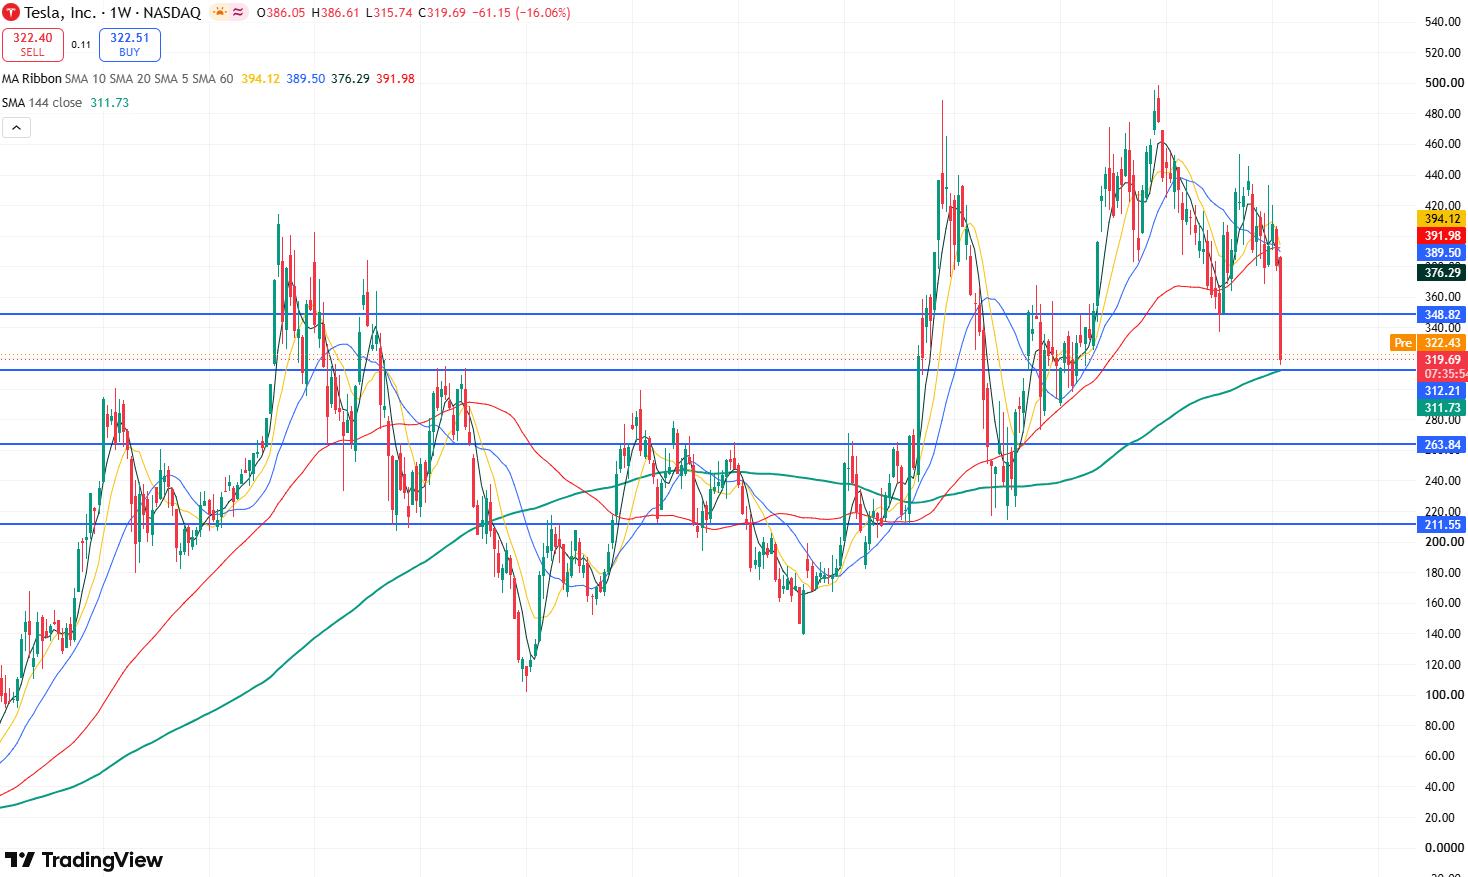
Tesla stock price weekly chart, source: TradingView
Looking at Tesla's weekly chart, the overall candlestick movement presents a structure of higher highs and higher lows, indicating that the overall trend of the stock price remains biased to the upside. However, it is worth noting that the highs of the recent rebounds during the pullback have been gradually decreasing, suggesting that the correction is not yet over, and there is still a possibility of further short-term declines.
Currently, under the impact of the earnings report, the stock price has broken below the key support level of $370 and also fell below the $350 mark, currently dropping to near the SMA144 moving average, which is around $310. If this level fails to hold, the stock price could decline further toward the support level near $260, and may even drop to the support level around $210.
Conversely, if the stock price stops falling and stabilizes above $310, it may usher in a technical recovery and rebound. The primary target of the rebound would be to test the $350 resistance level. If it breaks above this level, the upside room toward the $400 mark will be opened up.
Recommended Articles


