


JPMorgan Warns US Stock Deleveraging Not Yet Over, May Continue to Weigh on Tech Stock Performance in Coming Months
TradingKey - JPMorgan ( JPM )'s global market strategy team warned in its latest report that the deleveraging process initiated by US investors since June is still ongoing, and there is still room for leveraged equity ETFs, options markets, and margin accounts to further reduce risk exposure, which could pose a significant headwind for US and global stock markets in the coming months.
The team, led by strategist Nikolaos Panigirtzoglou, pointed out that the previous rally driven by artificial intelligence and semiconductors attracted a large number of investors using borrowed funds, options, and leveraged ETFs to chase returns. However, as volatility in chip stocks intensified, some highly leveraged positions were forced to liquidate, and the market is undergoing a transition from risk-on expansion to deleveraging.
According to the report, the asset size of leveraged ETFs related to memory chip stocks has decreased by about 34% from its June peak, and the overall asset size of leveraged equity ETFs has declined by about 13%. However, JPMorgan believes that if the market continues to experience high volatility and range-bound trading, it may take about three months for the asset size of related products to return to their normal levels relative to underlying stocks seen before April.
The options market is also signaling a cooling of risk. The call option buying volume by US retail investors once approached 14 million contracts on June 5, close to the cyclical peaks in October 2025 and November 2021, after which technology stocks experienced corrections lasting several months. A decline in call option demand could also reduce stock buying by market makers to hedge risk, thereby weakening a key capital driver for tech stock gains.
In addition, while borrowing in margin accounts has begun to pull back, it remains at historical highs. If stock markets continue to fall, or if equity financing costs rise further, investors may be forced to sell holdings to meet margin calls, thereby amplifying market volatility. Data shows that the scale of repo financing provided by banks for equity trading previously exceeded $220 billion, reflecting the market's high reliance on leveraged funds.
JPMorgan believes that improving corporate earnings and easing inflationary pressures may support major stock indices, but deleveraging pressures mean that the upside for market rebounds may be limited. In the short term, because investor holdings are more concentrated in semiconductors, AI, and high-valuation growth stocks, these sectors are also more sensitive to the withdrawal of leveraged funds. Consequently, US stocks may continue to exhibit a pattern of high-level index consolidation and intensified sector volatility in the coming months.
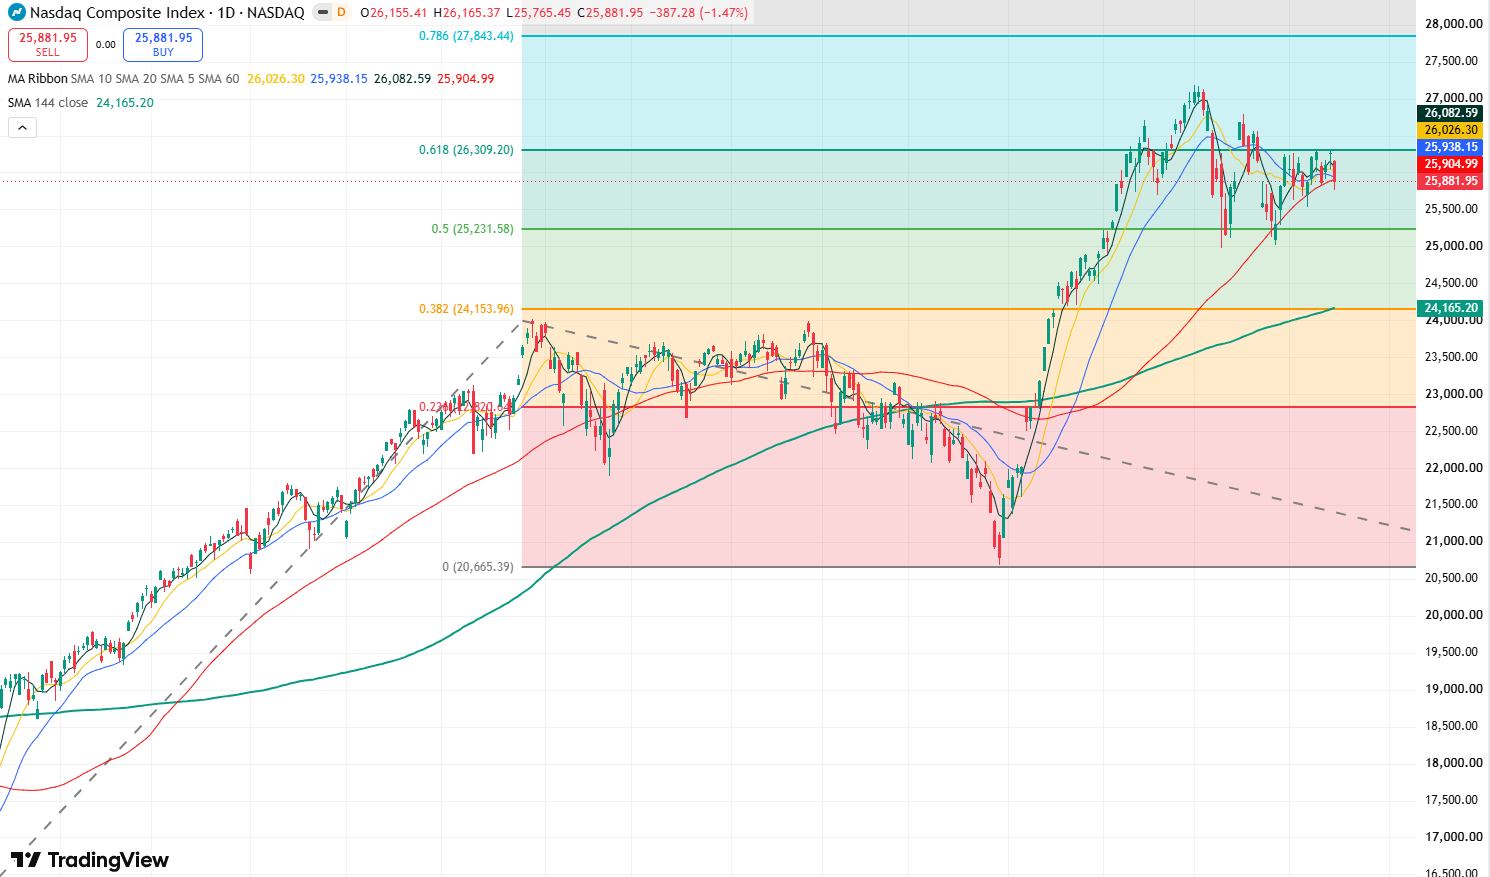
Nasdaq Index Daily Chart, Source: TradingView
Looking at the daily chart of the Nasdaq Index, after hitting an all-time high of 27,190 in June, the Nasdaq Index has recently continued to correct. Although there were rebounds during this period, the highs of these rebounds have been gradually decreasing, indicating weakening bullish momentum in the market. Meanwhile, since July, the Nasdaq Index has been under pressure below the 26,300 resistance level, failing multiple times to break upward, which has further weakened the market's bullish momentum.
Currently, the Nasdaq may continue to test the support of the 25,000 level downward. If this position is lost, the Nasdaq may pull back further toward the 24,150 support level.
Recommended Articles


