


AppLovin vs. Fastly: A Look at Recent Revenue Trends for These Tech Companies
Key Points
AppLovin currently demonstrates significantly stronger revenue performance, consistently reporting top-line figures well above Fastly while maintaining a clearer trajectory of upward expansion.
Over the last eight quarters, AppLovin has experienced substantial quarter-over-quarter revenue expansion, while Fastly has maintained a much slower, more stable growth trend without major fluctuations.
Investors should watch whether the revenue gap between the two companies continues to widen rapidly or if the growth rate begins to moderate in upcoming quarters.
- 10 stocks we like better than AppLovin ›
AppLovin: Rapid Revenue Expansion
AppLovin (NASDAQ:APP) provides specialized software infrastructure designed to help mobile application developers market their creations efficiently, optimize their ad campaigns, and generate consistent advertising income worldwide.
It launched a new social networking application called Gist alongside ongoing regulatory inquiries, and reported a net income margin of 65% for the quarter ended March 31, 2026.
Fastly: Gradual Revenue Increases
Fastly (NASDAQ:FSLY) offers an advanced edge cloud computing infrastructure designed to efficiently manage, distribute, and secure digital applications for a wide array of clients across global markets.
It launched a new data center facility in West Florida while addressing a performance incident in Tokyo, and recorded a net income margin of -12% for the quarter ended March 31, 2026.
Why Revenue Matters for Retail Investors
Revenue serves as the fundamental measure of total sales and indicates a business's ability to attract paying customers before operating expenses are deducted.
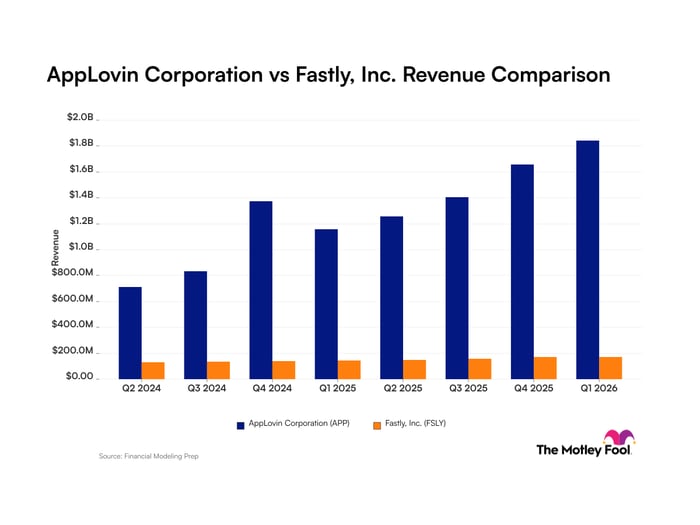
Quarterly Revenue for AppLovin and Fastly
| Quarter (Period End) | AppLovin Revenue | Fastly Revenue |
|---|---|---|
| Q2 2024 (June 2024) | $711.0 million | $132.4 million |
| Q3 2024 (Sept. 2024) | $835.2 million | $137.2 million |
| Q4 2024 (Dec. 2024) | $1.4 billion | $140.6 million |
| Q1 2025 (March 2025) | $1.2 billion | $144.5 million |
| Q2 2025 (June 2025) | $1.3 billion | $148.7 million |
| Q3 2025 (Sept. 2025) | $1.4 billion | $158.2 million |
| Q4 2025 (Dec. 2025) | $1.7 billion | $172.6 million |
| Q1 2026 (March 2026) | $1.8 billion | $173.0 million |
Data source: Company filings. Data as of July 10, 2026.
Foolish Take
In comparing the revenue trends for AppLovin and Fastly, the former is clearly a beast. Its sales rose every quarter in 2025, and in the first quarter of 2026, its revenue skyrocketed a whopping 59% year over year.
Meanwhile, Fastly’s Q1 sales represented excellent year-over-year growth of 20%. However, its stock fell in May after it forecasted 2026 sales to come in between $710 million to $725 million.
If Fastly reached the top of that range, it would be about a 16% year-over-year increase over 2025 revenue of $624 million. That growth did not impress Wall Street, leading to a stock sell-off.
AppLovin expects its Q2 sales to continue the trend of quarter-over-quarter increases, forecasting about $1.9 billion. The company’s incredible revenue expansion demonstrates the lucrative nature of the mobile advertising market.
Consequently, AppLovin stock trades at a very high valuation versus Fastly. At a price-to-sales ratio of 28, AppLovin is expensive compared to Fastly’s sales multiple of four. While Fastly isn’t the fast one when it comes to revenue growth, its slow and steady expansion through high-margin products enabled the company to achieve record first-quarter gross margin of 62.5%.
Should you buy stock in AppLovin right now?
Before you buy stock in AppLovin, consider this:
The Motley Fool Stock Advisor analyst team just identified what they believe are the 10 best stocks for investors to buy now… and AppLovin wasn’t one of them. The 10 stocks that made the cut could produce monster returns in the coming years.
Consider when Netflix made this list on December 17, 2004... if you invested $1,000 at the time of our recommendation, you’d have $395,679!* Or when Nvidia made this list on April 15, 2005... if you invested $1,000 at the time of our recommendation, you’d have $1,294,805!*
Now, it’s worth noting Stock Advisor’s total average return is 929% — a market-crushing outperformance compared to 211% for the S&P 500. Don't miss the latest top 10 list, available with Stock Advisor, and join an investing community built by individual investors for individual investors.
See the 10 stocks »
*Stock Advisor returns as of July 11, 2026.
Robert Izquierdo has no position in any of the stocks mentioned. The Motley Fool has positions in and recommends Fastly. The Motley Fool has a disclosure policy.
Recommended Articles


