


The Stock Market Just Finished Its Best Quarter in Years. Here's What History Says Is Coming Next.
Key Points
The S&P 500 is on pace for its fourth consecutive year of double-digit gains.
Favorable earnings growth expectations and reasonable valuations could support stock prices in the near term.
Long-term investors should remain on course and focus on the "hold" in "buy and hold."
- 10 stocks we like better than S&P 500 Index ›
The S&P 500 (SNPINDEX: ^GSPC) was up nearly 15% in the second quarter of 2026, its best performance since the COVID-19 rebound in 2020. After an up-and-down first quarter, the S&P 500 was up roughly 10% for the entire first half, putting it on pace for its fourth consecutive year of double-digit gains.
History shows those kinds of streaks are rare. Most notably, the S&P 500 put up five consecutive double-digit-return years from 1995 to 1999. Of course, most people know that streak ended with the tech bubble bursting and resulted in three consecutive years of negative double-digit returns.
Missed Nvidia in 2009? This Rare Signal Is Flashing Again. In 2009, a "Double Down" signal flashed for a little-known chipmaker called Nvidia. For the first time in years, that same "Total Conviction" signal is flashing for a company 1/100th the size of Nvidia. Continue »
Naturally, there's some skepticism about how long these kinds of returns can last. The artificial intelligence (AI) boom is still driving revenue and earnings growth, but high inflation, slowing growth, possible Federal Reserve rate hikes, and the geopolitical environment are all current risks.

Image source: Getty Images.
Earnings growth will be the driver in the short term
Current FactSet estimates call for 24% earnings growth in 2026 and another 17% in 2027. While anything can certainly happen, it's difficult to imagine stock prices correcting significantly with that kind of earnings growth in the background.
It might be another story if valuations were excessive. The Shiller CAPE ratio, which measures stock prices against 10-year inflation-adjusted earnings, is near an all-time high. But the forward price-to-earnings (P/E) ratio for the Vanguard S&P 500 ETF (NYSEMKT: VOO) is only around 23. That's higher than its long-term average, but below its 2024 and 2025 peaks.
With earnings growing strongly and valuations at reasonable levels, it's easy to make the case that stock prices could keep pushing higher.
Long-term investors should remain undeterred
Even if short-term conditions were more challenging, long-term investors should stay the course. The S&P 500 has averaged a 10% annual return over the past century. Any given year can be up or down, but history shows that a longer holding period generally translates to a greater chance of success.
Here's a good example. Over the past decade, the Vanguard S&P 500 ETF delivered an average annual return of more than 15%. That decade happened to include a 20% correction in late 2018, a sharp drawdown of more than 30% during the beginning of the COVID pandemic, and the 2022 bear market, which sent stocks down by roughly 24%.
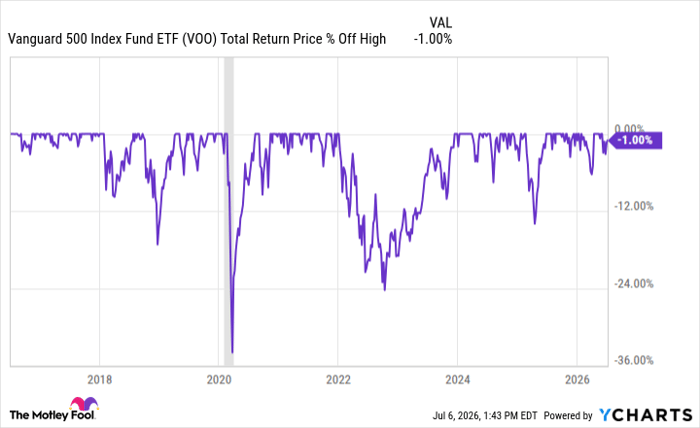
VOO Total Return Price data by YCharts
Yet despite all of this, investors were rewarded with above-average returns for the full holding period, if they remained invested throughout.
That's the key. Buy-and-hold investing requires holding even in rough market conditions. Many of folks head for the exits after stock prices have already declined, only to miss the subsequent rebound. In many cases, investors damage their own long-term returns more than the stock market ever did just by trying to time the market.
Even after such a strong bull-market rally that's still alive, the future looks bright for those willing to stay the course.
Should you buy stock in S&P 500 Index right now?
Before you buy stock in S&P 500 Index, consider this:
The Motley Fool Stock Advisor analyst team just identified what they believe are the 10 best stocks for investors to buy now… and S&P 500 Index wasn’t one of them. The 10 stocks that made the cut could produce monster returns in the coming years.
Consider when Netflix made this list on December 17, 2004... if you invested $1,000 at the time of our recommendation, you’d have $418,761!* Or when Nvidia made this list on April 15, 2005... if you invested $1,000 at the time of our recommendation, you’d have $1,195,804!*
Now, it’s worth noting Stock Advisor’s total average return is 918% — a market-crushing outperformance compared to 208% for the S&P 500. Don't miss the latest top 10 list, available with Stock Advisor, and join an investing community built by individual investors for individual investors.
See the 10 stocks »
*Stock Advisor returns as of July 7, 2026.
David Dierking has no position in any of the stocks mentioned. The Motley Fool has positions in and recommends Vanguard S&P 500 ETF. The Motley Fool has a disclosure policy.
Recommended Articles


