

IWO vs. IWM: What's the Best Way to Buy Small-Cap Stocks?
Key Points
Small-cap stocks are beating the S&P 500 and the Nasdaq-100 over the past year.
The iShares Russell 2000 ETF has gained 22.1% year to date.
The iShares Russell 2000 Growth ETF offers a more targeted portfolio of high-potential small-cap stocks but could be too volatile.
- 10 stocks we like better than iShares Trust - iShares Russell 2000 ETF ›
Small-cap stocks are booming in 2026. In the past year, the Russell 2000 index of U.S. small-cap stocks has gained about 41%, strongly outperforming the S&P 500 (SNPINDEX: ^GSPC) and the tech-heavy Nasdaq-100. If the artificial intelligence (AI) boom leads to widespread productivity gains throughout the economy, smaller companies could keep growing for years to come.
Where to invest $1,000 right now? Our analyst team just revealed what they believe are the 10 best stocks to buy right now, when you join Stock Advisor. See the stocks »
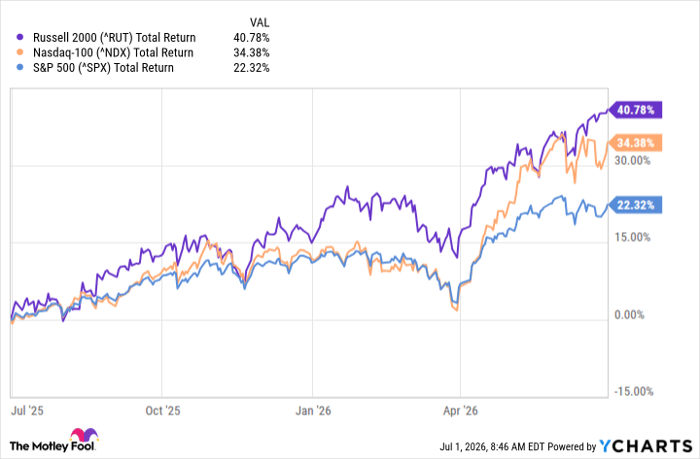
^RUT data by YCharts
But what's the best way to buy small-cap stocks? Some investors might prefer to buy a broad low-cost index fund that tracks the Russell 2000, such as the iShares Russell 2000 ETF (NYSEMKT: IWM). This small-cap ETF gained 22.1% in the first half of 2026.
Or if you want to focus more on small-cap stocks with the strongest growth potential (and possibly higher volatility), the iShares Russell 2000 Growth ETF (NYSEMKT: IWO) offers a targeted portfolio of those up-and-coming companies. It gained just under 22% through June 30 but has outperformed the broader iShares ETF over the past 10 years.
Let's look at these two small-cap ETFs and see which one could be the better buy for your investment goals.

Image source: Getty Images.
iShares Russell 2000 ETF: 2,021 stocks, 26 years of 8.9% annualized returns
The iShares Russell 2000 ETF is just what the name sounds like: an index fund that lets you track the performance of the entire Russell 2000. It holds 2,021 stocks and charges an expense ratio of 0.19%.
The fund's portfolio is less tech-heavy than S&P 500 ETFs. Its top holdings by sector include healthcare (20.02% of the fund), financials (18.96%), and industrials (15%), with information technology at 13.86%.
In the past 26 years, since this small-cap ETF was established in May 2000, it has delivered average annual returns of 8.9% (reinvesting dividends). That's lower than the S&P 500 index's long-term average annual return of 10%. But more recently, small-cap stocks have been surging. Over the past year, this fund has delivered a total return of 40.7%.
No one knows if small-cap stocks will beat the S&P 500 or underperform in the future. But if you believe small-cap stocks are likely to continue their recent gains compared to larger companies, this iShares ETF makes it easy and affordable to buy the entire Russell 2000.
iShares Russell 2000 Growth ETF: 1,139 stocks, nearly 26 years of 7.3% annualized returns
The iShares Russell 2000 Growth ETF also lets you invest in a broad mix of small-cap stocks, but with a slightly more targeted portfolio than the other fund. This growth stock ETF holds a total of 1,139 stocks selected based on their sales growth and growth forecasts. It charges a slightly higher expense ratio of 0.24%.
Compared to the iShares Russell 2000 ETF, this growth-focused fund allocates more to small-cap tech stocks. Information technology accounts for 20.01% of the portfolio, the second-largest sector holding. Other top sectors include healthcare (28.6%), industrials (17.4%), and financials (9.5%).
In the past year, as small-cap stocks have risen, this growth stock ETF has delivered a total return of 38.5%, strongly outperforming the S&P 500.
But if you look at the longer-term track record, the picture is less pretty. This fund was established in July 2000, and for the past 26 years, it's delivered average annual returns of 7.3% on a total return basis. That's a lower return than the broader iShares Russell 2000 ETF and the S&P 500.
Along with the lower long-term returns, this growth ETF could be more volatile. At recent prices, it had a higher beta coefficient of 1.46 versus the S&P 500, compared to 1.30 for the other Russell 2000 ETF. That means this growth stock ETF might rise or fall much more than the rest of the stock market.
Why buy IWM vs. IWO?
I don't own either of these small-cap funds. But if I had to choose, I would buy the iShares Russell 2000 ETF (IWM). It's more diversified, with over 2,000 stocks. The growth-focused ETF is unlikely to outperform the broader Russell 2000 index over the long term.
Buying small-cap stocks (instead of the broader S&P 500 index) already involves taking a risk and staking a position. You're already making a bet that smaller companies will outperform larger ones. Buying a fund that tries to to choose the best small-cap growth stocks within that bet is an added layer of complexity and risk.
These small-cap ETFs also sell stocks of companies that grow to be too big to be included within their index, so they tend to not earn the same benefits of long-term growth as the S&P 500 itself. This could be another reason why these small-cap funds have tended to underperform large-caps over the long run.
But in the future, small-cap stocks might keep beating the market. If that happens, I'd rather own all of the small-caps, not just a more narrow portfolio that might disappoint. The iShares Russell 2000 ETF is a better choice for that goal -- and it's on the list of best small-cap ETFs.
Should you buy stock in iShares Trust - iShares Russell 2000 ETF right now?
Before you buy stock in iShares Trust - iShares Russell 2000 ETF, consider this:
The Motley Fool Stock Advisor analyst team just identified what they believe are the 10 best stocks for investors to buy now… and iShares Trust - iShares Russell 2000 ETF wasn’t one of them. The 10 stocks that made the cut could produce monster returns in the coming years.
Consider when Netflix made this list on December 17, 2004... if you invested $1,000 at the time of our recommendation, you’d have $400,101!* Or when Nvidia made this list on April 15, 2005... if you invested $1,000 at the time of our recommendation, you’d have $1,212,683!*
Now, it’s worth noting Stock Advisor’s total average return is 911% — a market-crushing outperformance compared to 208% for the S&P 500. Don't miss the latest top 10 list, available with Stock Advisor, and join an investing community built by individual investors for individual investors.
See the 10 stocks »
*Stock Advisor returns as of July 2, 2026.
Ben Gran has no position in any of the stocks mentioned. The Motley Fool has no position in any of the stocks mentioned. The Motley Fool has a disclosure policy.
Recommended Articles


