

Gold surges as weak US NFP knocks US Dollar
- US NFP misses estimates, with prior months receiving sharp downward revisions.
- US Dollar slides as markets cut September Fed hike odds.
- Fed Warsh and Daly keep inflation risks firmly in focus.
Gold (XAU/USD) price soars over 2% on Thursday after the latest US employment report reduced the chances of a Federal Reserve (Fed) rate hike and pushed the US Dollar (USD) and US Treasury yields lower. The XAU/USD pair trades at $4,111 after bouncing off daily lows of $4,032.
Bullion rallies as weak jobs data trims Fed hike bets
The US Bureau of Labor Statistics (BLS) released June’s employment report, with Nonfarm Payrolls falling short of estimates of 110K, coming at 57K. Additionally, the May and April figures were downwardly revised, the former from 172K to 129K and the latter from 179K to 148K. At the same time, the Unemployment Rate edged lower from 4.3% to 4.2%, attributed to a slide in labor force participation,
The Greenback extended its losses during the day, with the US Dollar Index (DXY), which tracks the performance of the buck’s value against six currencies, down 0.55% to 100.85.
US Treasury yields also felt the pain, as investors trimmed hawkish bets on the Federal Reserve. The US 10-year benchmark note yields 4.483%, flat after erasing some of its previous losses.
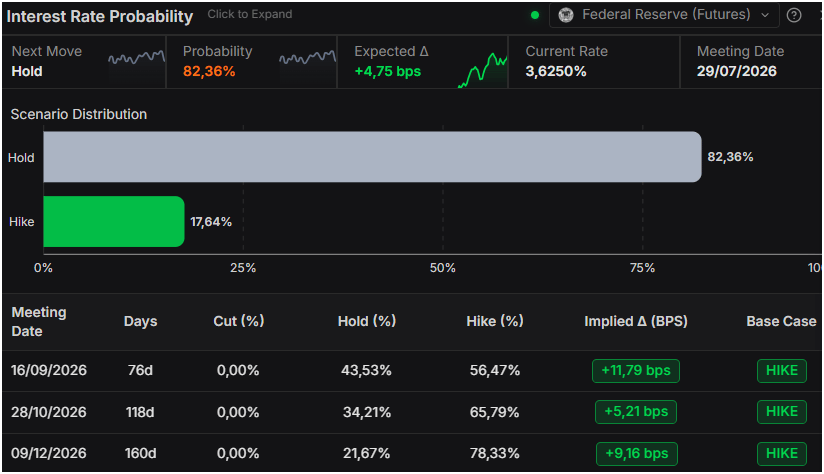
Nevertheless, money markets are still pricing in a 66% chance of a rate hike at the September 16 meeting, with investors expecting nearly 17 basis points of tightening, according to Prime Terminal data
Meanwhile, Federal Reserve officials crossed the wires. San Francisco Fed's Mary Daly sees positive signs in the US economy and notes higher prices due to tariffs and Oil shocks. She says the policy is “slightly restrictive" but acknowledges scenarios where the Fed must fight inflation.
On Wednesday, Fed Chair Kevin Warsh commented that inflation expectations had ticked lower over the last four weeks, though he reiterated that the central bank’s focus is “price stability.”
In the Middle East, conversations between the US and Iran concluded with no meaningful progress.
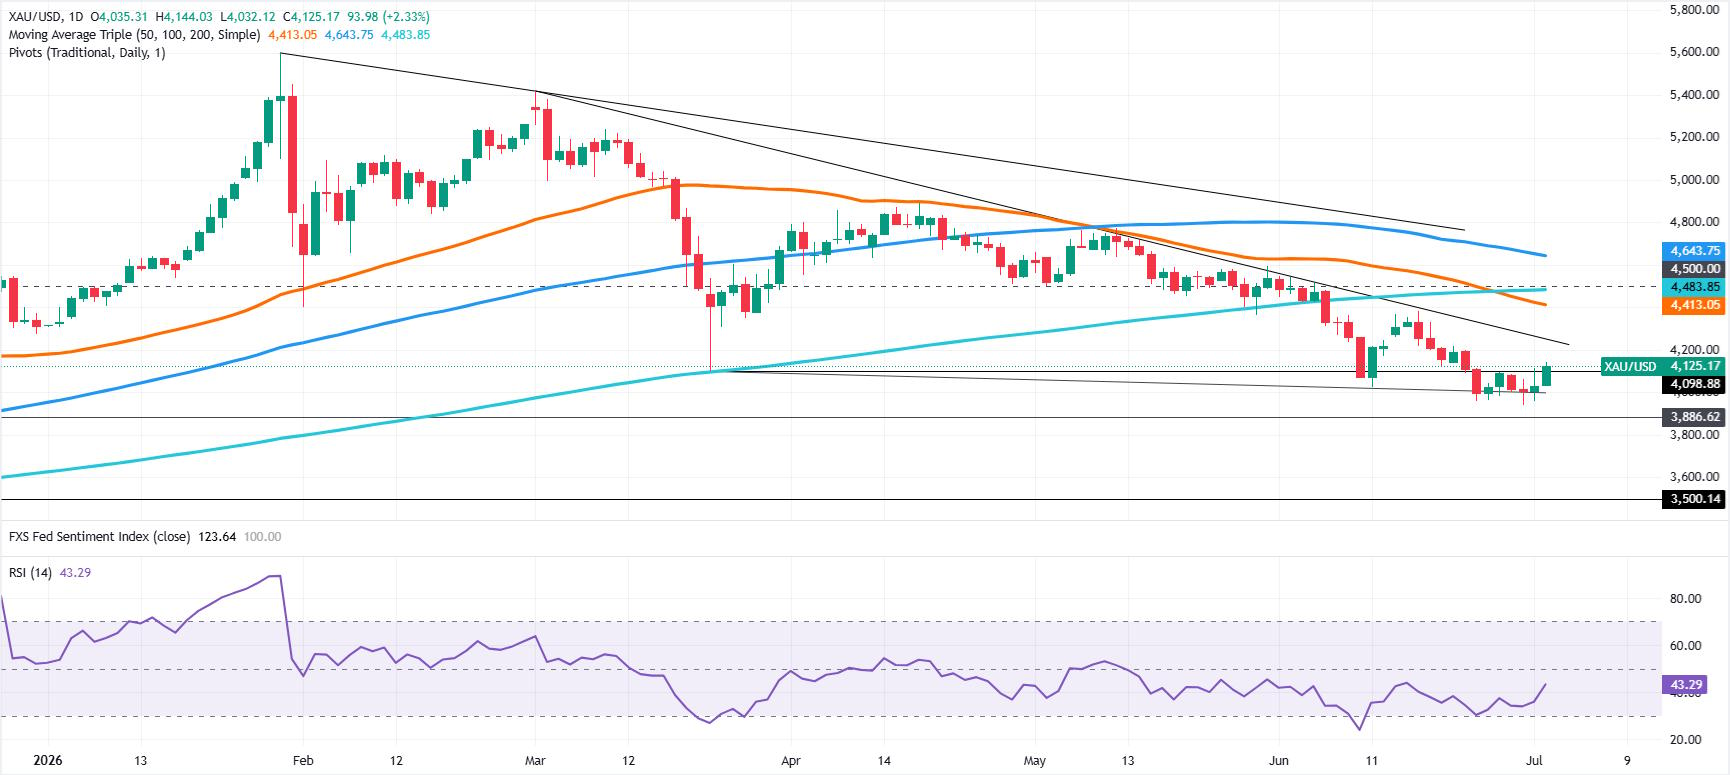
XAU/USD technical outlook: Gold trades above/below the $4,100 mark
Gold price appears to have formed a double bottom chart pattern, confirmed by a break to new seven-day highs of $4,144, clearing the previous higher high of $4,096, reached on June 26.
The Relative Strength Index (RSI) shows buyers gaining momentum as the slope turned upwards from around 35 towards 43.
If XAU/USD finishes Thursday’s session above $4,100, the yellow metal could be poised to test higher prices. However, the overall trend remains downwards, unless Gold reclaims the 200-day Simple Moving Average (SMA) at $4,483.
If Gold clears $4,150, the next area of interest will become $4,200, followed by a downslope resistance trendline at around $4,250-$4,275. Above this area lies the psychological $4,300 mark.
On the flip side, if XAU tumbles below $4,100, expect a retest of the day's low at $4,032, ahead of a challenge of $4,000. Below this area sits the yearly low of $3,941 hit on June 30.
Gold FAQs
Gold has played a key role in human’s history as it has been widely used as a store of value and medium of exchange. Currently, apart from its shine and usage for jewelry, the precious metal is widely seen as a safe-haven asset, meaning that it is considered a good investment during turbulent times. Gold is also widely seen as a hedge against inflation and against depreciating currencies as it doesn’t rely on any specific issuer or government.
Central banks are the biggest Gold holders. In their aim to support their currencies in turbulent times, central banks tend to diversify their reserves and buy Gold to improve the perceived strength of the economy and the currency. High Gold reserves can be a source of trust for a country’s solvency. Central banks added 1,136 tonnes of Gold worth around $70 billion to their reserves in 2022, according to data from the World Gold Council. This is the highest yearly purchase since records began. Central banks from emerging economies such as China, India and Turkey are quickly increasing their Gold reserves.
Gold has an inverse correlation with the US Dollar and US Treasuries, which are both major reserve and safe-haven assets. When the Dollar depreciates, Gold tends to rise, enabling investors and central banks to diversify their assets in turbulent times. Gold is also inversely correlated with risk assets. A rally in the stock market tends to weaken Gold price, while sell-offs in riskier markets tend to favor the precious metal.
The price can move due to a wide range of factors. Geopolitical instability or fears of a deep recession can quickly make Gold price escalate due to its safe-haven status. As a yield-less asset, Gold tends to rise with lower interest rates, while higher cost of money usually weighs down on the yellow metal. Still, most moves depend on how the US Dollar (USD) behaves as the asset is priced in dollars (XAU/USD). A strong Dollar tends to keep the price of Gold controlled, whereas a weaker Dollar is likely to push Gold prices up.
Recommended Articles


