


Trump declares retaliation against Iran automatic in Truth Social post
Donald Trump opened the week on Truth Social with a promise that every American soldier killed by Iran will be repaid many times over, a directive he says has been passed to Secretary of War Pete Hegseth, Joint Chiefs of Staff Chairman Daniel Caine, and every leader in the military. The post lands after a weekend that saw three American service members killed in Iranian attacks on bases in Jordan and Iraq, a ninth straight night of US strikes, and Tehran suspending its commitments to last month's interim deal. The shift matters because retaliation is no longer a decision to be taken but standing policy pre-delegated down the chain of command, removing the deliberation window every previous de-escalation has crawled through.
Trump on Truth Social: "Every time Iran kills an American Soldier they will pay for that killing many times over! This directive has been passed on to Secretary of War, Pete Hegseth, Chairman of the Joint Chiefs of Staff, Daniel Caine, and every Leader in the Military. President DONALD J. TRUMP"
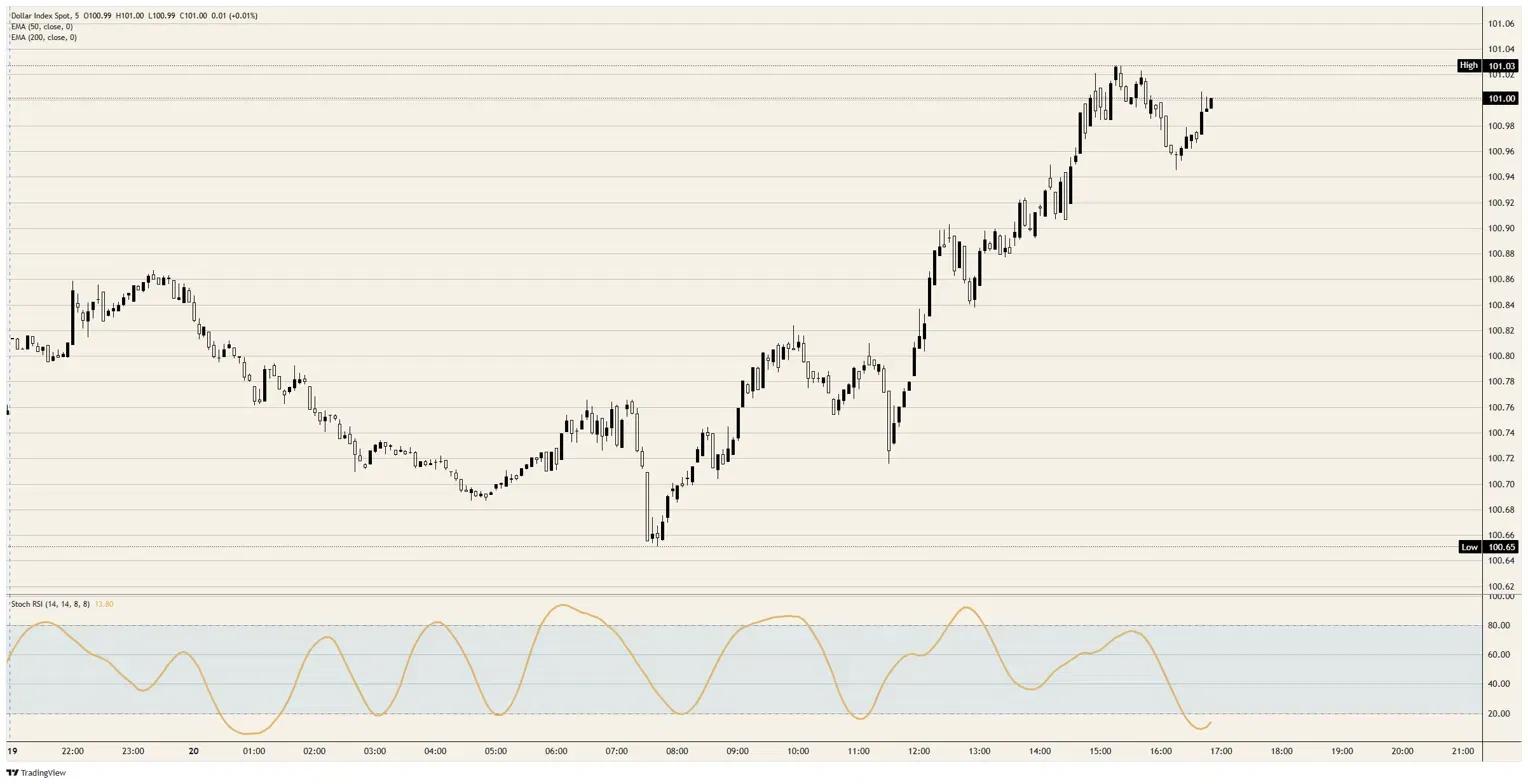
Markets went into the weekend still leaning on pattern recognition, pricing a fourth patched-together truce because the first three always produced one, and that unearned calm is what this post punctures. With Tehran suspending the interim deal and retaliation now pre-authorised, there is no framework left to break, only a trigger waiting to be pulled. The US Dollar Index is trading the repricing live, bid from the European morning onward and pressing the 101.00 handle, roughly 0.4% off the overnight floor. With a reclosed Strait of Hormuz keeping Crude Oil and rate pricing pointed the wrong way for risk, the lean stays with the Dollar.
US Dollar Index 5-minute chart
US Dollar FAQs
The US Dollar (USD) is the official currency of the United States of America, and the ‘de facto’ currency of a significant number of other countries where it is found in circulation alongside local notes. It is the most heavily traded currency in the world, accounting for over 88% of all global foreign exchange turnover, or an average of $6.6 trillion in transactions per day, according to data from 2022. Following the second world war, the USD took over from the British Pound as the world’s reserve currency. For most of its history, the US Dollar was backed by Gold, until the Bretton Woods Agreement in 1971 when the Gold Standard went away.
The most important single factor impacting on the value of the US Dollar is monetary policy, which is shaped by the Federal Reserve (Fed). The Fed has two mandates: to achieve price stability (control inflation) and foster full employment. Its primary tool to achieve these two goals is by adjusting interest rates. When prices are rising too quickly and inflation is above the Fed’s 2% target, the Fed will raise rates, which helps the USD value. When inflation falls below 2% or the Unemployment Rate is too high, the Fed may lower interest rates, which weighs on the Greenback.
In extreme situations, the Federal Reserve can also print more Dollars and enact quantitative easing (QE). QE is the process by which the Fed substantially increases the flow of credit in a stuck financial system. It is a non-standard policy measure used when credit has dried up because banks will not lend to each other (out of the fear of counterparty default). It is a last resort when simply lowering interest rates is unlikely to achieve the necessary result. It was the Fed’s weapon of choice to combat the credit crunch that occurred during the Great Financial Crisis in 2008. It involves the Fed printing more Dollars and using them to buy US government bonds predominantly from financial institutions. QE usually leads to a weaker US Dollar.
Quantitative tightening (QT) is the reverse process whereby the Federal Reserve stops buying bonds from financial institutions and does not reinvest the principal from the bonds it holds maturing in new purchases. It is usually positive for the US Dollar.
Recommended Articles


