


US Dollar Index Price Forecast: keeps the Bullish bias intact above 101.00
- The US Dollar retraces previous losses and approaches session highs at 101.20.
- Safe-haven demand amid growing tensions in Iran and higher Oil prices keeps buoying the USD. markets.
- Recent price action suggests a bullish flag formation.
The US Dollar Index (DXY) shows moderate losses on Wednesday but has retraced most of the decline seen during the Asian trading session. The DXY, which measures the value of the Greenback against a basket of six peers, remains steady above 101.00, consolidating gains after a 0.7% rally in the last four days.
The Greenback is drawing support from rising demand for safe havens, as the Middle East conflict escalates and Oil prices rally, bringing the global economy to the brink of recession. US military attacked Iran for the 11th consecutive day, and Reuters reported that three Saudi vessels turned around in the Red Sea, adding to evidence that the Houthis have blocked another key corridor for Gulf Oil supply.
Technical Analysis: Potential Bullish Flag formation
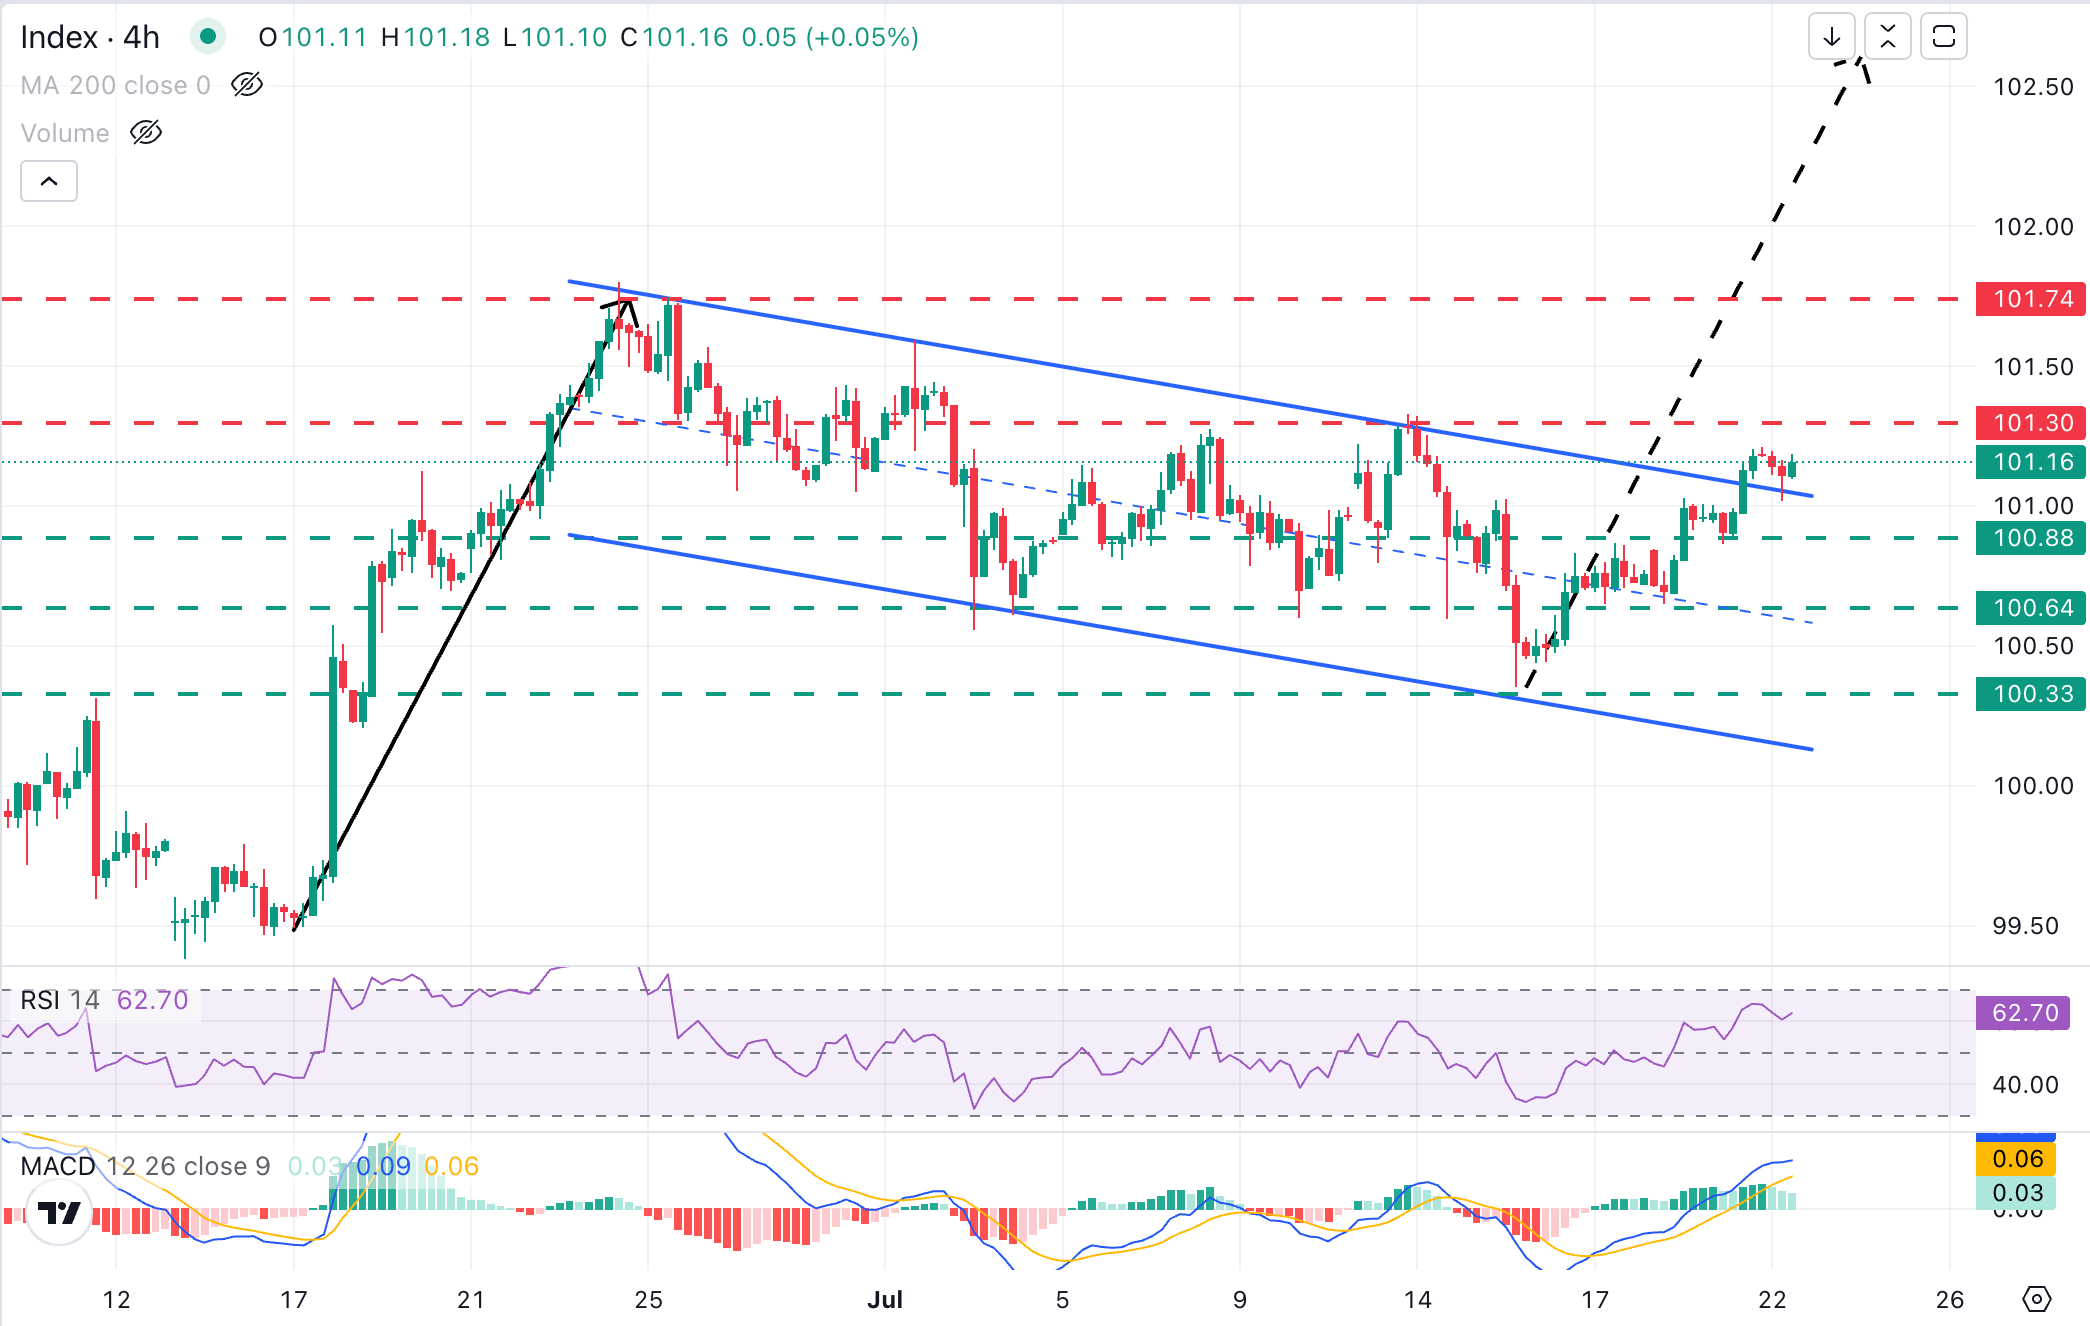
Dollar Index Spot trades at 101.17, holding above the top of the downtrend channel from late June highs, and highlighting a potential Bullish Flag formation. Momentum indicators back the constructive scenario, as the 4-hour Relative Strength Index (14) advances beyond 60, and the Moving Average Convergence Divergence (MACD) stays in positive territory.
The pair remains capped a few pips below the July 8 and 15 highs in the 101.30 area, which, so far, are closing the path towards the year-to-date high, in the 101.75 area. The Bullish Flag's measured target is at the 102.50 area, which caps further gains for now.
Downside attempts, on the other hand, remain contained above the reverse trendline, now at the 101.00 area. A confirmation below here would shift the focus towards Tuesday's low at the 100.90 area and the weekly lows at 100.65.
(The technical analysis of this story was written with the help of an AI tool. Know more.)
US Dollar FAQs
The US Dollar (USD) is the official currency of the United States of America, and the ‘de facto’ currency of a significant number of other countries where it is found in circulation alongside local notes. It is the most heavily traded currency in the world, accounting for over 88% of all global foreign exchange turnover, or an average of $6.6 trillion in transactions per day, according to data from 2022. Following the second world war, the USD took over from the British Pound as the world’s reserve currency. For most of its history, the US Dollar was backed by Gold, until the Bretton Woods Agreement in 1971 when the Gold Standard went away.
The most important single factor impacting on the value of the US Dollar is monetary policy, which is shaped by the Federal Reserve (Fed). The Fed has two mandates: to achieve price stability (control inflation) and foster full employment. Its primary tool to achieve these two goals is by adjusting interest rates. When prices are rising too quickly and inflation is above the Fed’s 2% target, the Fed will raise rates, which helps the USD value. When inflation falls below 2% or the Unemployment Rate is too high, the Fed may lower interest rates, which weighs on the Greenback.
In extreme situations, the Federal Reserve can also print more Dollars and enact quantitative easing (QE). QE is the process by which the Fed substantially increases the flow of credit in a stuck financial system. It is a non-standard policy measure used when credit has dried up because banks will not lend to each other (out of the fear of counterparty default). It is a last resort when simply lowering interest rates is unlikely to achieve the necessary result. It was the Fed’s weapon of choice to combat the credit crunch that occurred during the Great Financial Crisis in 2008. It involves the Fed printing more Dollars and using them to buy US government bonds predominantly from financial institutions. QE usually leads to a weaker US Dollar.
Quantitative tightening (QT) is the reverse process whereby the Federal Reserve stops buying bonds from financial institutions and does not reinvest the principal from the bonds it holds maturing in new purchases. It is usually positive for the US Dollar.
Recommended Articles


