


Solana Price Forecast: SOL consolidates as ETF inflows and on-chain activity rise
- Solana extends its consolidation near $100 on Tuesday, trading between two converging trendlines that form a triangle pattern.
- SOL-focused ETFs recorded $11 million in inflows on Monday, following $10 million in inflows last week.
- On-chain data shows an increase in network usage last week, with revenue, REV, and transaction activity rising.
Solana (SOL) edges lower on Tuesday, following a 3% rise to start the week, extending its consolidation around the $100 psychological mark. Institutional confidence holds firm in the layer-1 blockchain, with $11 million in inflows on Monday, showing signs of increased risk appetite ahead of the CLARITY Act cloture vote scheduled for Tuesday.
On the network side, transaction activity is increasing, driving up network revenue and its real economic value as transaction sizes increase.
Network upgrade fuels user activity
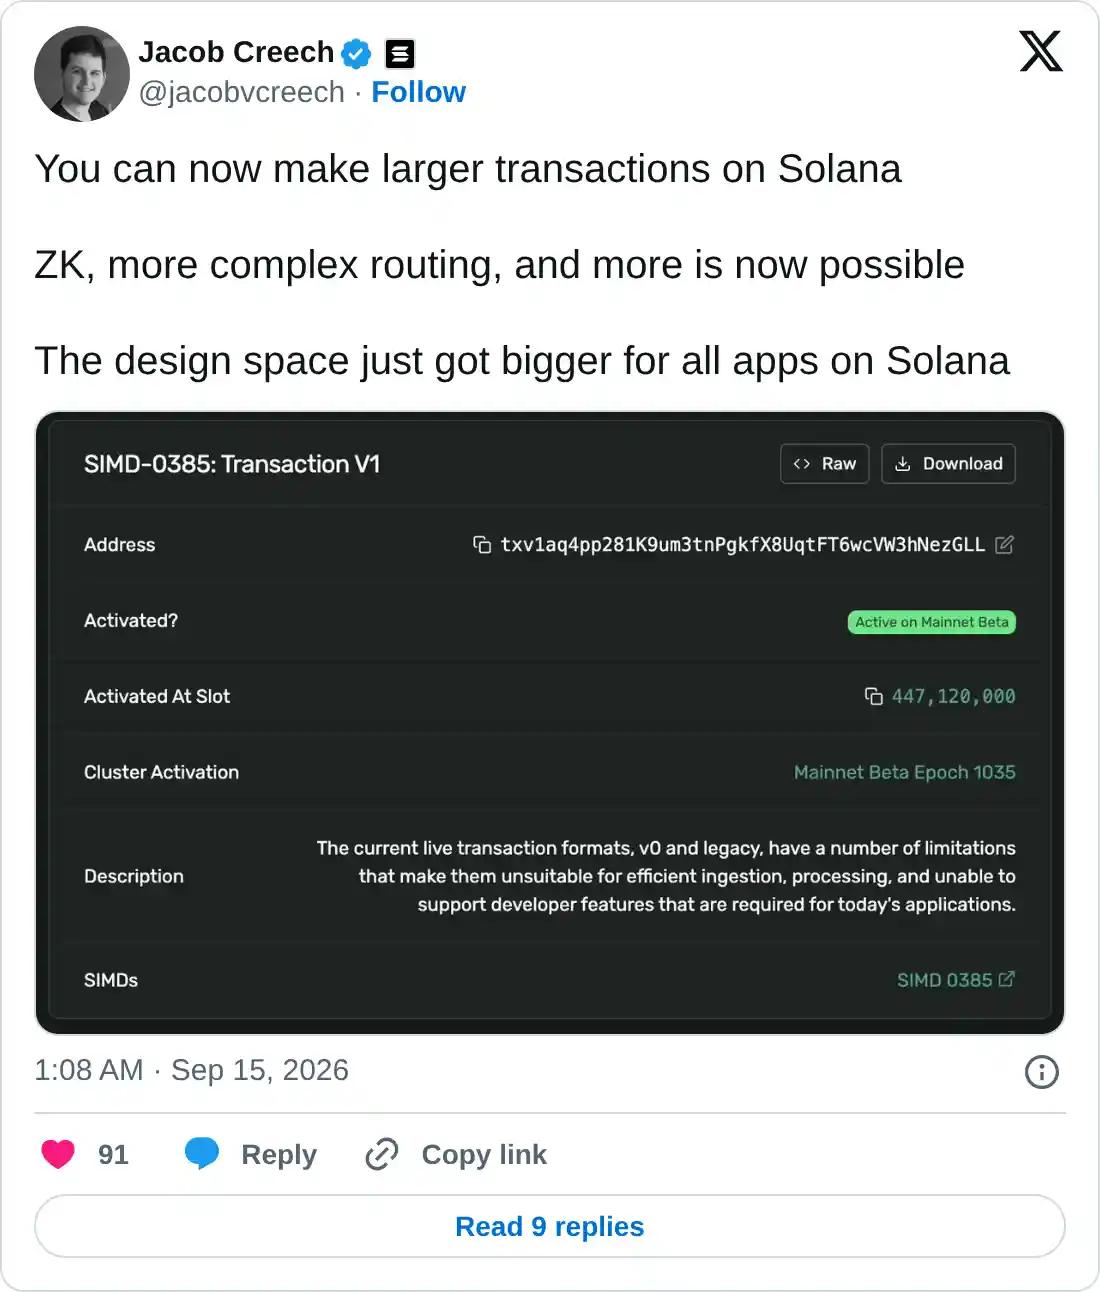
Solana’s recent SIMD-0385 upgrade introduced Transaction V1, enabling larger transaction sizes up to 4,096 bytes. This opens the door for zero-knowledge to enable privacy features and more complex routing, said Jacob Creech, VP Tech at Solana Foundation, in a social media post.
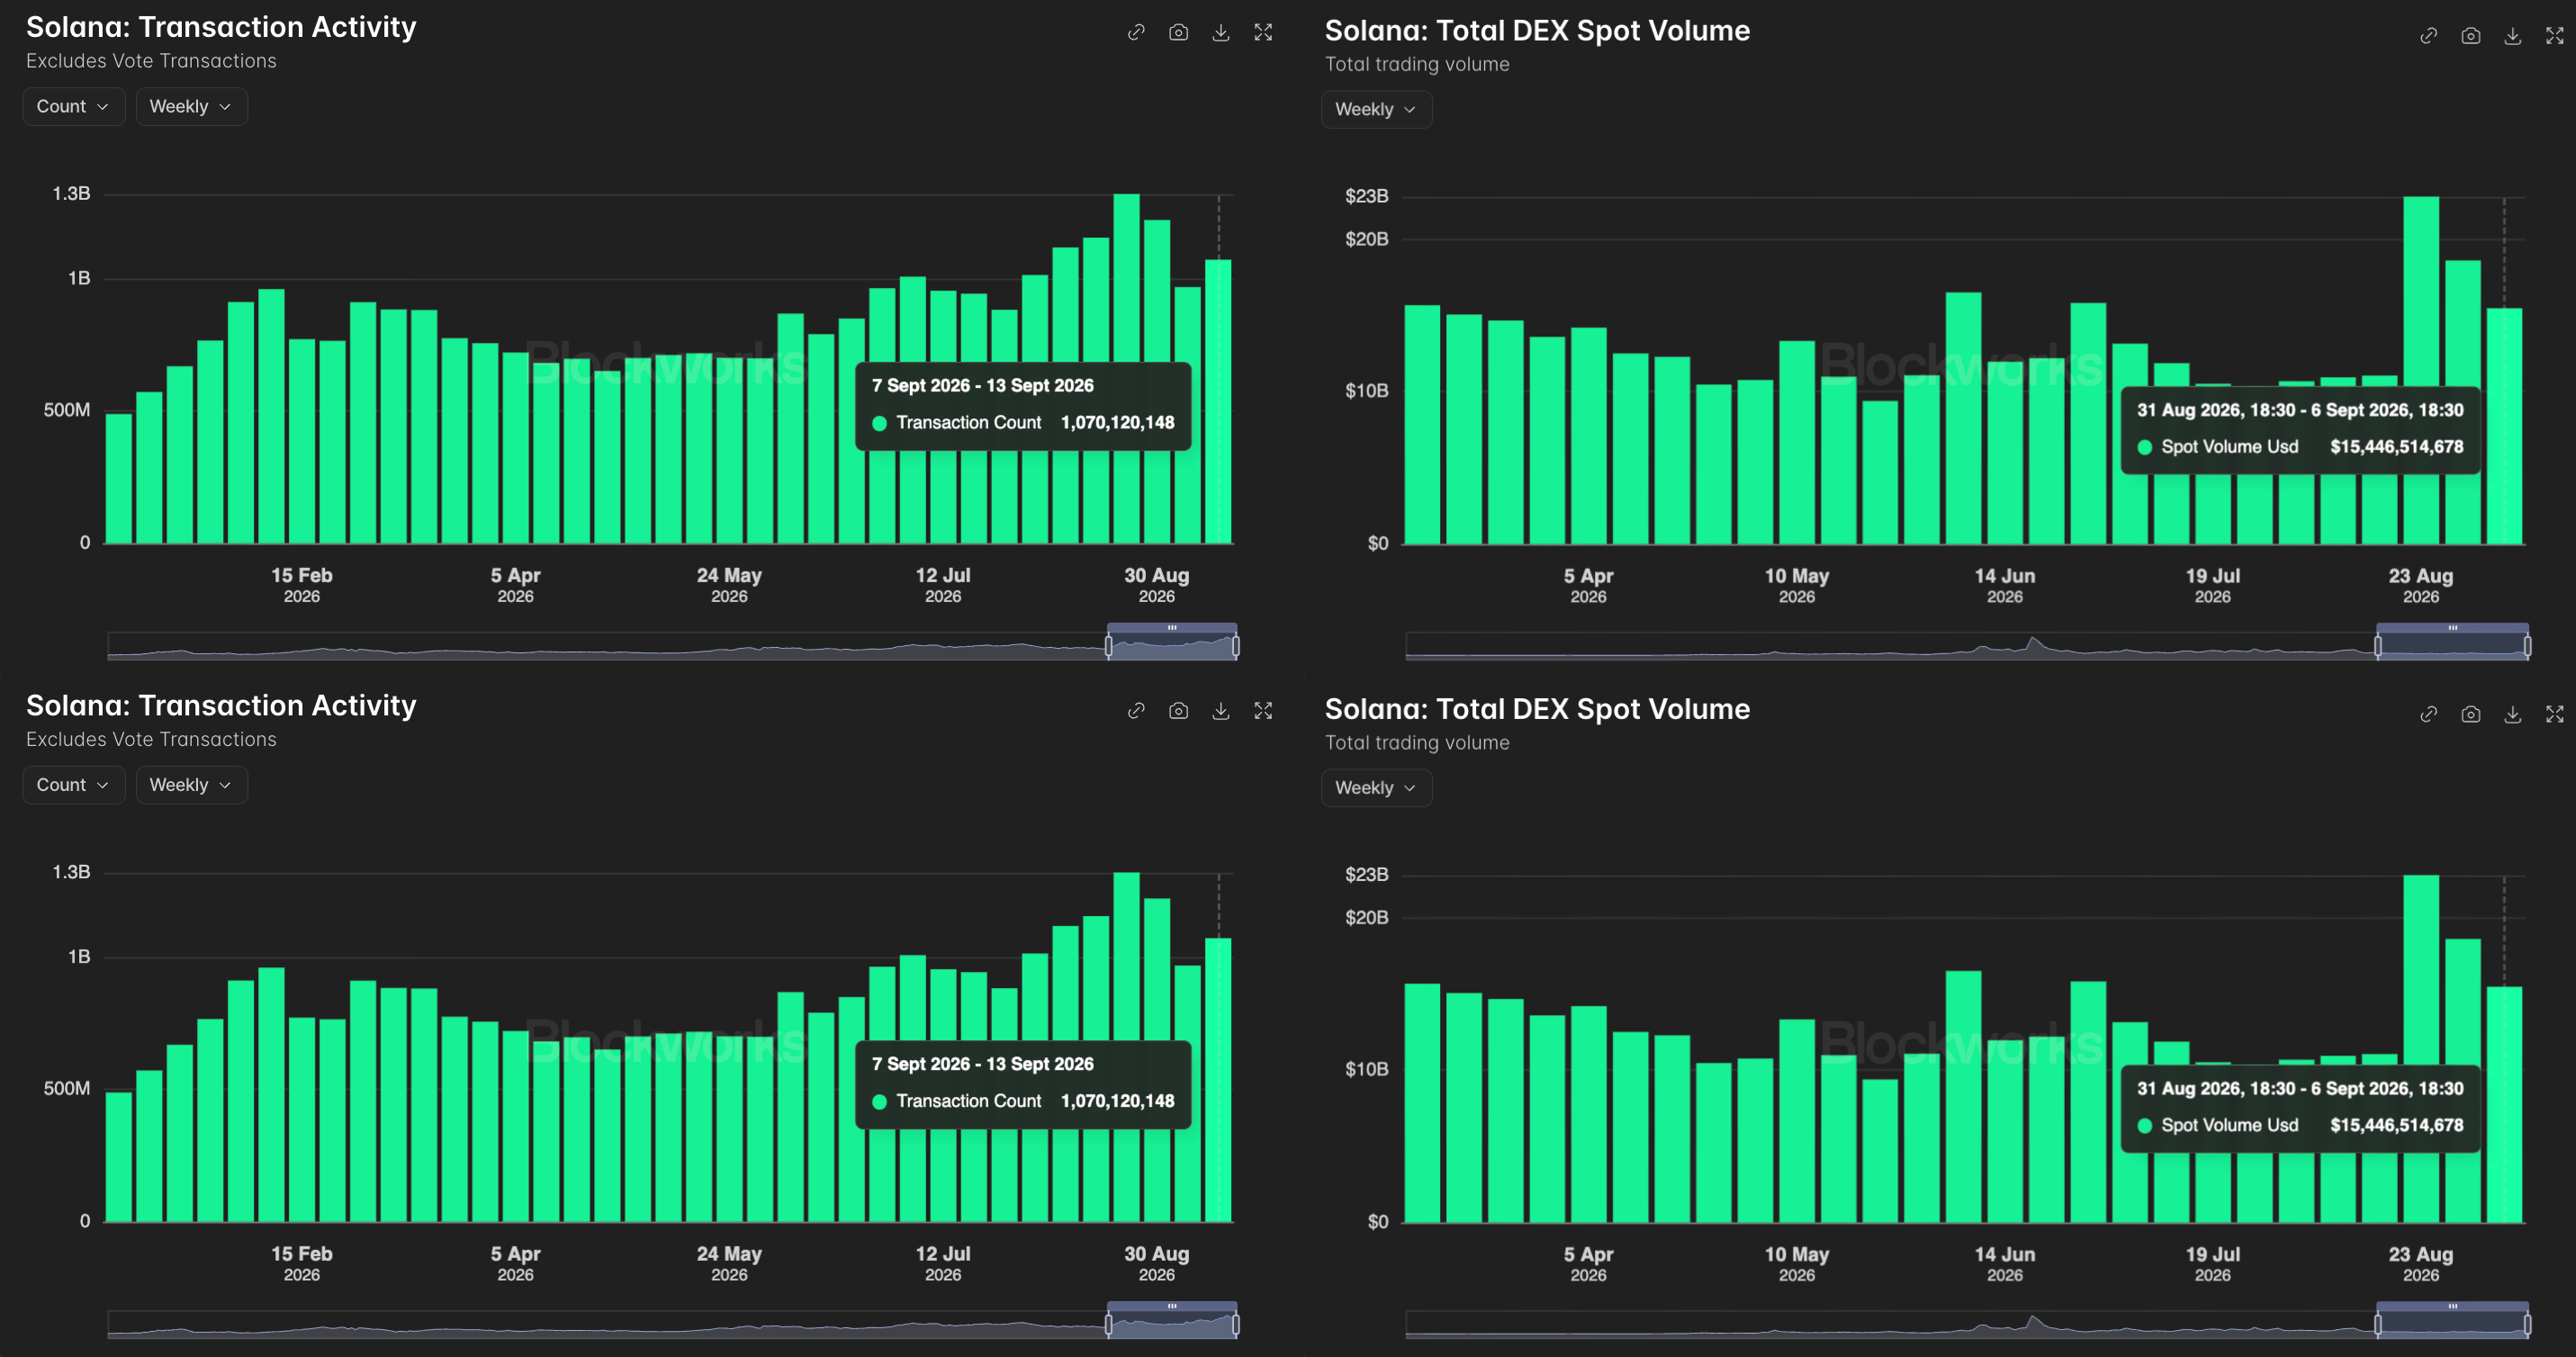
Blockworks data shows Solana collected $45.35 million in revenue last week, up from $32 million in the previous week. At the same time, its real economic value, which tracks transaction fees and out-of-protocol tips, stood at $6.33 million, up from $5.36 million last week.
In addition, transaction activity reached 1.07 million last week, up from 966,862 the previous week. Taken together, Solana’s network strength is improving, which could translate into increased demand for its native token, SOL.
Institutional demand holds firm
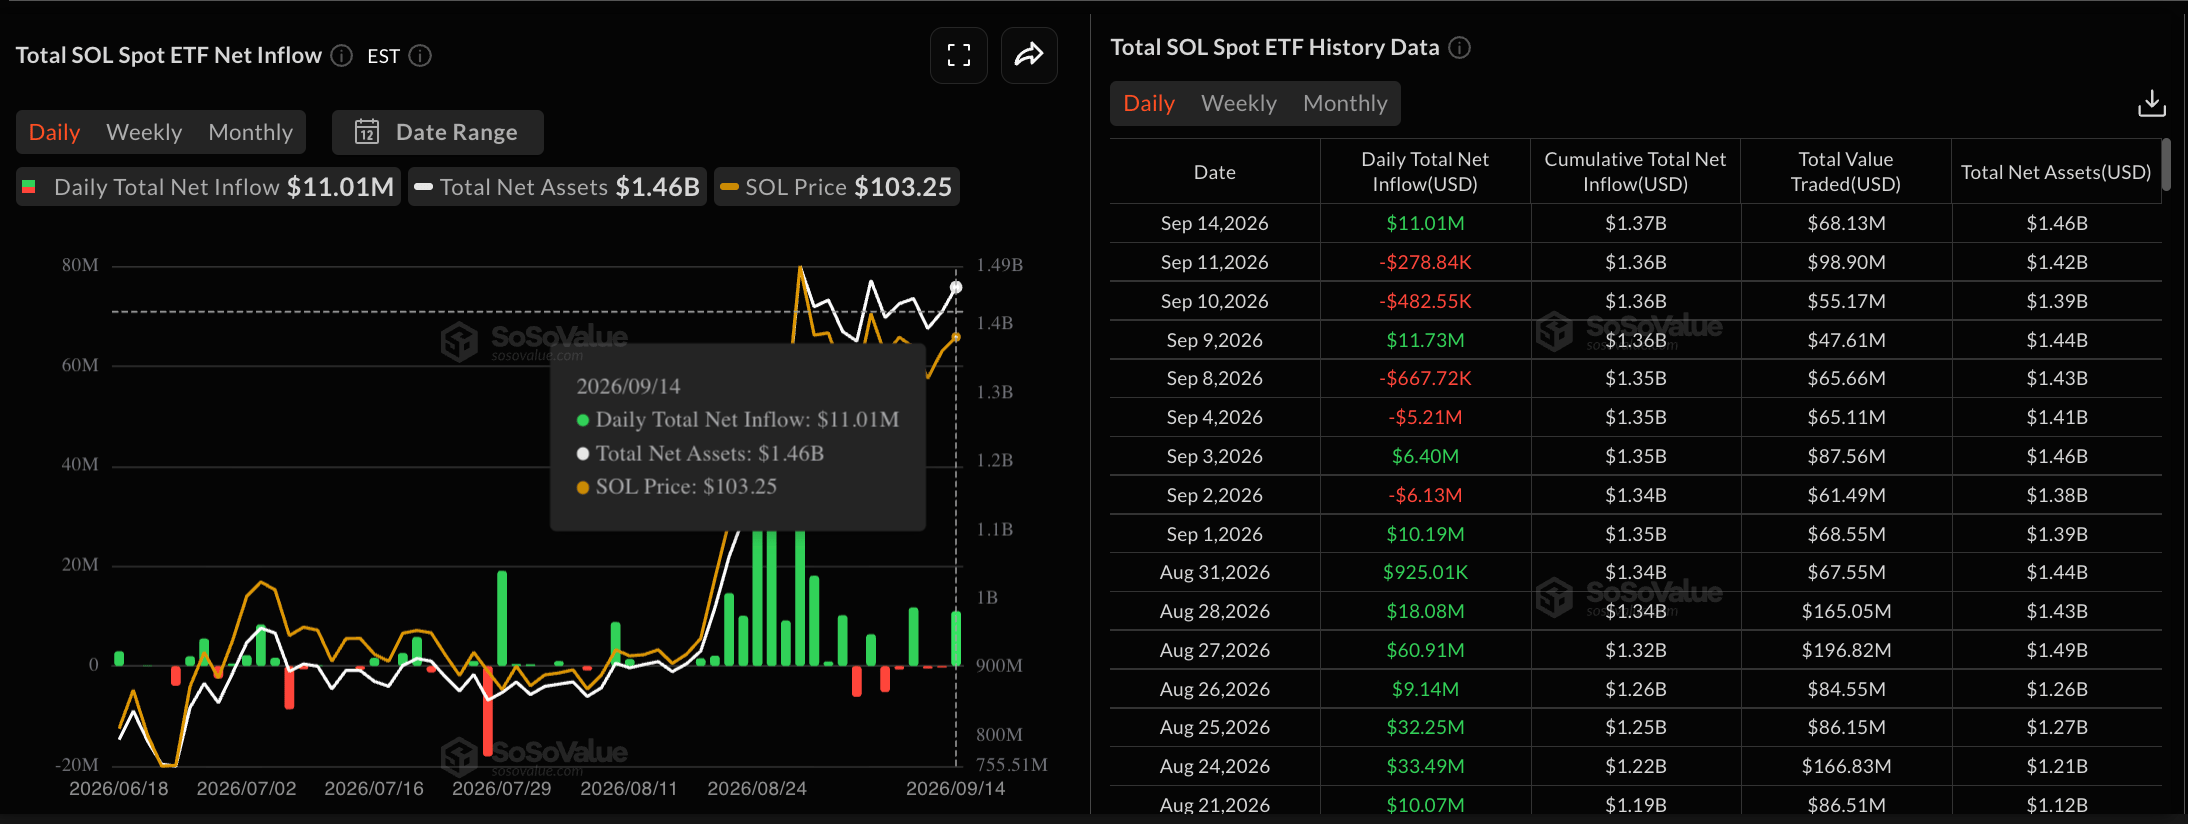
Solana retains its institutional strength with Exchange Traded Funds (ETFs) recording $11.01 million in inflows on Monday, advancing the $10.30 million weekly inflow last week. This extends the streak of 11 consecutive weekly inflows, including $14.62 million and $193.54 million in inflows in July and August, respectively. Consistent inflows reflect firm institutional demand for Solana, supporting the long-term upside potential.
Technical outlook: Solana maintains a neutral to bullish bias
Solana trades around $101 on Tuesday, holding its mild 3% gains from the previous day. SOL hovers marginally above the 50-period and 100-period Exponential Moving Averages (EMAs) on the four-hour chart near $101.72 and $100.71, suggesting a neutral yet slightly constructive bias as buyers defend the $100 handle.
Solana struggles to decisively reclaim short-term trend control but remains well above the 200-period EMA at $96.06. The Fibonacci retracement from $74.10 to $110.60 highlights the 78.6% retracement level at $101.51 acting as the near-term support, while price remains capped between two converging trendlines, forming a symmetrical triangle pattern.
Momentum remains neutral on the four-hour chart, with the Moving Average Convergence Divergence (MACD) holding marginally above its signal line and rising toward the zero line. At the same time, the Relative Strength Index (RSI) hovers close to 51, hinting at modest bullish momentum.
On the topside, immediate resistance is at the overhead trendline, which earlier capped the day's high near $104.82, followed by the $110.60 swing high. A confirmed breakout above this level could target the 127.2% Fibonacci extension level at $123.32, projecting nearly 20% upside potential.
On the downside, initial support comes from the 100-period EMA at $100.71, with further support from the trendline near Friday's low around $98.00 and the 200-period EMA at $96.06.
(The technical analysis of this story was written with the help of an AI tool. Know more.)
Recommended Articles


