


Shiba Inu Price Forecast: The three factors driving SHIB's mystery rally
- Shiba Inu is down over 3% on Monday, signaling profit-taking after a two-day rally of over 25%.
- Shiba Inu rally aligned with over 1 trillion SHIB tokens burned over the last two days, a surge in trading volume in South Korea.
- The launch of Woofswap DEX v3 on Friday marked the expansion of the Shiba Inu ecosystem.
- SHIB futures witness a sharp decline in speculative demand as Open Interest drops over 20% in 24 hours.
Shiba Inu (SHIB) price is down 3% on Monday, reflecting a potential profit-driven pullback after rising over 25% over the last two days. The mystery rally in SHIB has outpaced the minor recovery seen in other meme coins, with data suggesting it is linked to supply burns, the Korean market demand, and ecosystem expansion.
Over 1 trillion SHIB burned in 48 hours
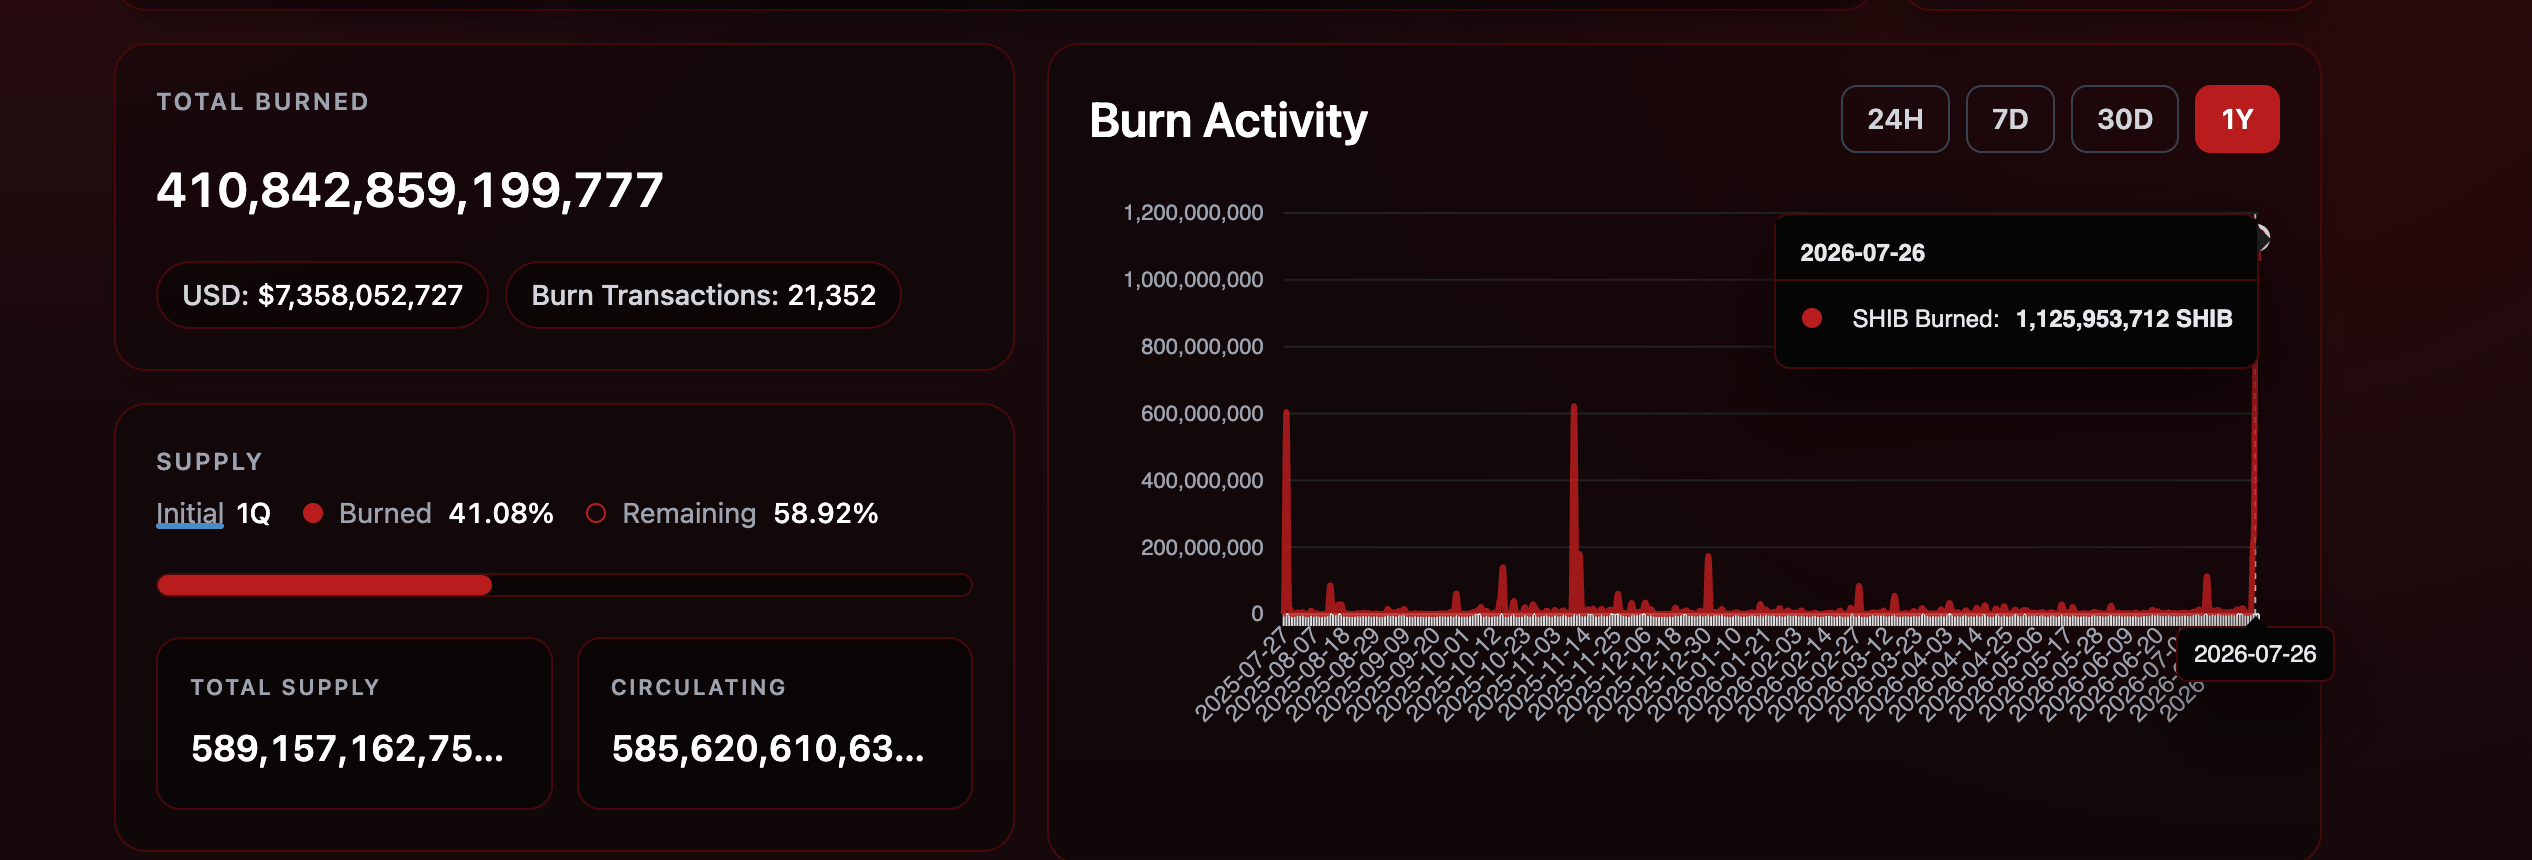
Token burns – the permanent removal of tokens from the circulating supply – often lead to a minor recovery in crypto assets, given the demand-supply dynamics. Shibburn data shows nearly 226 million and 1.35 trillion tokens burned over the last two days, followed by 1.03 trillion SHIB burned on Monday. This marked the largest burning activity over the last year, fueling the short-term demand.
South Korean investors turn to SHIB
SHIB/KRW pair on South Korea’s largest crypto exchange, Upbit, recorded over $62 million in trading volume, more than 10% of the global volume, as per CoinDesk reports. The massive surge in SHIB volume aligns with the speculative demand spikes for high-risk assets previously seen in the Korean markets.
The launch of Woofswap DEX v3
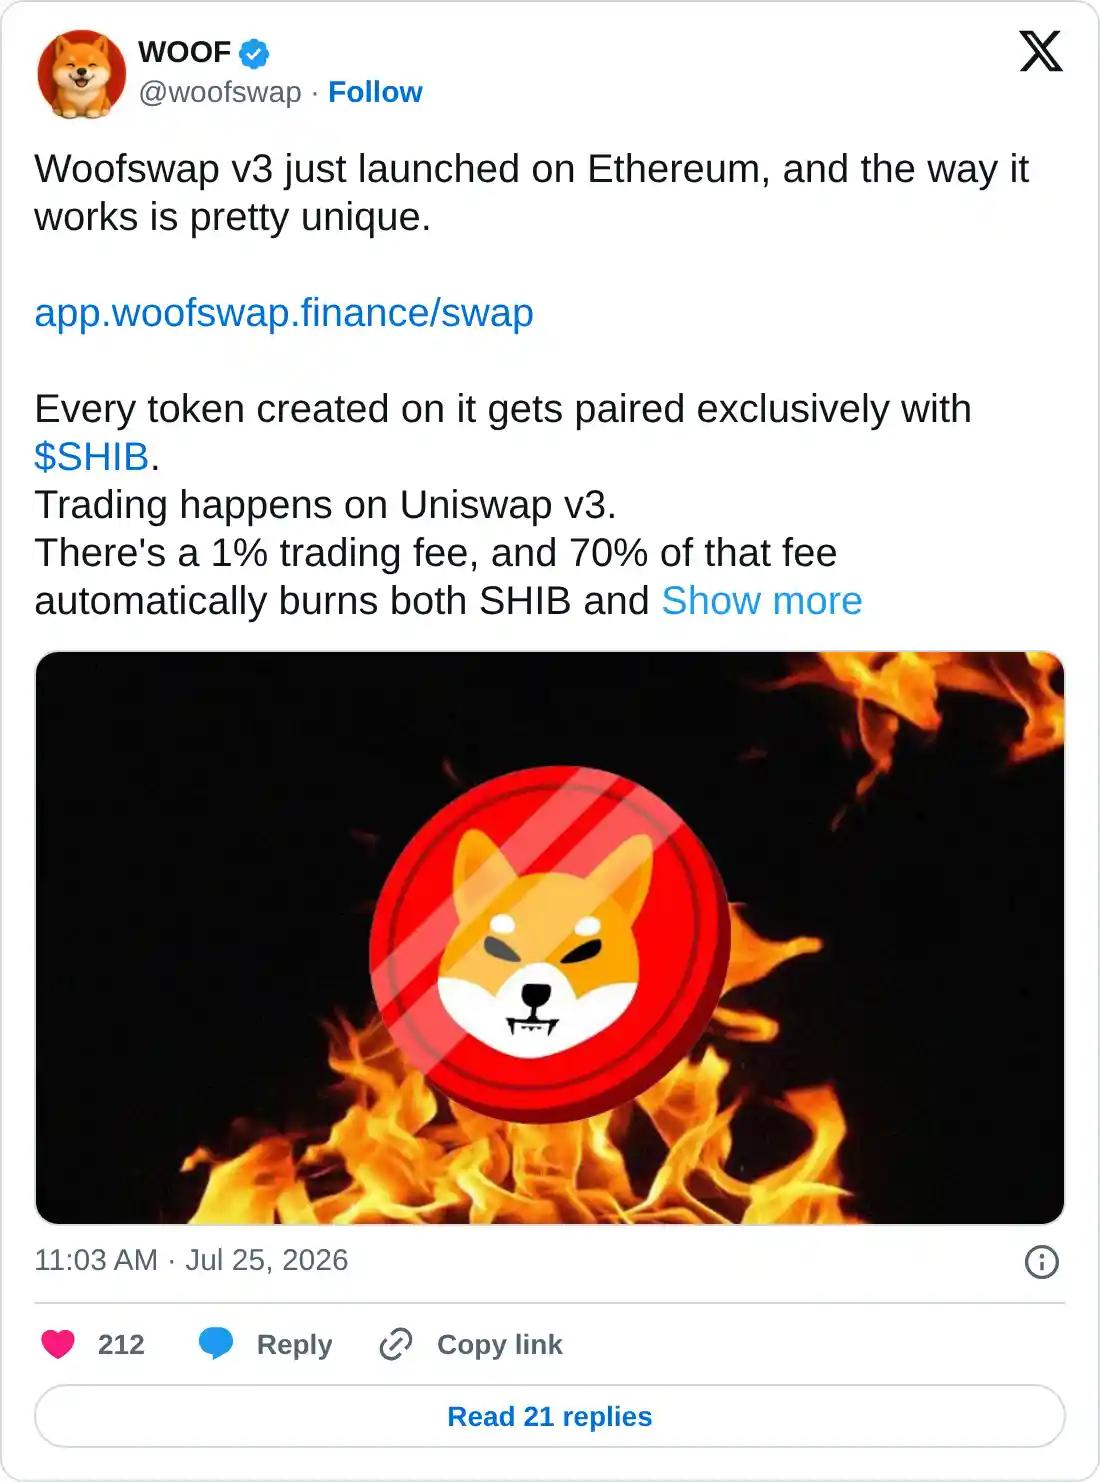
The Woofswap DEX launched its v3 on Ethereum on Friday, expanding the Shiba Inu ecosystem and fueling token burn. Tokens created on Woofswap are paired exclusively with SHIB and traded on Uniswap at a 1% trading fee. Nearly 70% of the fee burns SHIB and the newly created token, resulting in a near-term deflationary impact.
Where is Shiba Inu price headed now?
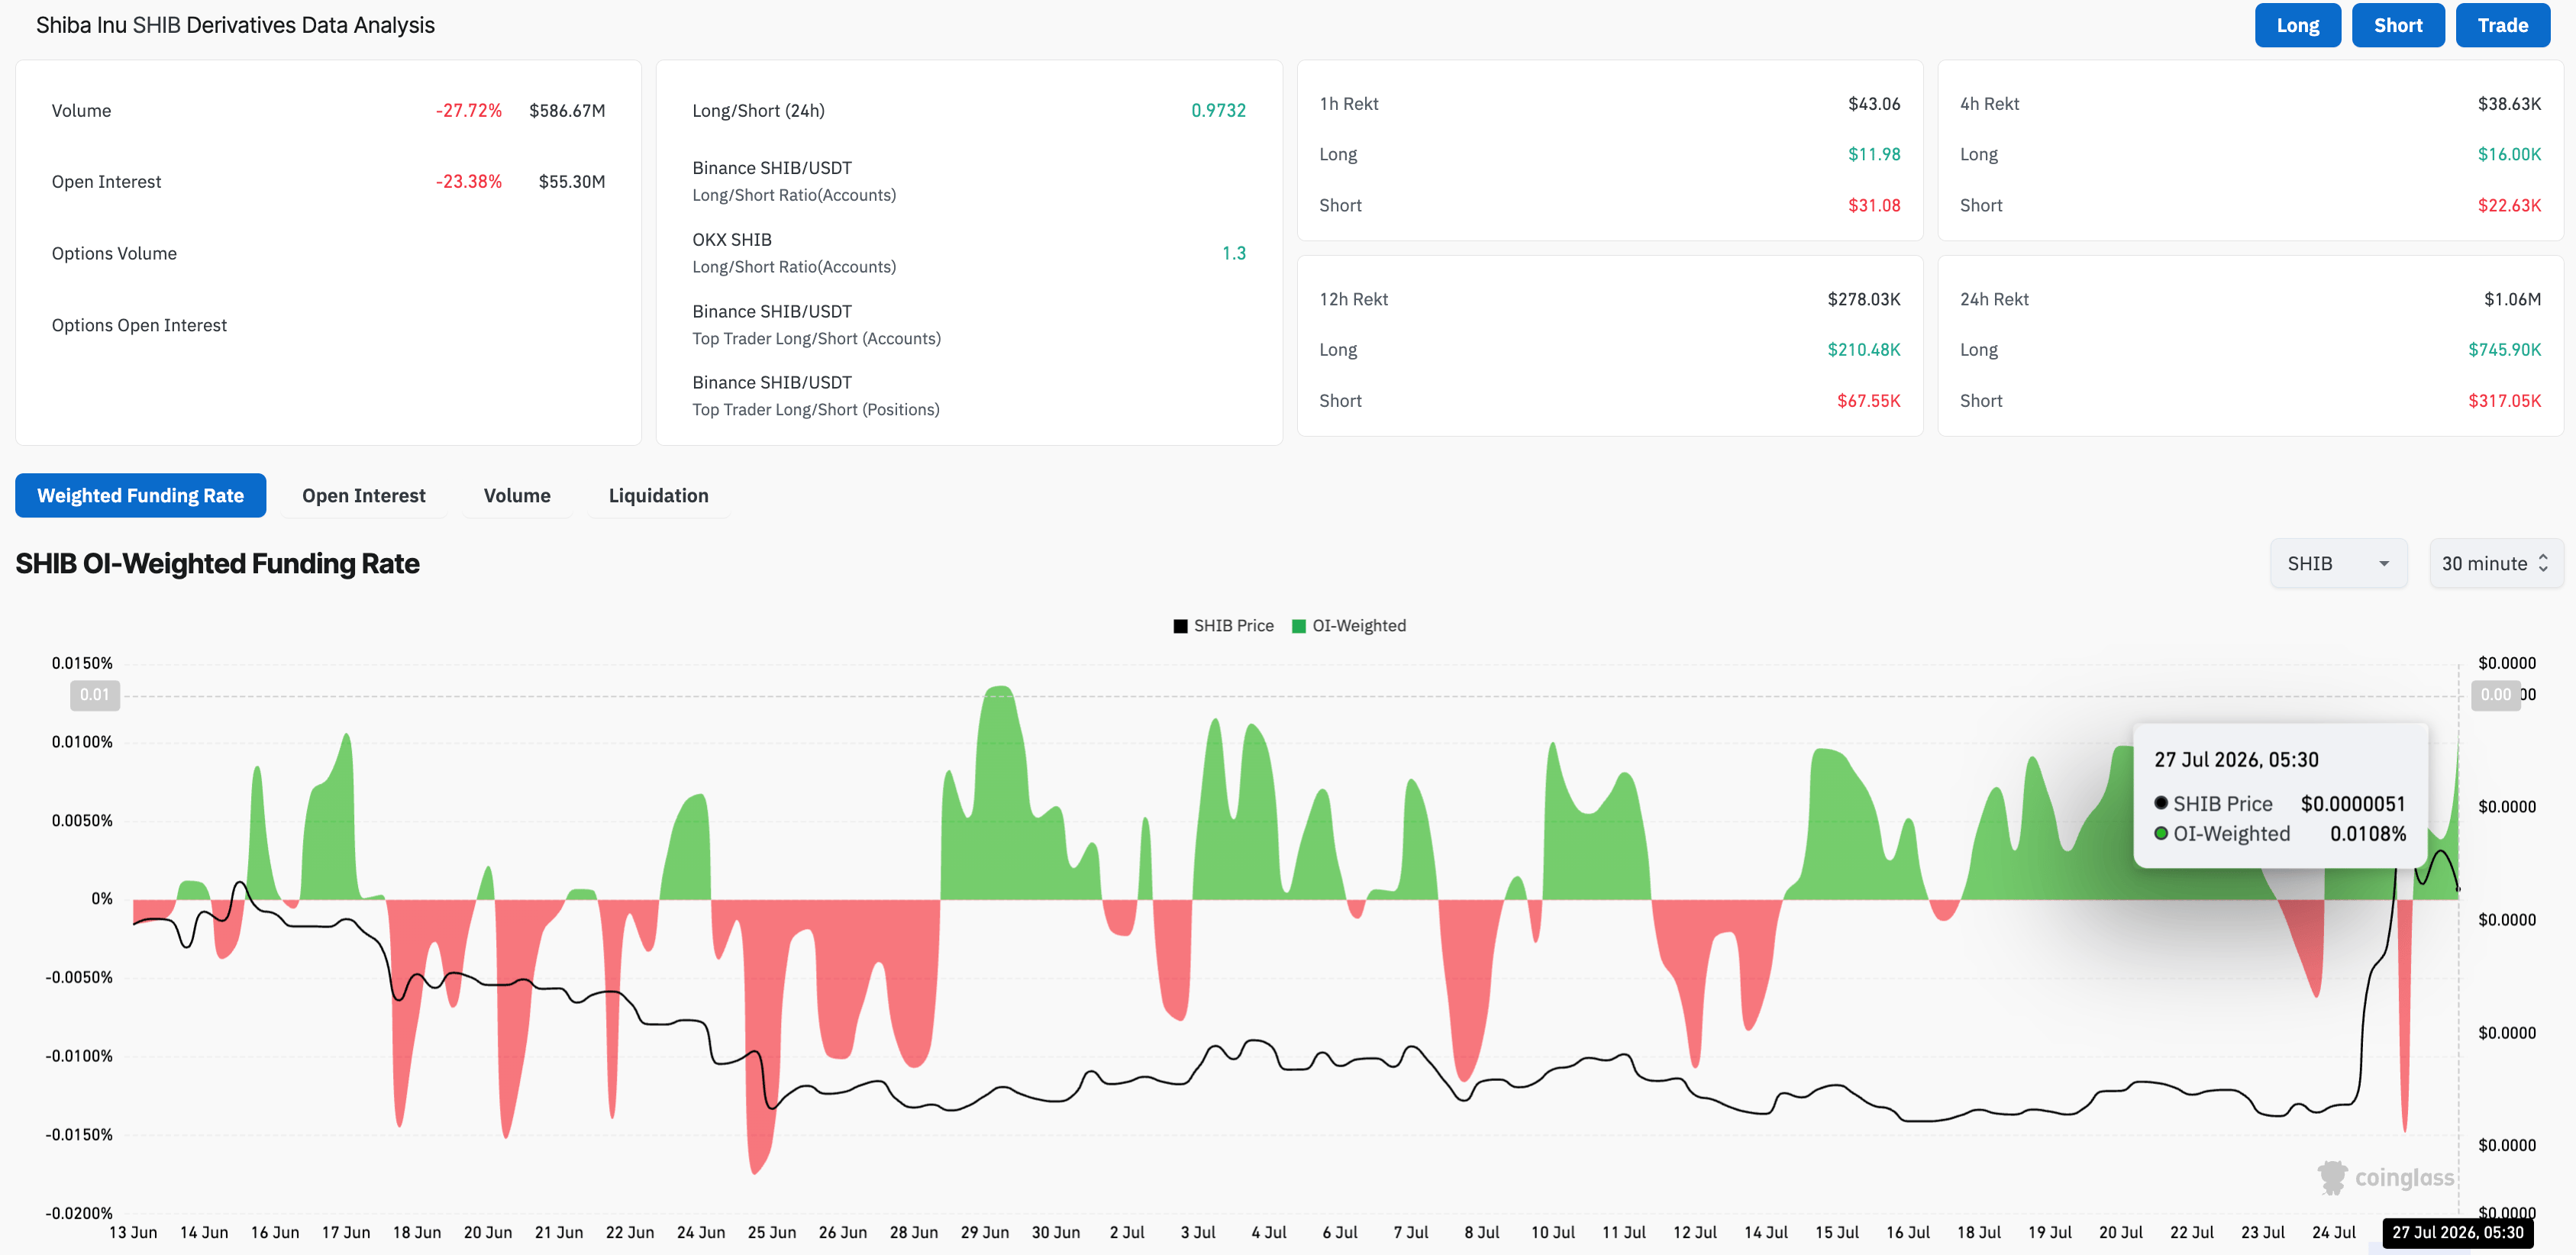
The speculative demand for SHIB is easing. CoinGlass data shows the SHIB Open Interest (OI) is down 23% over the last 24 hours to $55.30 million, pointing to a sharp decline in positional buildup. The 27% decline in trading volume to $586.67 million over the same period echoes reduced retail interest in SHIB.
Still, the funding rate of 0.0108%, up from 0.0038% the previous day, reflects that traders continue to buy long positions at a premium, potentially hoping for a sustained uptrend. If the demand remains subdued in the near term, this positional buildup could lead to a long squeeze in SHIB futures.
From a technical perspective, SHIB is down 3% on Monday, reflecting a near-term profit-taking phase. The two-day rally in the meme coin surpassed the 50-day and 100-day Exponential Moving Averages (EMAs) at $0.00000461 and $0.00000504, respectively.
The intraday pullback retests the broken resistance trendline near $0.00000520, which could lead to a post-retest rally if price sustains a bullish intraday close. The immediate resistance for SHIB lies at the 200-day EMA at $0.00000604, followed by the May 10 swing high at $0.00000669.
The Moving Average Convergence Divergence (MACD) shows a positive spike above the zero line alongside its signal line, suggesting renewed bullish momentum.
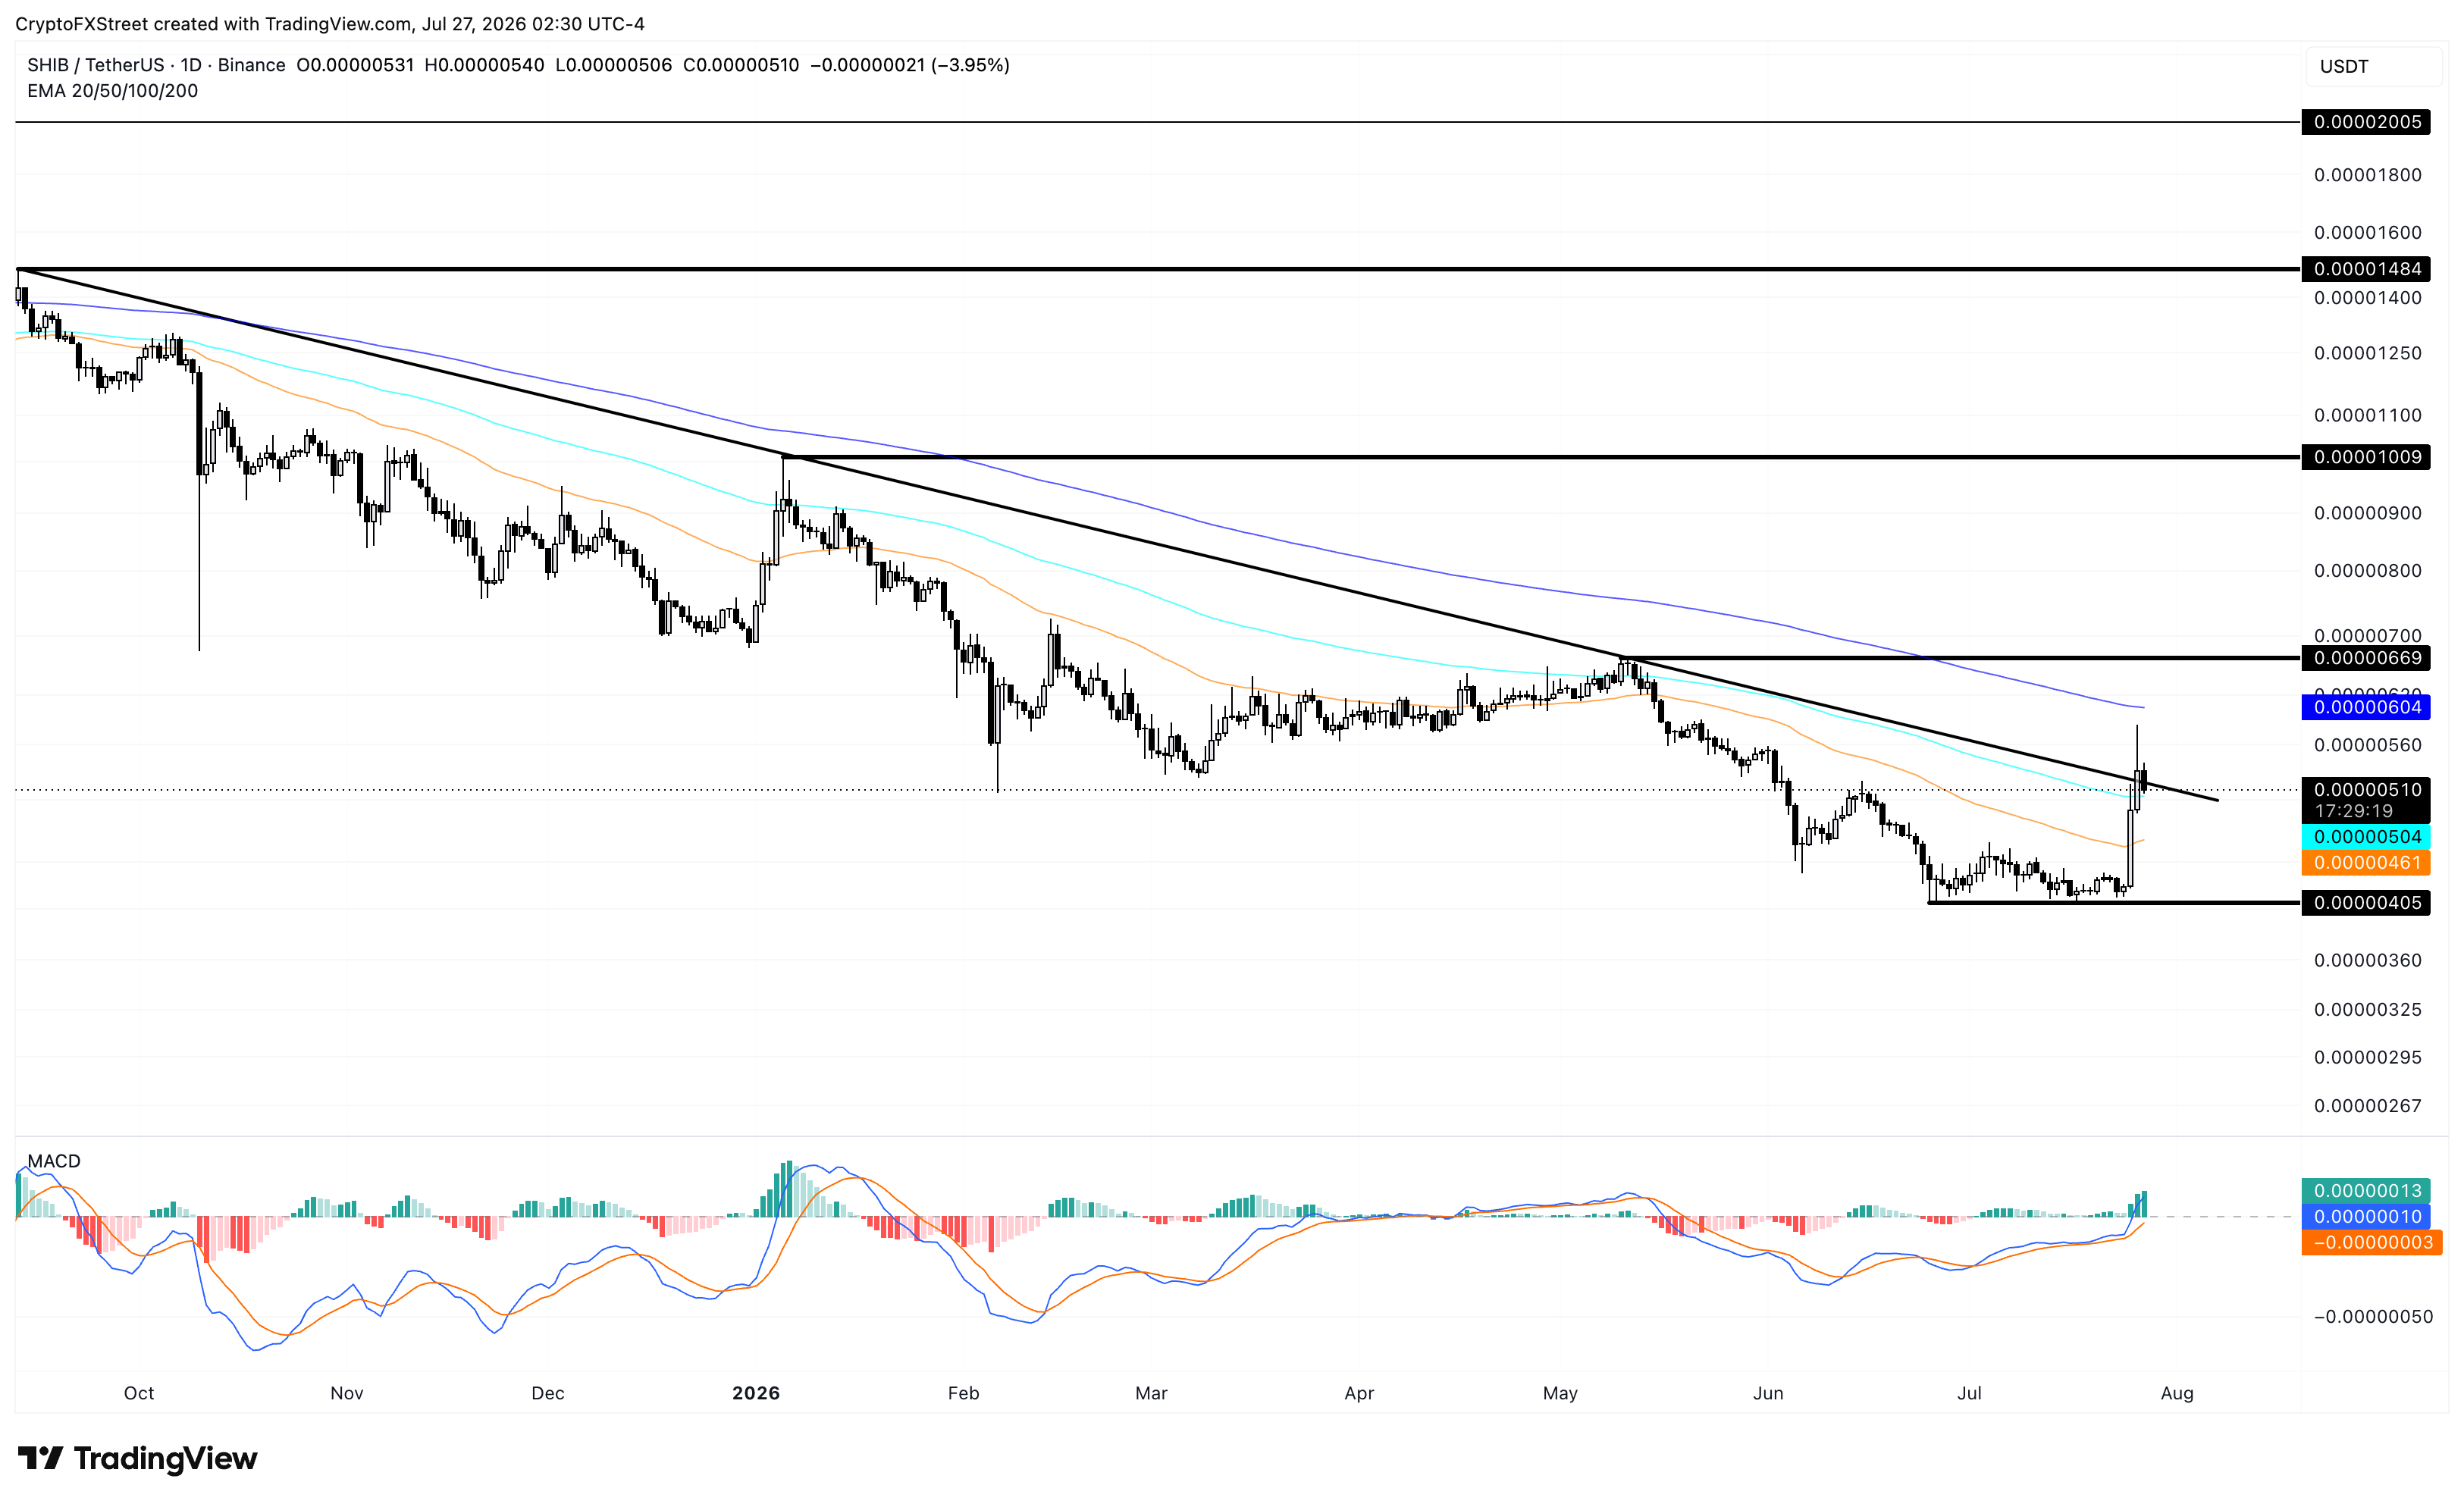
Looking down, a decisive close below the $0.00000500 psychological level could nullify the breakout rally, potentially extending the decline toward the 50-day EMA at $0.00000461.
(The technical analysis of this story was written with the help of an AI tool. Know more.)
Recommended Articles


