

Cardano Price Forecast: Under pressure as bearish derivatives cap recovery

Source Fxstreet
  • Cardano price remains under pressure on Monday, trading below key EMAs.
  • Derivatives metrics support a bearish bias with negative funding rates and rising short bets.
  • Momentum indicators paint a cautious picture, suggesting only limited recovery attempts within the prevailing downtrend.

Cardano (ADA) remains under pressure, trading lower at $0.165 on Monday after mild losses in the previous week. Weakening derivatives metrics and subdued momentum indicators suggest that ADA's upside move remains limited, keeping downside risks in focus.

Derivatives metrics cap ADA recovery

Derivatives data for Cardano shows bearish sentiment among traders. CoinGlass’ long-to-short ratio for ADA reads 0.82 on Monday, nearing the lowest level over a month. The ratio being below one indicates bearish sentiment, as traders are betting the asset's price will fall.
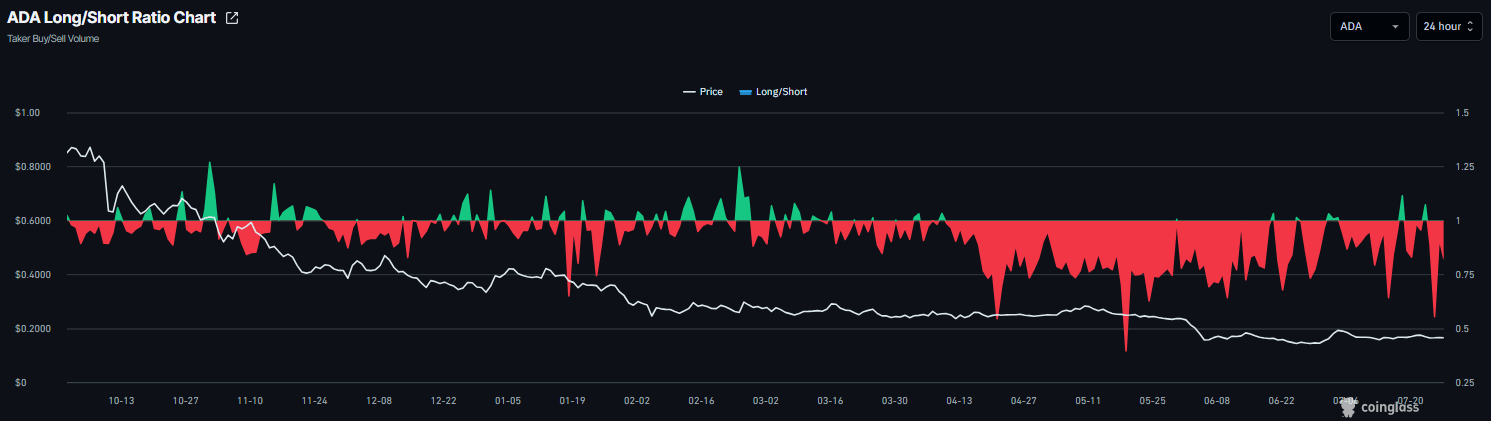
ADA long-to-short ratio chart. Source: Coinglass

In addition, the funding rates also show a bearish bias. ADA funding rates flipped negative on Sunday, reading -0.008 on Monday, indicating that shorts are paying longs and signaling a negative outlook.
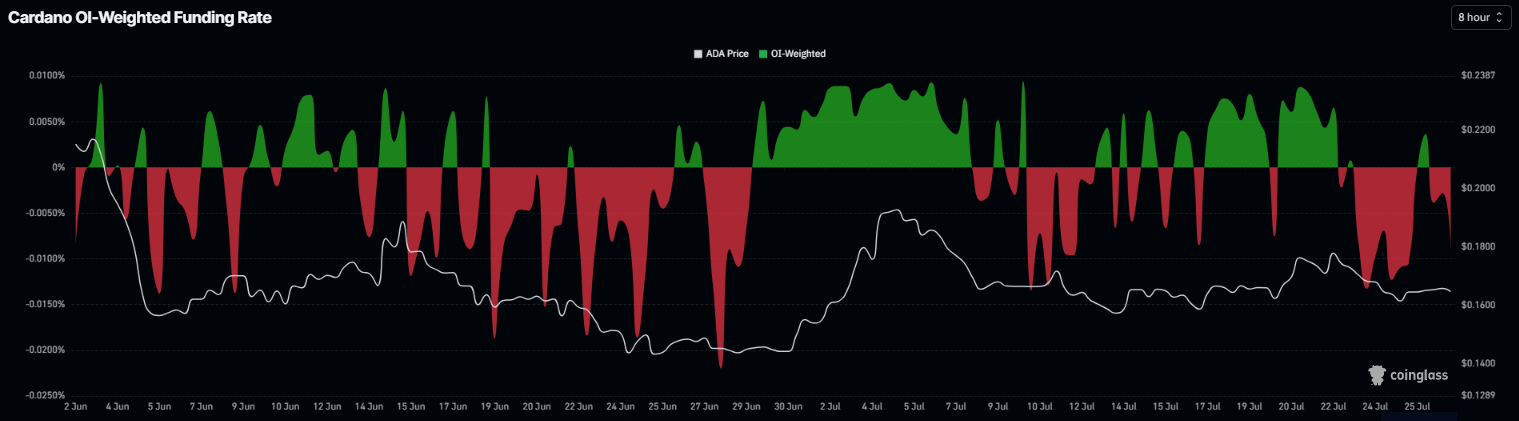
Cardano funding rates chart. Source: Coinglass

Cardano Price Forecast: Trades below key EMAs

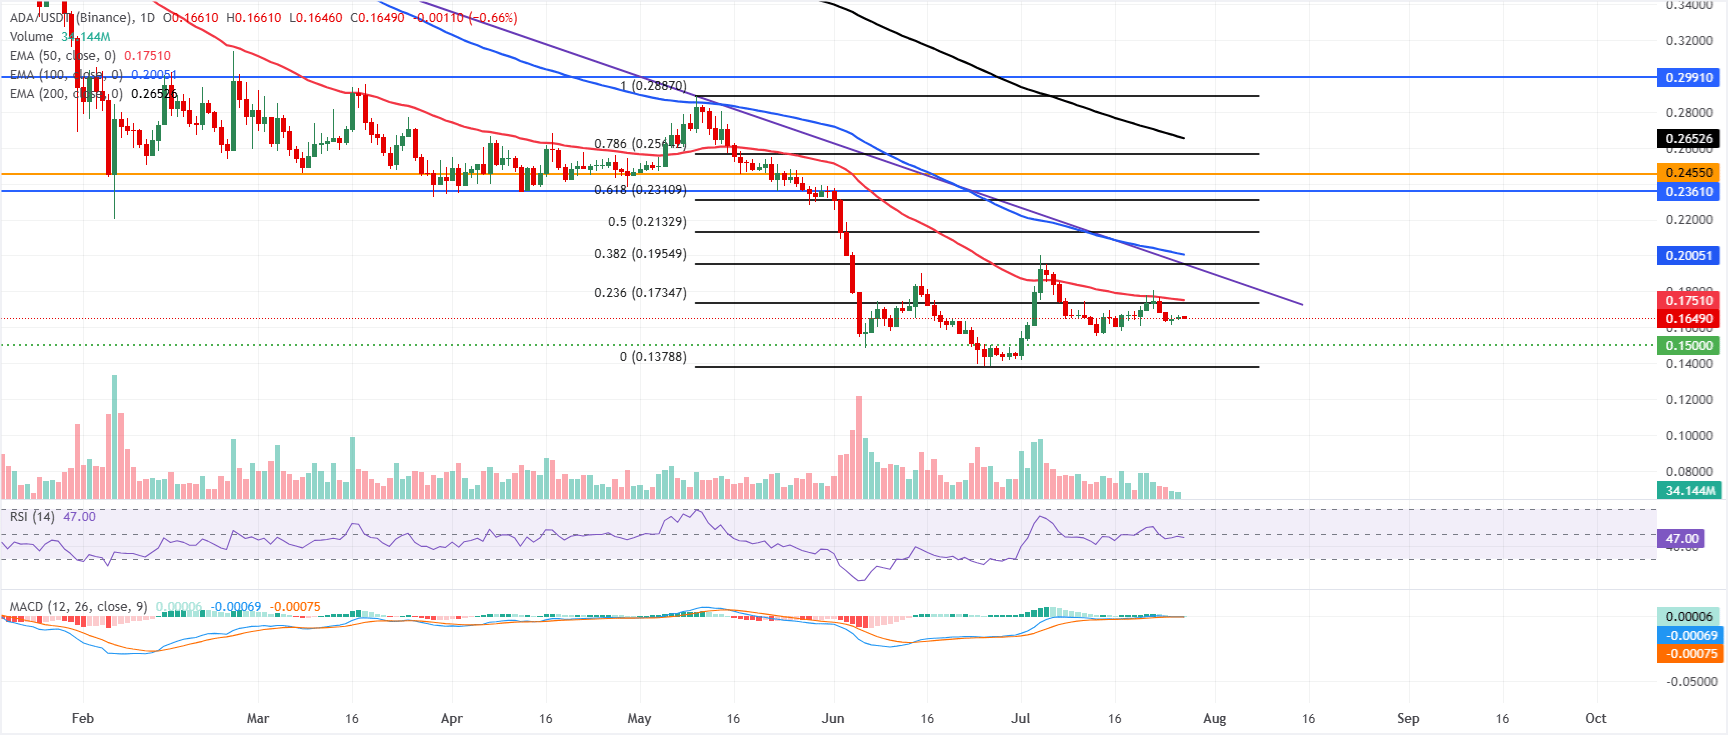
Cardano price trades at $0.165, holding in a bearish near-term bias as price remains capped well below the 50-day, 100-day and 200-day Exponential Moving Averages (EMAs), clustered from roughly $0.180 to $0.270.

The Relative Strength Index (RSI) sits just below the neutral band, around 47, suggesting subdued momentum after the recent bounce from the lows. At the same time, the Moving Average Convergence Divergence (MACD) indicator edges closer to the signal line with a very small positive reading, suggesting only modest recovery attempts within a broader downtrend.

On the topside, initial resistance is aligned at the 23.6% Fibonacci retracement at $0.173, closely followed by the 50-day EMA around $0.175; a sustained break above this cluster would open the way toward the 38.2% Fibonacci retracement at $0.195 and the 100-day EMA near $0.200. Further up, the 50% retracement at $0.213 and the 61.8% Fibonacci retracement level at $0.231 precede a dense resistance band around $0.236–$0.245.

On the downside, immediate support is seen at the horizontal level of $0.150, ahead of the Fibonacci anchor low around $0.137, where buyers would be expected to show more interest if the current decline extends.
(The technical analysis of this story was written with the help of an AI tool. Know more.)

Disclaimer: For information purposes only. Past performance is not indicative of future results.
placeholder
Markets on a Wire: Imminent US Inflation Data Threatens to Lock In Fed Rate Hikes Imminent CPI and PPI data threaten to lock in a hawkish Federal Reserve rate hike cycle, leaving gold, tech equities, and Bitcoin highly vulnerable to a programmatic sell-off.
Author  Mitrade Team
6 Month 09 Day Tue
Imminent CPI and PPI data threaten to lock in a hawkish Federal Reserve rate hike cycle, leaving gold, tech equities, and Bitcoin highly vulnerable to a programmatic sell-off.
placeholder
15 Days After SpaceX Listing, Index Funds Will Take 30% of Floating Shares, What It Means for Retail Investors?TradingKey - SpaceX (SPCX.US) is set to debut on Nasdaq on June 12, targeting a valuation of $1.75 trillion. At that time, only about 3% to 4% of total shares will be freely tradable; with founder sha
Author  Mitrade Team
6 Month 10 Day Wed
TradingKey - SpaceX (SPCX.US) is set to debut on Nasdaq on June 12, targeting a valuation of $1.75 trillion. At that time, only about 3% to 4% of total shares will be freely tradable; with founder sha
placeholder
Gold Price Analysis (XAU/USD): Gold Falls to 6-Month Low as Inflation Fuels Rate Hike Bets, A Buying Opportunity or a Falling Knife? Gold hit a 6-month low on Fed rate hike bets. However, strong central bank buying and technical indicators suggest potential tactical bounces and long-term accumulation windows.
Author  Mitrade Team
6 Month 12 Day Fri
Gold hit a 6-month low on Fed rate hike bets. However, strong central bank buying and technical indicators suggest potential tactical bounces and long-term accumulation windows.
placeholder
XRP Price Prediction for July 2026: Can Buyers Finally Break the Downtrend?XRP (XRP) price trades near $1.05, caught between a year-long downtrend and a sudden burst of buying.July has historically rewarded XRP holders. This year the month arrives with on-chain accumulation
Author  Beincrypto
6 Month 30 Day Tue
XRP (XRP) price trades near $1.05, caught between a year-long downtrend and a sudden burst of buying.July has historically rewarded XRP holders. This year the month arrives with on-chain accumulation
placeholder
What to Expect From Ethereum (ETH) in July 2026Ethereum (ETH) enters July 2026 trading near $1,570, close to multi-month lows, after recording its first run of three consecutive red quarterly candles in its history.On-chain data and price charts n
Author  Beincrypto
7 Month 01 Day Wed
Ethereum (ETH) enters July 2026 trading near $1,570, close to multi-month lows, after recording its first run of three consecutive red quarterly candles in its history.On-chain data and price charts n
Related Instrument
goTop
quote