


Dogecoin Price Forecast: DOGE rebound builds momentum
- Dogecoin is gaining momentum on Tuesday as the broader crypto market rebounds.
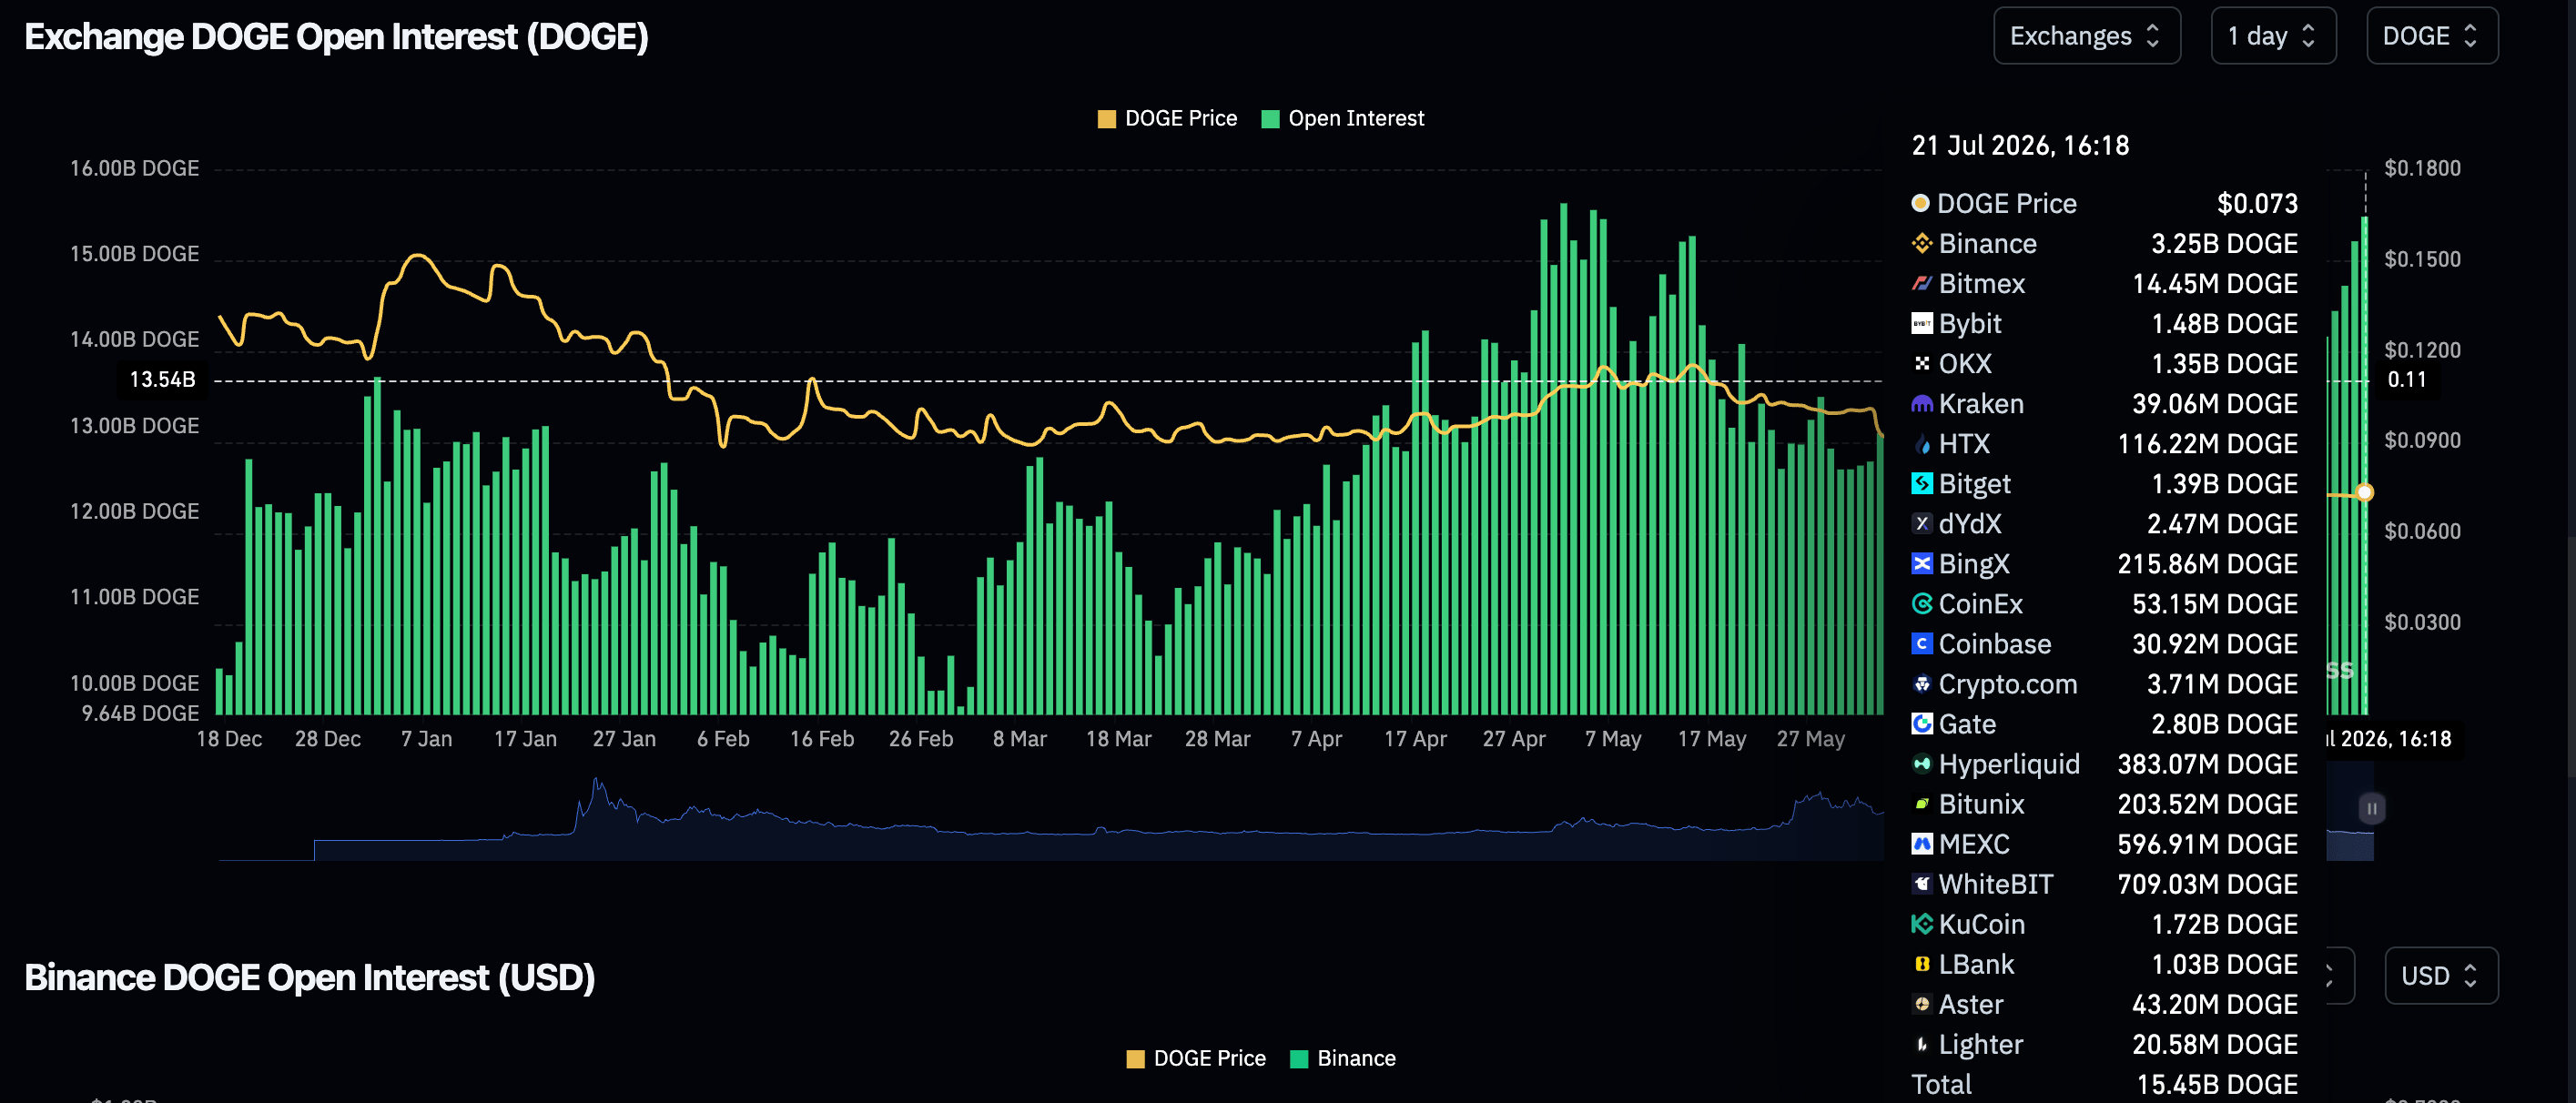
- The Dogecoin derivatives market shows signs of steady growth as futures Open Interest climbs to 15.45 billion DOGE.
- A break above the $0.075 supply level is required to steady the meme coin’s upswing and support a move toward the 50-day EMA.
Dogecoin (DOGE) rises alongside other cryptocurrencies on Tuesday, trading around $0.0734. The largest meme coin eyes a short-term breakout, supported by a steadily growing derivatives market.
Still, investors should assess the overall outlook, especially amid persistent strikes between the United States (US) and Iran that are denting market sentiment.
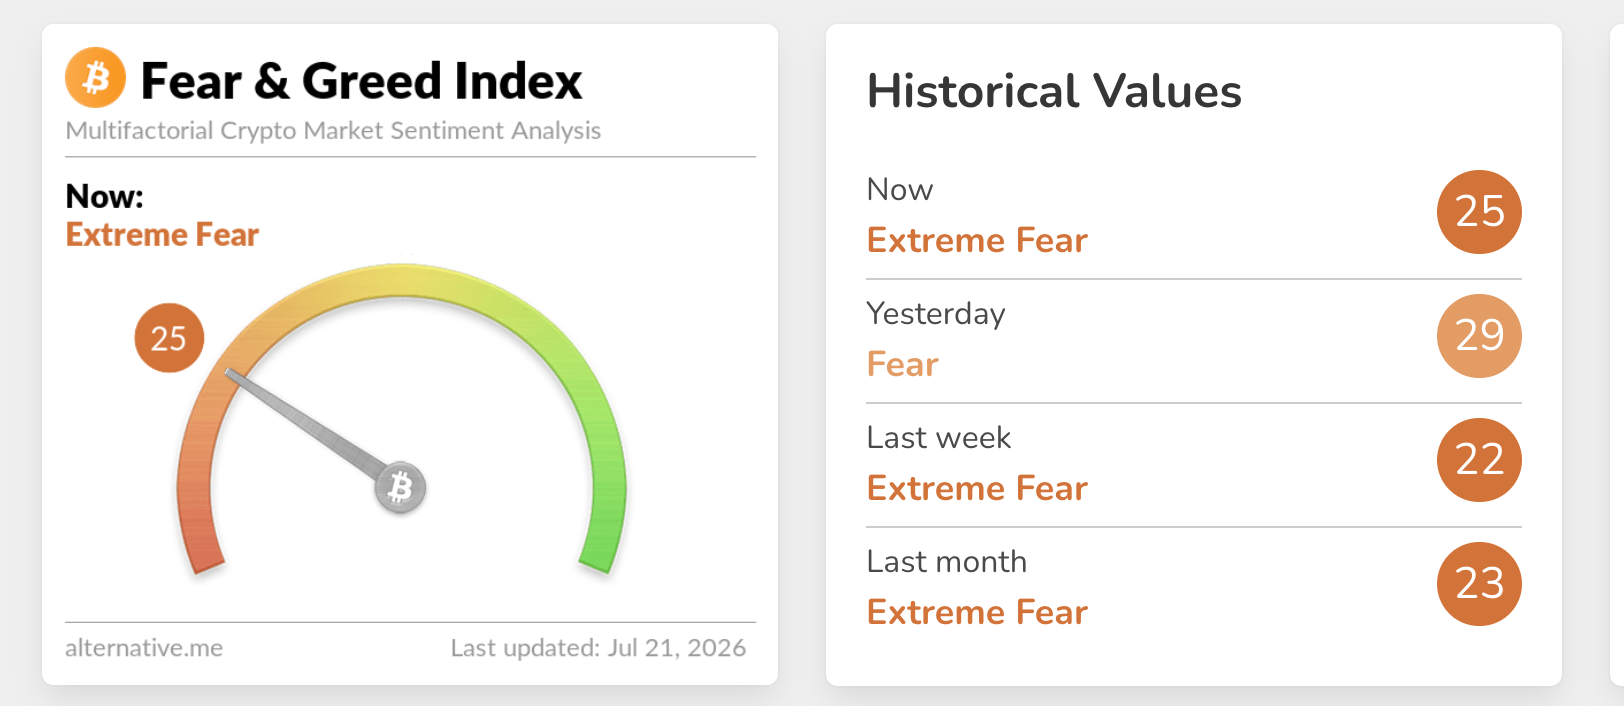
The Fear & Greed Index has dipped to 25 on Tuesday, placing market sentiment firmly in Extreme Fear territory, down from 29 the day before. If recovery lags and negatively impacts appetite for risk assets, Dogecoin’s ongoing rebound may lose steam.
Dogecoin retail demand returns
Dogecoin derivatives continues to regain momentum with futures Open Interest (OI) rising to 15.43 billion DOGE on Tuesday, from 14.64 billion DOGE. A broader scope highlights the growth in OI from 12.01 billion DOGE on June 11, underscoring increasing investor interest in the meme coin.
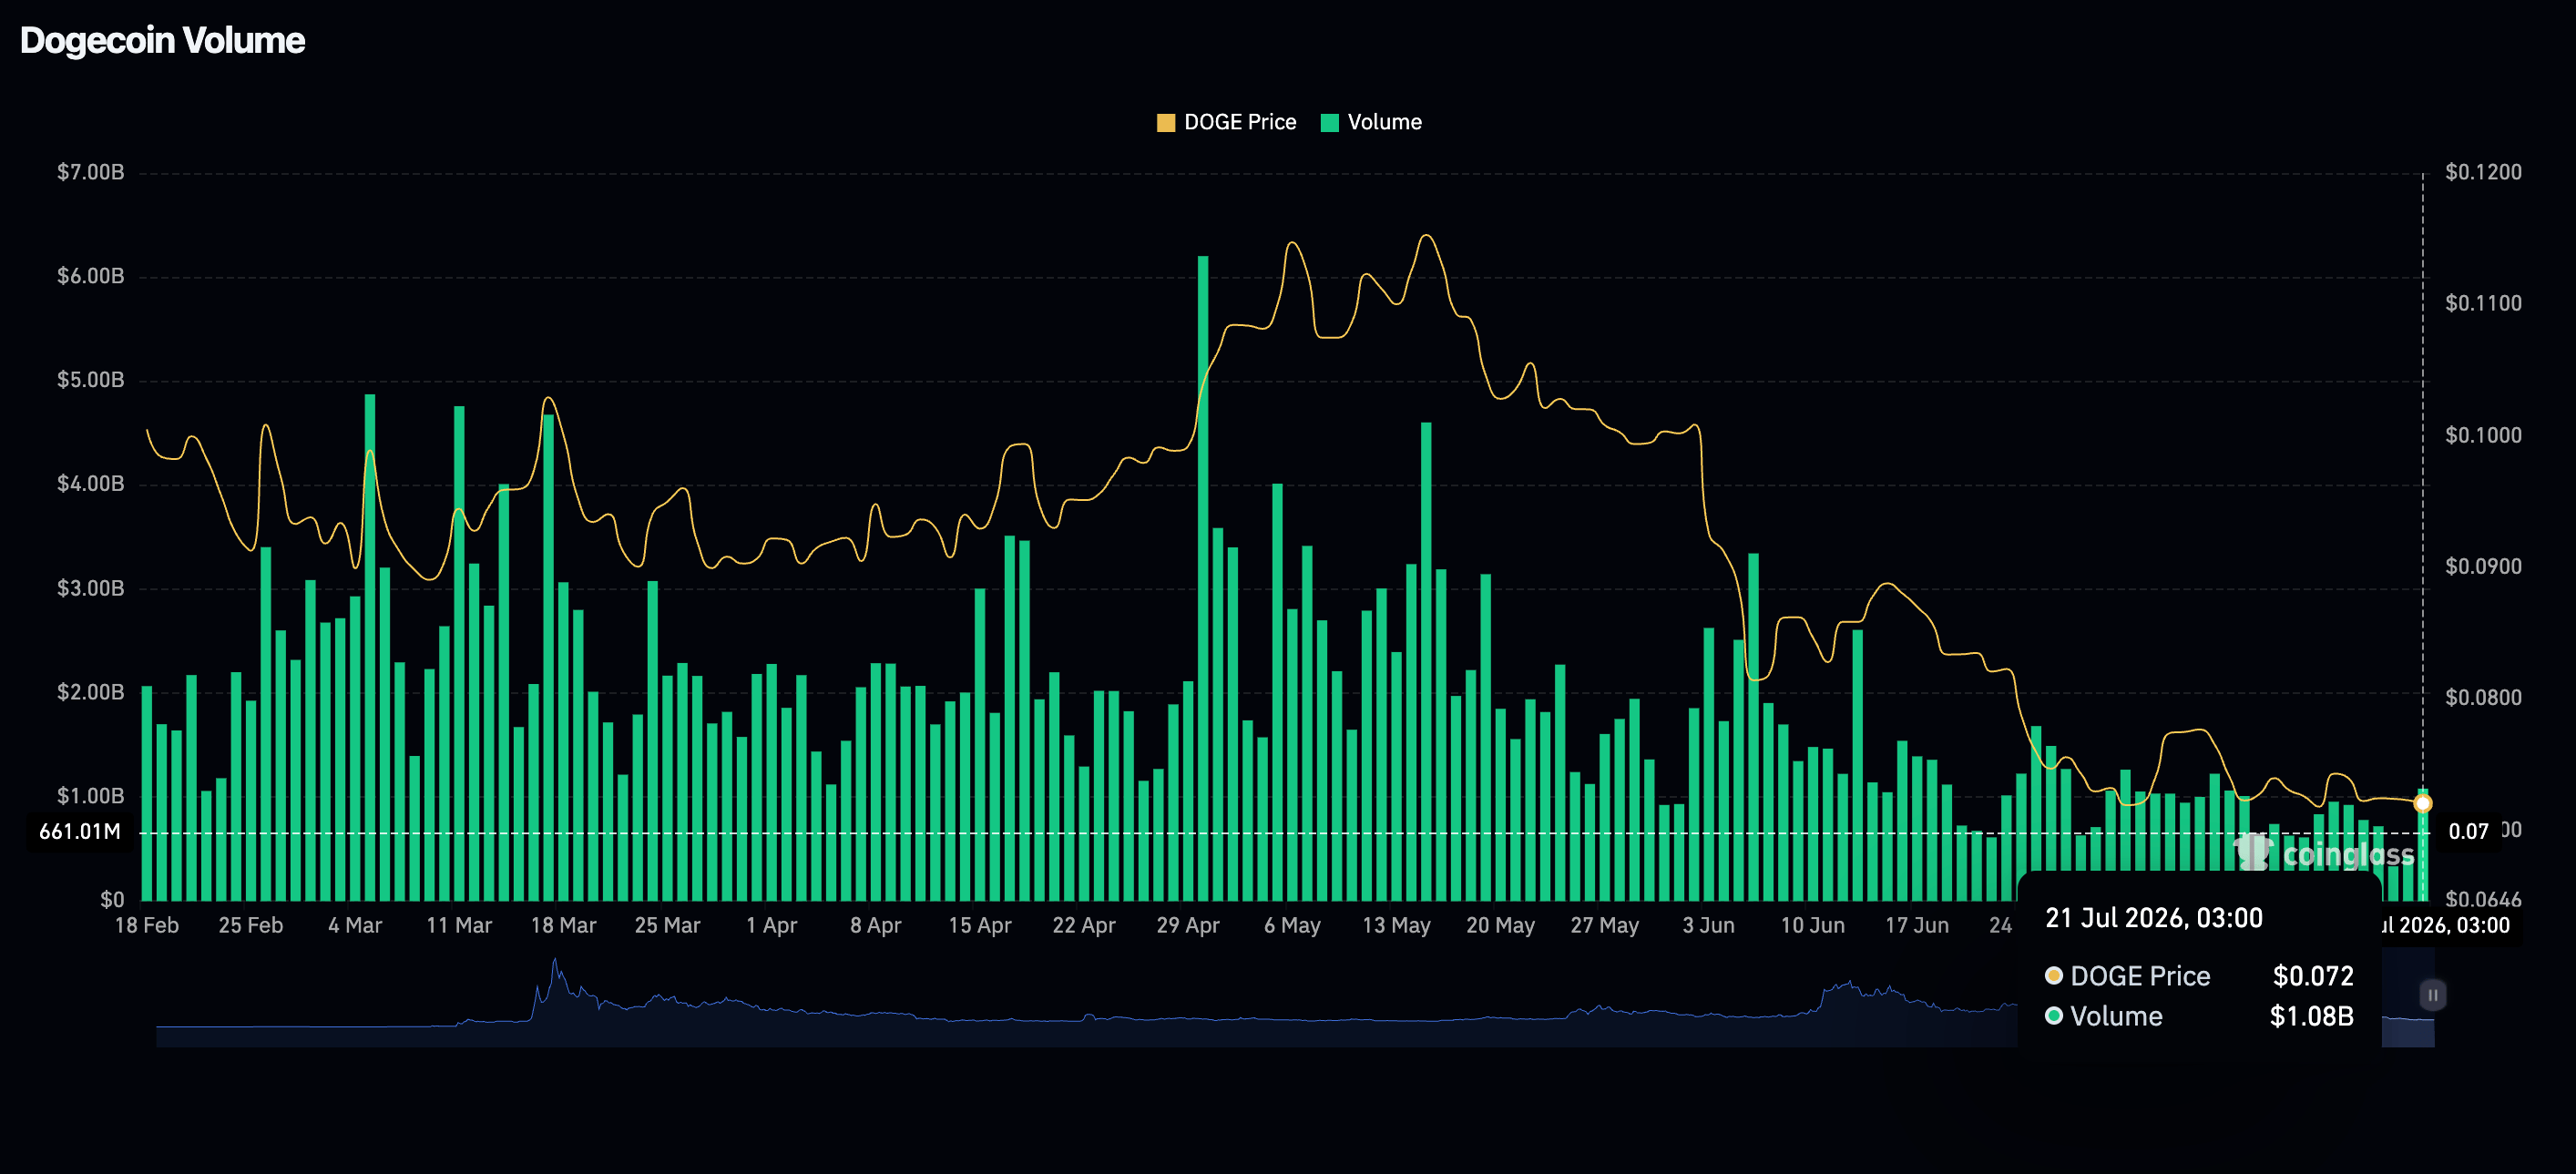
Meanwhile, trading volume has more than doubled to $1.02 billion from $438 million the day before and $336 million last Sunday, reinforcing the positive change in the derivatives market.
Price analysis: Dogecoin ticks up amid a broader bearish outlook
Dogecoin trades at $0.0734 after a brief increase on the day. However, the meme coin retains a bearish near-term bias as price remains well below the 50-day, 100-day and 200-day Exponential Moving Averages (EMAs) at $0.0798, $0.0877 and $0.1047, respectively. The pair has reclaimed the former downward trendline barrier around $0.0709, which now acts as underlying support.
Meanwhile, the Relative Strength Index (RSI) near 43 and a mildly positive Moving Average Convergence Divergence (MACD) reading only hint at tentative stabilization rather than a clear bullish shift.
-1784645572450.png)
Initial resistance lies at the 50-day EMA at $0.0798, ahead of the 100-day EMA at $0.0877, with the longer-term 200-day EMA at $0.1047 reinforcing a broader bearish structure as long as DOGE trades beneath it. On the downside, the first notable support aligns with the trendline break level at $0.0709. A daily close below that floor would reopen the path toward fresh lows, while holding above it keeps the pair in a sideways-to-softly bearish consolidation under the key moving average cluster.
(The technical analysis of this story was written with the help of an AI tool. Know more.)
Open Interest, funding rate FAQs
Higher Open Interest is associated with higher liquidity and new capital inflow to the market. This is considered the equivalent of increase in efficiency and the ongoing trend continues. When Open Interest decreases, it is considered a sign of liquidation in the market, investors are leaving and the overall demand for an asset is on a decline, fueling a bearish sentiment among investors.
Funding fees bridge the difference between spot prices and prices of futures contracts of an asset by increasing liquidation risks faced by traders. A consistently high and positive funding rate implies there is a bullish sentiment among market participants and there is an expectation of a price hike. A consistently negative funding rate for an asset implies a bearish sentiment, indicating that traders expect the cryptocurrency’s price to fall and a bearish trend reversal is likely to occur.
Recommended Articles


