


Gold price rallies amid Gulf war strikes, strong US Dollar
- Trump weighs ceasefire or full-scale Iran war, lifting safe-havens.
- Rising Oil prices fuel inflation and Fed hike concerns.
- Jobless claims and Fed decision anchor next policy catalyst.
Gold price surges on Tuesday during the North American session, up by more than 1.50% amid continued missile strikes between the US and Iran despite mediators' efforts to end the war. The XAU/USD trades at $4,071
XAU/USD gains as ceasefire doubts revive safe-haven demand
The yellow metal is gathering traction even as US Treasury yields and the Greenback register gains. Oil prices are also rising as Ansar Allah threatens to attack vessels in the Red Sea, adding to fears for Crude supply disruptions.
Newswires revealed that the US is demanding a longer ceasefire and partial navigation in Hormuz. Meanwhile, Iran proposed a 10-day ceasefire.
Other news showed that US President Donald Trump is considering whether to accept Iran’s 10-day ceasefire or to launch a full-scale war on Iran. A US official hinted that if the President chooses the latter, the strikes could target Tehran and Iran’s nuclear sites.
This week, the US economic calendar is quiet. The ADP Employment Change 4-week average decreased to 16.5K from 19.25K. On Wednesday, the docket is absent, followed by Thursday’s Initial Jobless Claims, leading up to the Federal Reserve’s (Fed) monetary policy meeting on July 29.
In the meantime, the US 10-year Treasury yield is rising by nearly 3.5 basis points to 4.628%, usually a headwind for Bullion, which tends to edge lower due to its non-yielding nature. Consequently, the US Dollar Index (DXY), which measures the US Dollar against six others, advances 0.12% to 101.11.
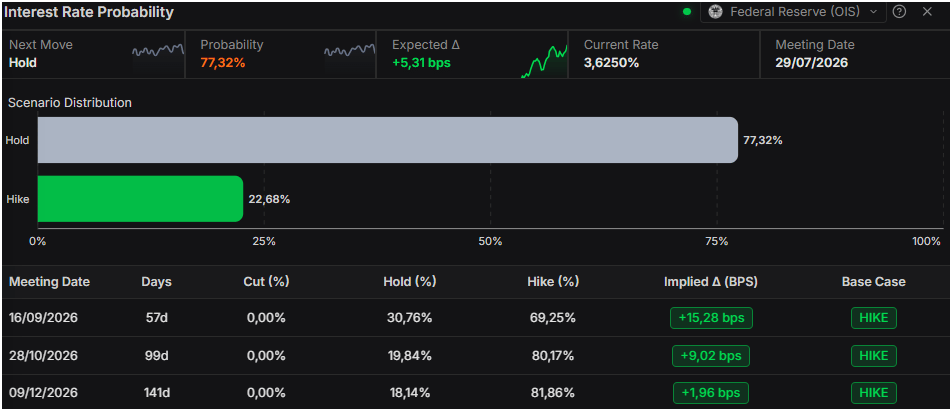
Expectations that the Fedmight increase the pace of rate hikes in 2026 are surging, driven by elevated Oil prices as Gulf supply disruptions stoke inflation fears and fuel speculation of higher interest rates for a longer period.
Prime Terminal data indicates a 78% probability that the Fed will hold rates steady at next week’s meeting, while the likelihood of a September hike is about 68%.
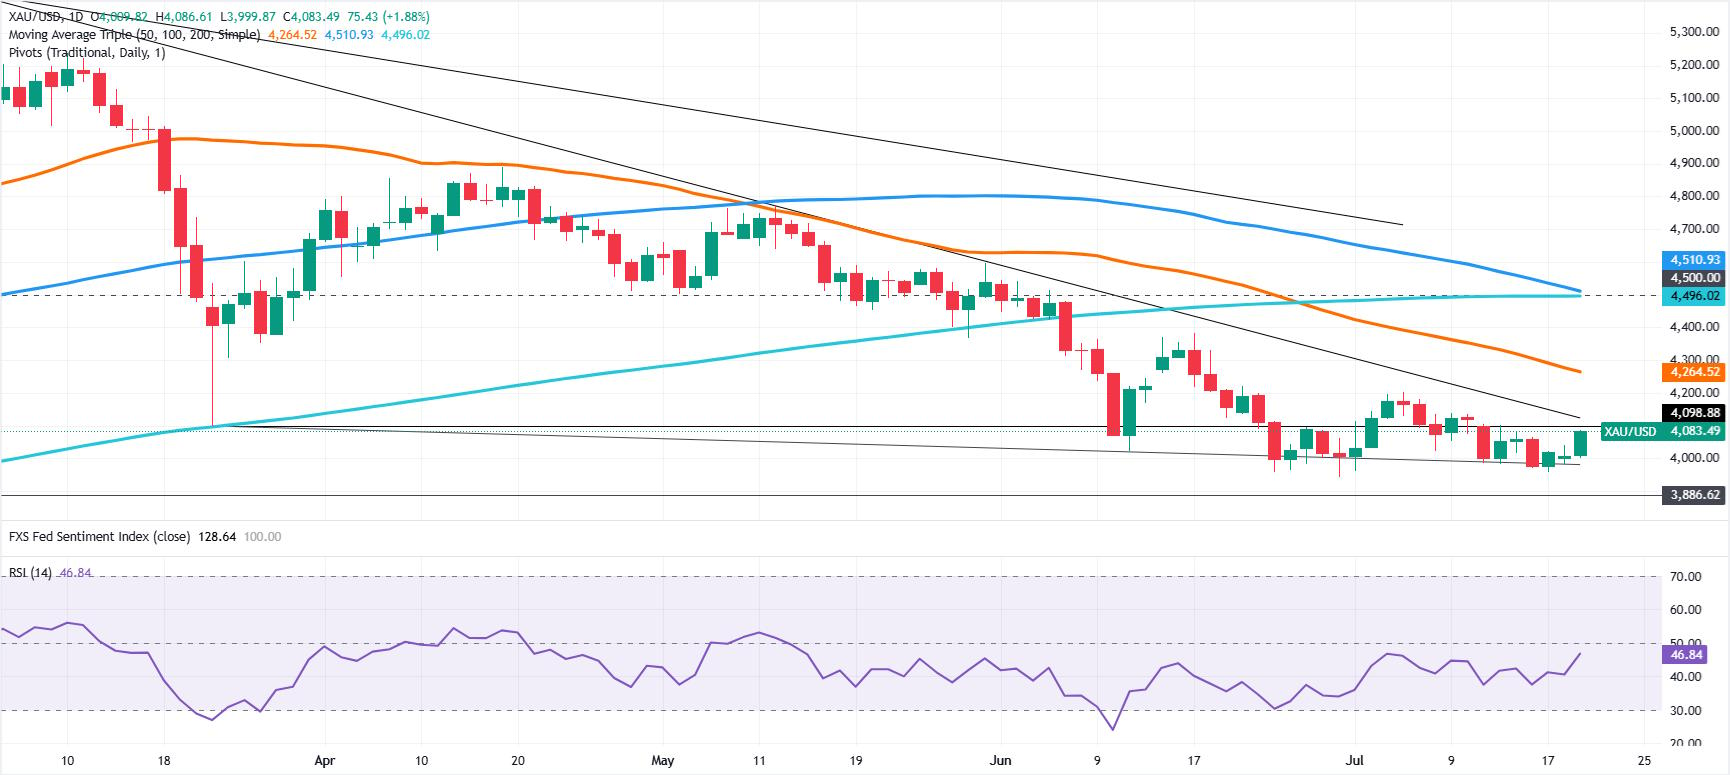
XAU/USD technical outlook: Gold price recovers yet is poised to consolidate
Gold is poised to continue trending sideways, though it’s trading near five-day highs approaching $4,100. Momentum is moderately bullish in the short term as the Relative Strength Index (RSI) is approaching the 50-neutral level.
From a market structure perspective, the trend is downward. To restart an upward trend, Gold needs to clear the resistance trendline circa $4,125. Once cleared, the next higher-high will be the July 10 high at $4,134, ahead of the July 6 peak at $4,202. A breach of the latter will put the 50-day Simple Moving Average (SMA) at $4,264 into play.
For a bearish continuation, Bullion needs to clear the $4,000 mark. Below is the July 17 low at $3,959, followed by $3,900. If sellers continue to drive prices lower, the next area of interest would be the October 28, 2025 low of $3,886.
Gold FAQs
Gold has played a key role in human’s history as it has been widely used as a store of value and medium of exchange. Currently, apart from its shine and usage for jewelry, the precious metal is widely seen as a safe-haven asset, meaning that it is considered a good investment during turbulent times. Gold is also widely seen as a hedge against inflation and against depreciating currencies as it doesn’t rely on any specific issuer or government.
Central banks are the biggest Gold holders. In their aim to support their currencies in turbulent times, central banks tend to diversify their reserves and buy Gold to improve the perceived strength of the economy and the currency. High Gold reserves can be a source of trust for a country’s solvency. Central banks added 1,136 tonnes of Gold worth around $70 billion to their reserves in 2022, according to data from the World Gold Council. This is the highest yearly purchase since records began. Central banks from emerging economies such as China, India and Turkey are quickly increasing their Gold reserves.
Gold has an inverse correlation with the US Dollar and US Treasuries, which are both major reserve and safe-haven assets. When the Dollar depreciates, Gold tends to rise, enabling investors and central banks to diversify their assets in turbulent times. Gold is also inversely correlated with risk assets. A rally in the stock market tends to weaken Gold price, while sell-offs in riskier markets tend to favor the precious metal.
The price can move due to a wide range of factors. Geopolitical instability or fears of a deep recession can quickly make Gold price escalate due to its safe-haven status. As a yield-less asset, Gold tends to rise with lower interest rates, while higher cost of money usually weighs down on the yellow metal. Still, most moves depend on how the US Dollar (USD) behaves as the asset is priced in dollars (XAU/USD). A strong Dollar tends to keep the price of Gold controlled, whereas a weaker Dollar is likely to push Gold prices up.
Recommended Articles


