

Pi Network Price Forecast: PI holds at key support amid mainnet upgrade announcement

Source Fxstreet
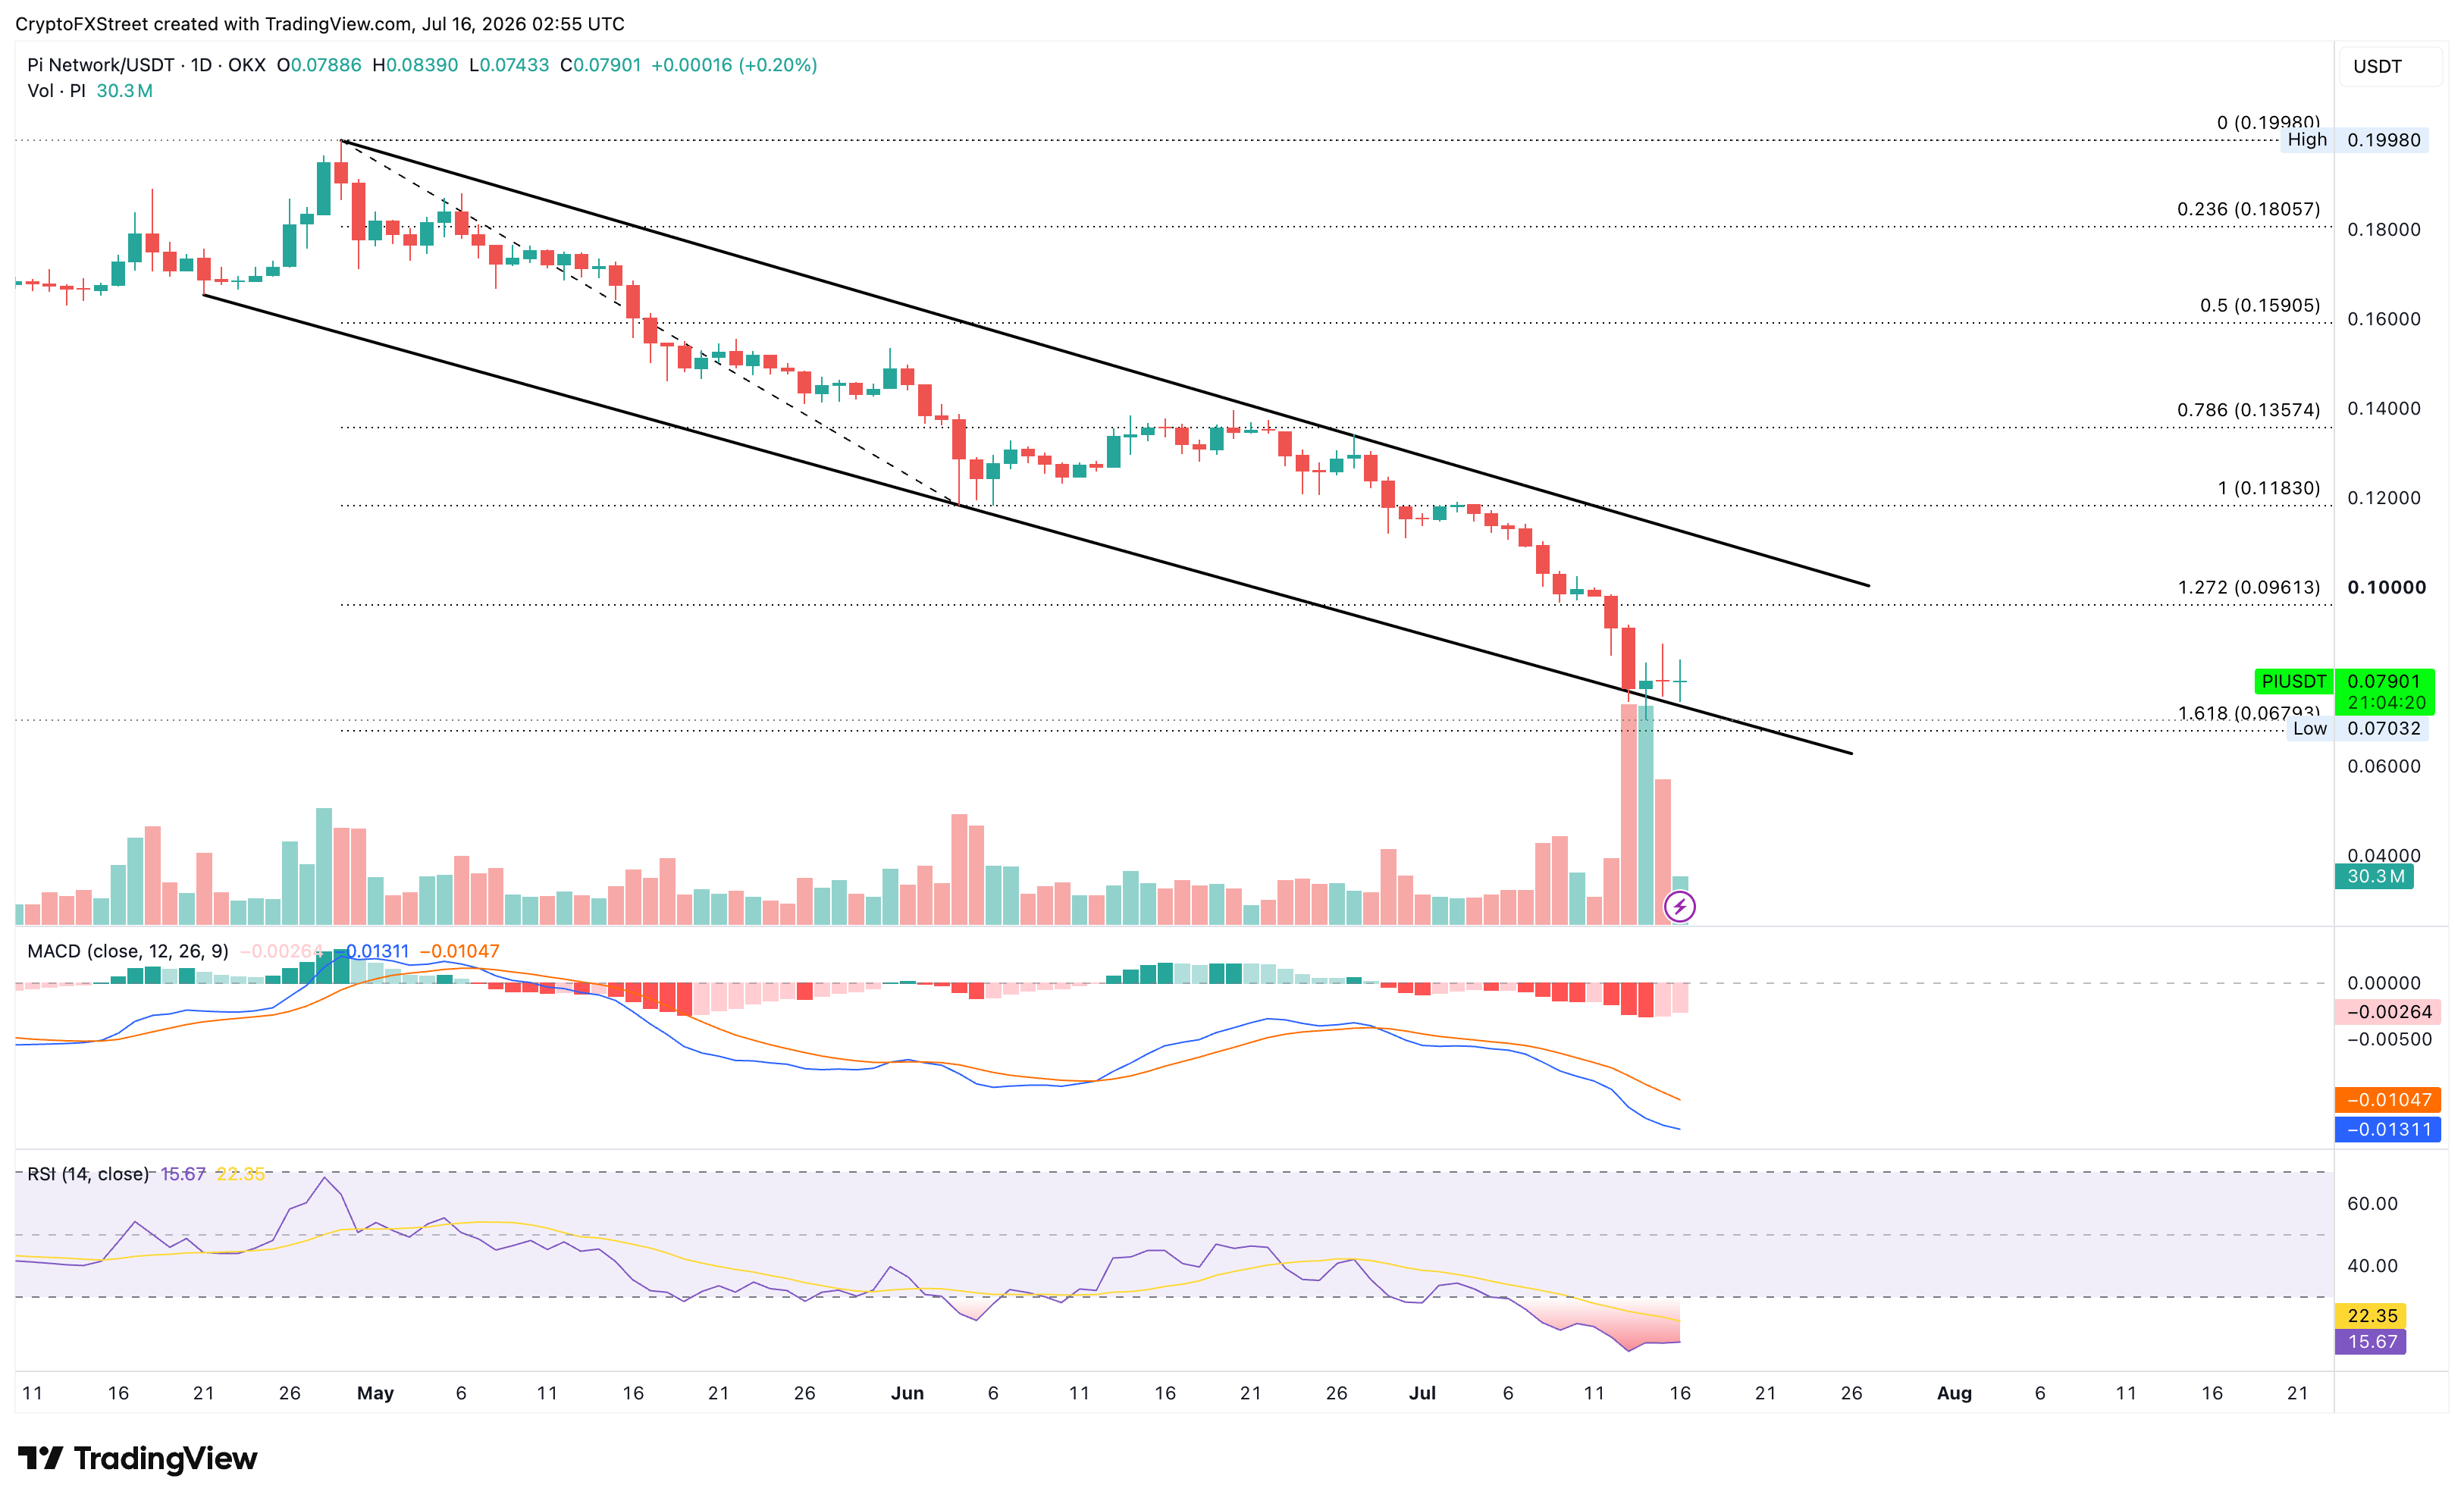
  • Pi Network hovers above $0.07500 on Thursday, holding above the lower support trendline of a falling channel pattern.
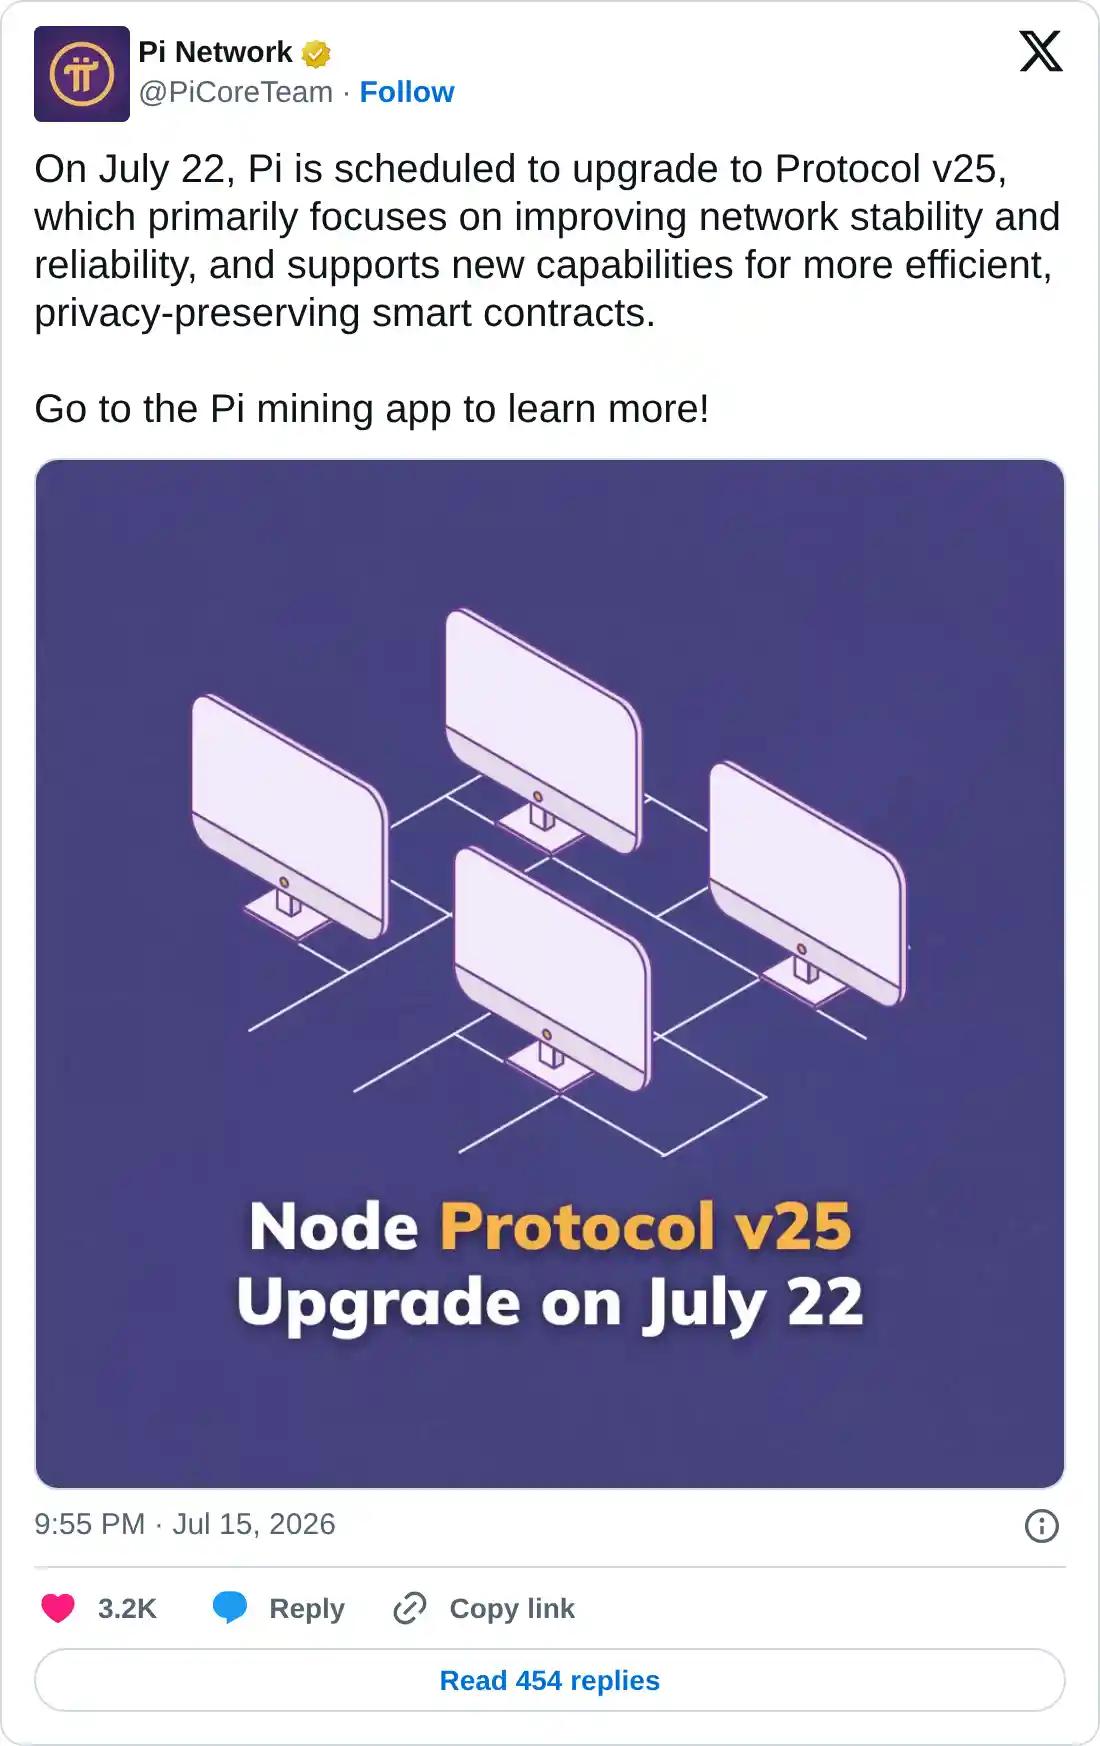
  • Pi Network announced that the Stellar protocol version 25 upgrade is scheduled for July 22.
  • The technical outlook for PI shifts away from a clear bearish bias as selling pressure eases.

Pi Network (PI) price continues to maintain a consolidative tone on Thursday, halting the prevailing declining trend near a descending support trendline around $0.0730. The announcement of the upcoming mainnet upgrade to the Stellar Protocol version 25 helps limit the selling pressure. The technical outlook for PI suggests a potential rebound, as bearish momentum remains oversold. 

Mainnet upgrade eases bearish pressure

Pi Network announced the upcoming mainnet upgrade in a social media post on Thursday, advancing to the Stellar Protocol version 25 on July 22. Pi Network is built on the Stellar blockchain, and these upgrades drive the mainnet closer to version 26, which could unlock smart contract functionality for mainnet users. 
https://x.com/PiCoreTeam/status/2077512388727751100

Technical outlook: Will PI hold above its last line of defense?

Pi Network remains stable below $0.0750 at press time on Thursday, extending a consolidative trend for the third consecutive day. The sideways shift marks early signs of PI token shifting away from the prevailing bearish phase, accounting for over a 40% decline in the last three weeks.

Momentum on the daily chart reaffirms that the PI token remains pressured as the Relative Strength Index (RSI) at 14 hovers in deeply oversold territory. At the same time, the Moving Average Convergence Divergence (MACD) stays negative, hinting that downside momentum is still dominant despite overstretched conditions.

From a technical perspective, PI holds at the lower support trendline of a falling channel pattern on the daily chart, which typically results in a rebound. Looking up, the 127.2% Fibonacci extension level, measured over the downswing from $0.1998 to $0.1183, at $0.09613, serves as the initial overhead barrier for a potential rebound in PI.
PI/USDT daily price chart.


On the downside, the 161.8% Fibonacci extension level at $0.0679 acts as the last line of defense, where a decisive close could confirm a bearish breakout of the falling channel pattern.

(The technical analysis of this story was written with the help of an AI tool. Know more.)

Disclaimer: For information purposes only. Past performance is not indicative of future results.
placeholder
XRP Price Prediction for July 2026: Can Buyers Finally Break the Downtrend?XRP (XRP) price trades near $1.05, caught between a year-long downtrend and a sudden burst of buying.July has historically rewarded XRP holders. This year the month arrives with on-chain accumulation
Author  Beincrypto
6 Month 30 Day Tue
XRP (XRP) price trades near $1.05, caught between a year-long downtrend and a sudden burst of buying.July has historically rewarded XRP holders. This year the month arrives with on-chain accumulation
placeholder
Smart Money is Leaving Nvidia for This AI Chip StockNvidia stock price keeps sliding, yet the usual dip buyers are missing. Institutional money flow on the stock is the most negative of any major chip name, which means big investors are stepping back i
Author  Beincrypto
6 Month 30 Day Tue
Nvidia stock price keeps sliding, yet the usual dip buyers are missing. Institutional money flow on the stock is the most negative of any major chip name, which means big investors are stepping back i
placeholder
What to Expect From Ethereum (ETH) in July 2026Ethereum (ETH) enters July 2026 trading near $1,570, close to multi-month lows, after recording its first run of three consecutive red quarterly candles in its history.On-chain data and price charts n
Author  Beincrypto
7 Month 01 Day Wed
Ethereum (ETH) enters July 2026 trading near $1,570, close to multi-month lows, after recording its first run of three consecutive red quarterly candles in its history.On-chain data and price charts n
placeholder
NVIDIA Price Forecast: Michael Burry Shorts NVDA, but Analysts See $299On July 1, NVIDIA (NASDAQ: NVDA) sits at $198.34, failing to break above the former support level that is now serving as resistance between $198 and $205 on the 2H chart's downward blue c
Author  TradingKey
7 Month 02 Day Thu
On July 1, NVIDIA (NASDAQ: NVDA) sits at $198.34, failing to break above the former support level that is now serving as resistance between $198 and $205 on the 2H chart's downward blue c
placeholder
Meta Compute Launch Sends AI Compute Stocks Tumbling GloballyMeta’s plan to sell surplus computing power hit chip stocks hard on Wall Street. Meta’s own shares climbed nearly 9% on the news.The announcement flipped years of assumed AI compute scarcity into a su
Author  Beincrypto
7 Month 02 Day Thu
Meta’s plan to sell surplus computing power hit chip stocks hard on Wall Street. Meta’s own shares climbed nearly 9% on the news.The announcement flipped years of assumed AI compute scarcity into a su
goTop
quote