


Crypto Market Overview: Bitcoin holds at $62,000 – Pi Network, Worldcoin lead losses
- Bitcoin edges higher to above $62,000 on Tuesday following a 2% drop the previous day.
- Risk-off market sentiment builds as US President Donald Trump formally notified Congress about the war with Iran.
- Pi Network and Worldcoin emerge as the worst performers over the last 24 hours.
The broader cryptocurrency market risk-off sentiment builds as US President Donald Trump formally declares war with Iran to the US Congress. Bitcoin (BTC) holds at $62,000 on Tuesday, while Pi Network (PI) and Worldcoin (WLD) are leading losses over the last 24 hours.
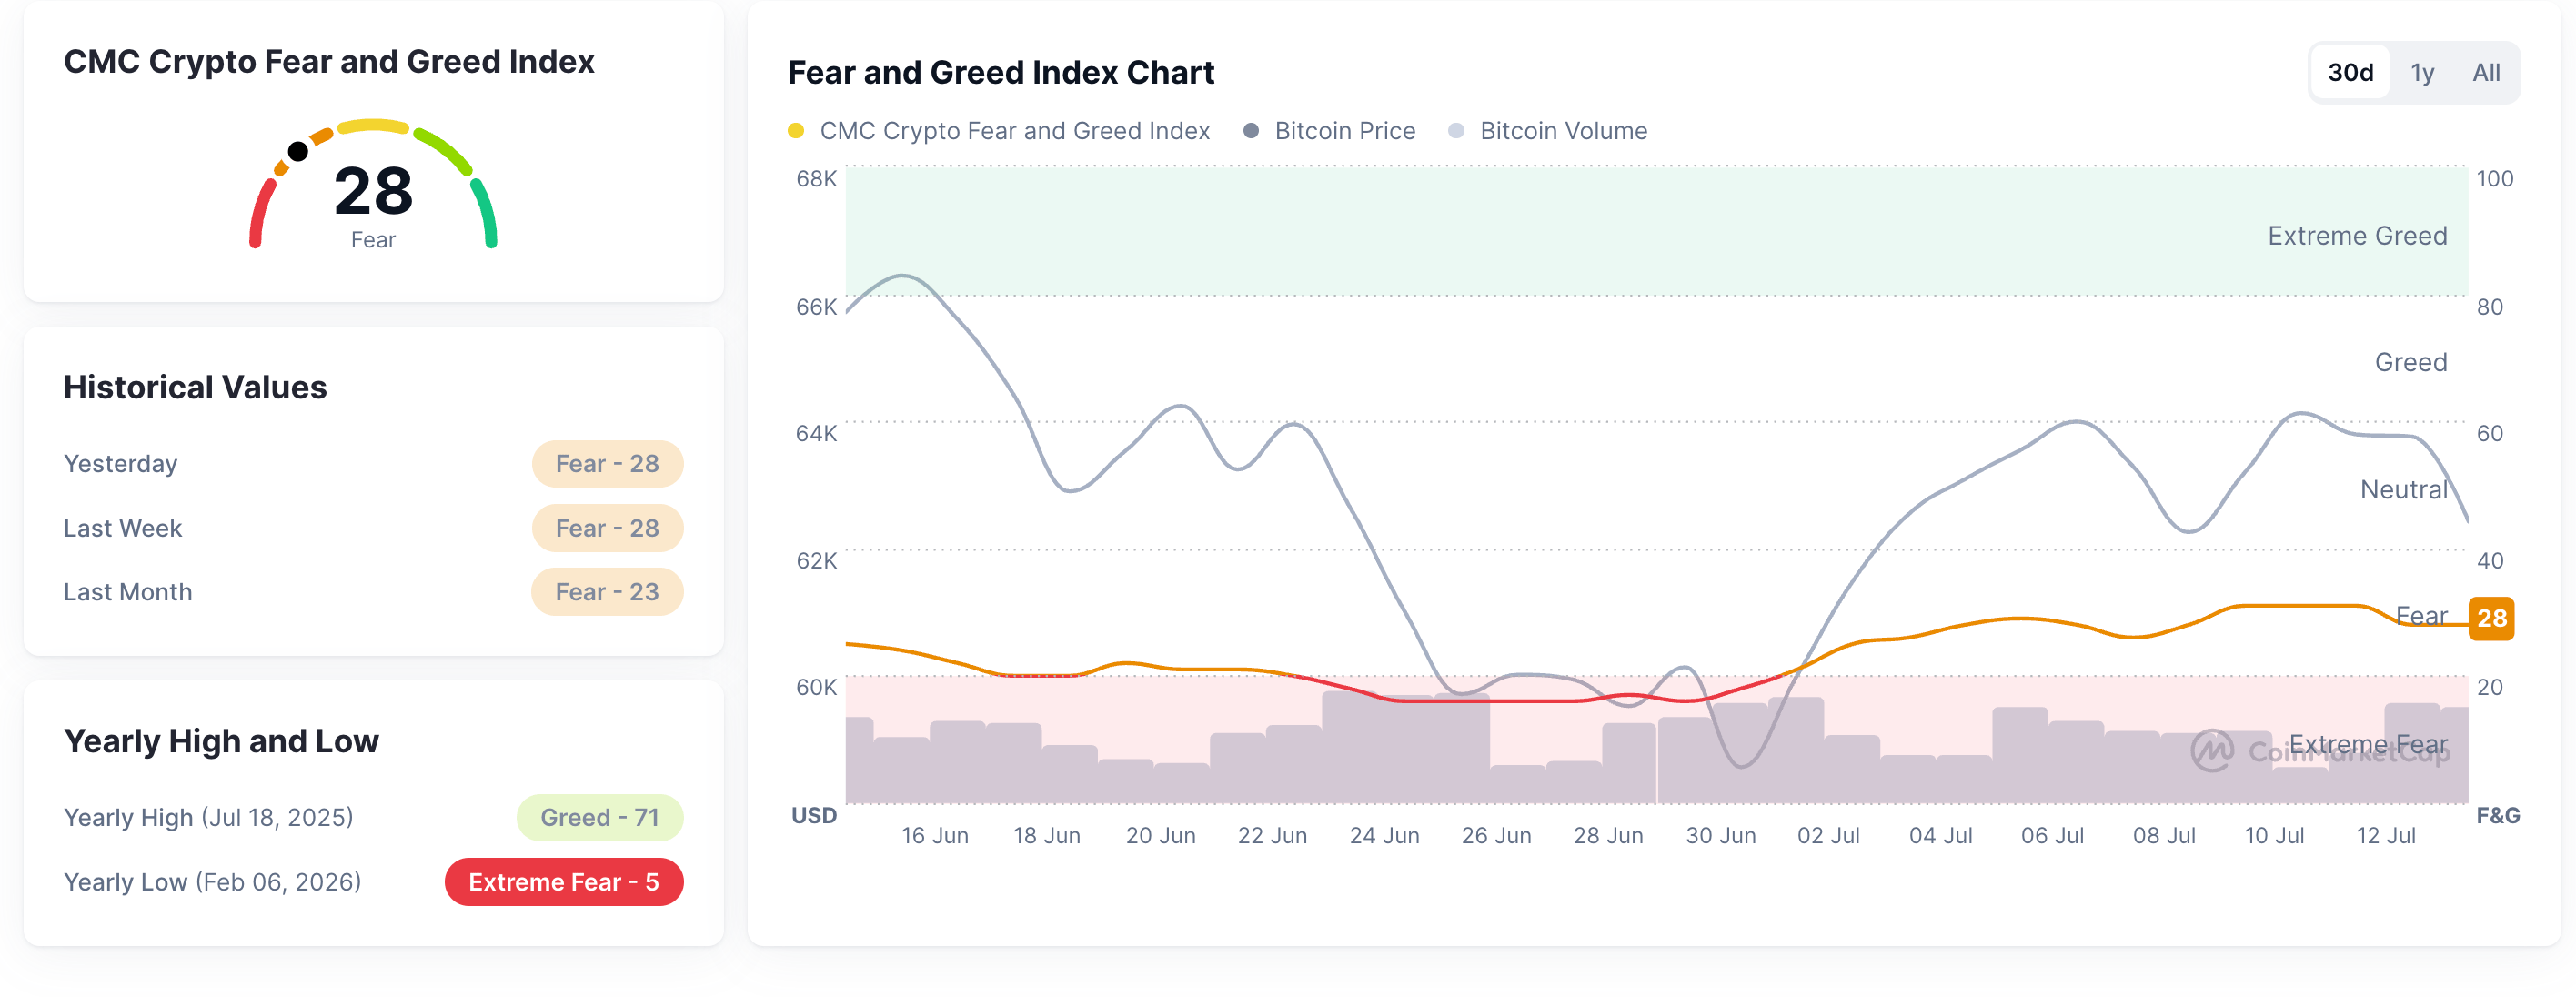
CoinMarketCap’s Fear and Greed Index is at 28 on Tuesday, down from 31 on Sunday, reaffirming the declining risk appetite in the industry.
Bitcoin nears $60,000 amid renewed pressure
Bitcoin trades near $62,000 on Tuesday, after a 2% drop the previous day, keeping the near-term trend trapped below the 50-day Exponential Moving Average (EMA) at $65,070. The reversal risks a retest of the $60,000 psychological level, with the swing low near $58,115 in place.
Momentum signals are comparatively modest, with the Relative Strength Index (RSI) hovering around a neutral 46.9 and the Moving Average Convergence Divergence (MACD) staying in positive territory but not yet strong enough to challenge the dominant downside structure.
Looking up, a potential breakout of the 50-day EMA at $65,070 could extend the rally to the $70,000 mark.
Pi Network and Worldcoin poised for further decline
Pi Network trades at a record low level near $0.0740 on Tuesday, testing the breakout below a descending support trendline of a falling channel pattern. The PI token targets the 161.8% Fibonacci extension level at $0.0679 as immediate support, measured from the downswing from $0.1998 to $0.1183, where a daily close could extend its decline to steeper levels.
The MACD and signal line extend the declining trend, with expanding negative histograms indicating firm bearish momentum, while the RSI near 11 keeps the pair deeply oversold, suggesting that, while downside pressure is dominant, short-term bounces cannot be ruled out.
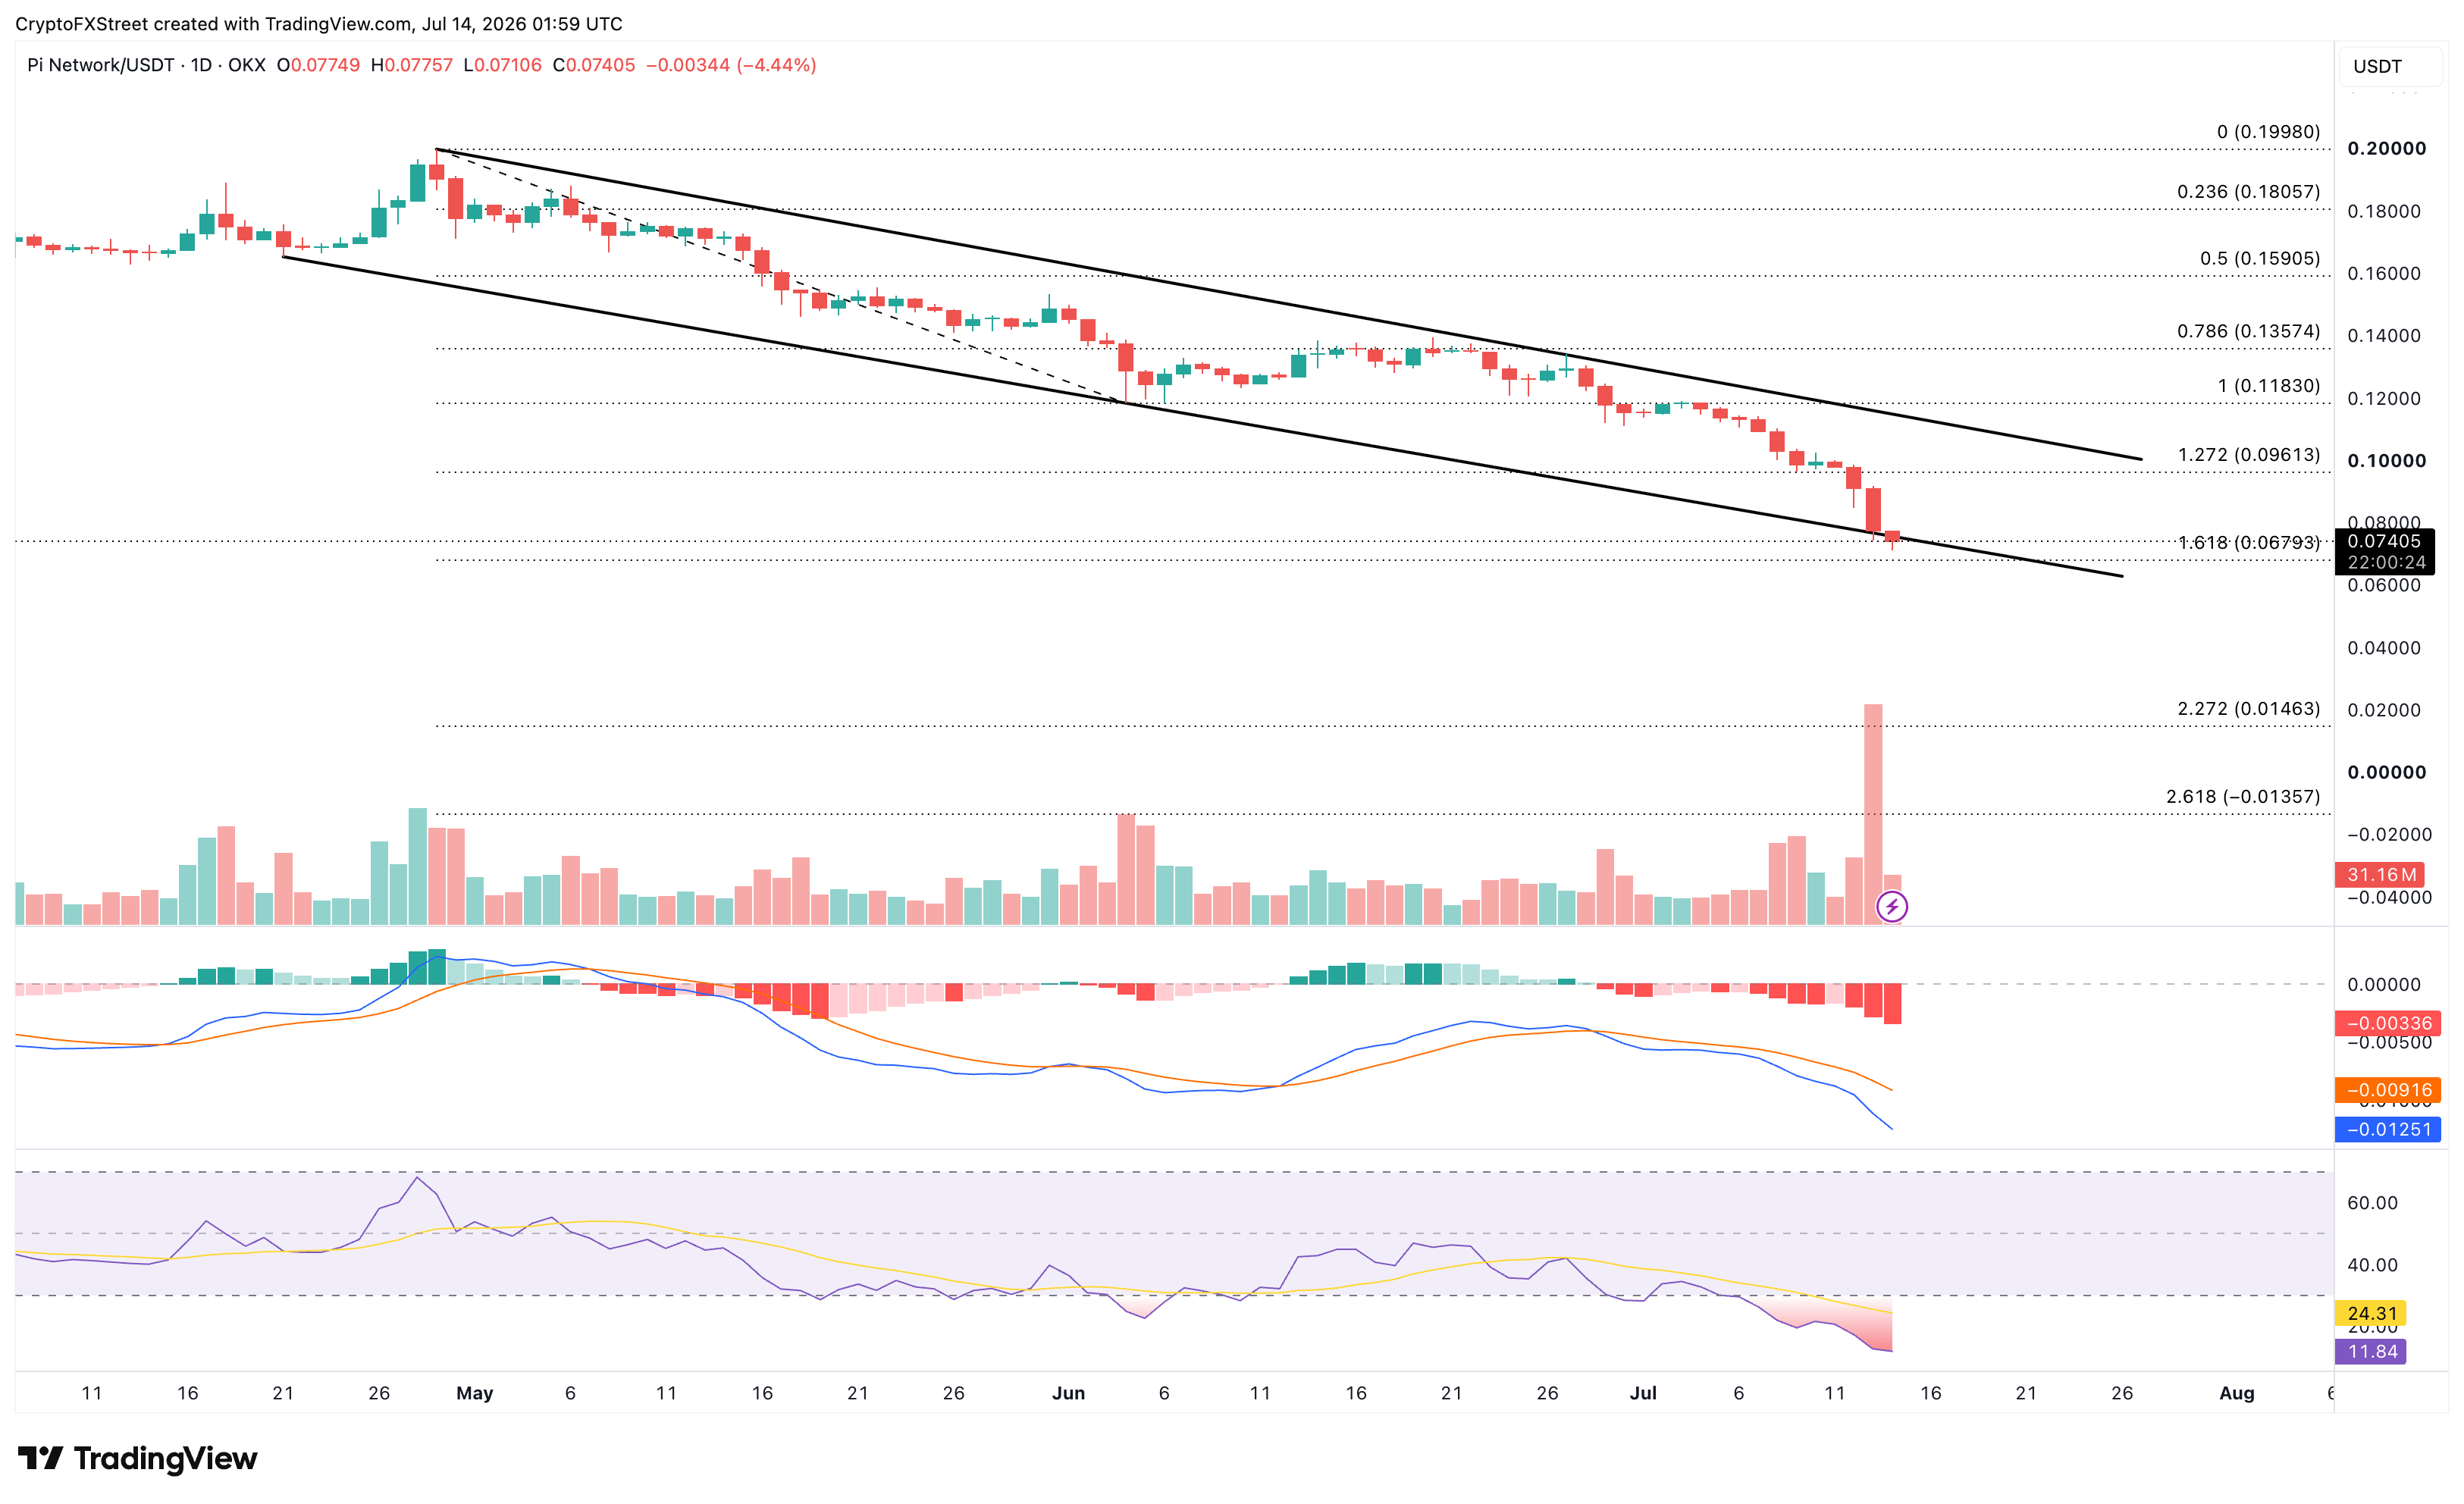
Looking up, a potential rebound in the bearish setup from the support trendline could test the 127.2% Fibonacci level at $0.0961.
Worldcoin trades below $0.4000 at press time on Tuesday, following a 6% decline the previous day. The 50-day EMA at $0.4268 caps the near-term trend, pushing WLD price below the 50% retracement at $0.4048, measured from $0.7229 to $0.2267. A steady decline below could target the 23.6% Fibonacci retracement level at $0.2980.
That said, the RSI at about 42 still leans toward softness, while the MACD remains marginally below its signal line, suggesting downside pressure persists despite the latest stabilization.
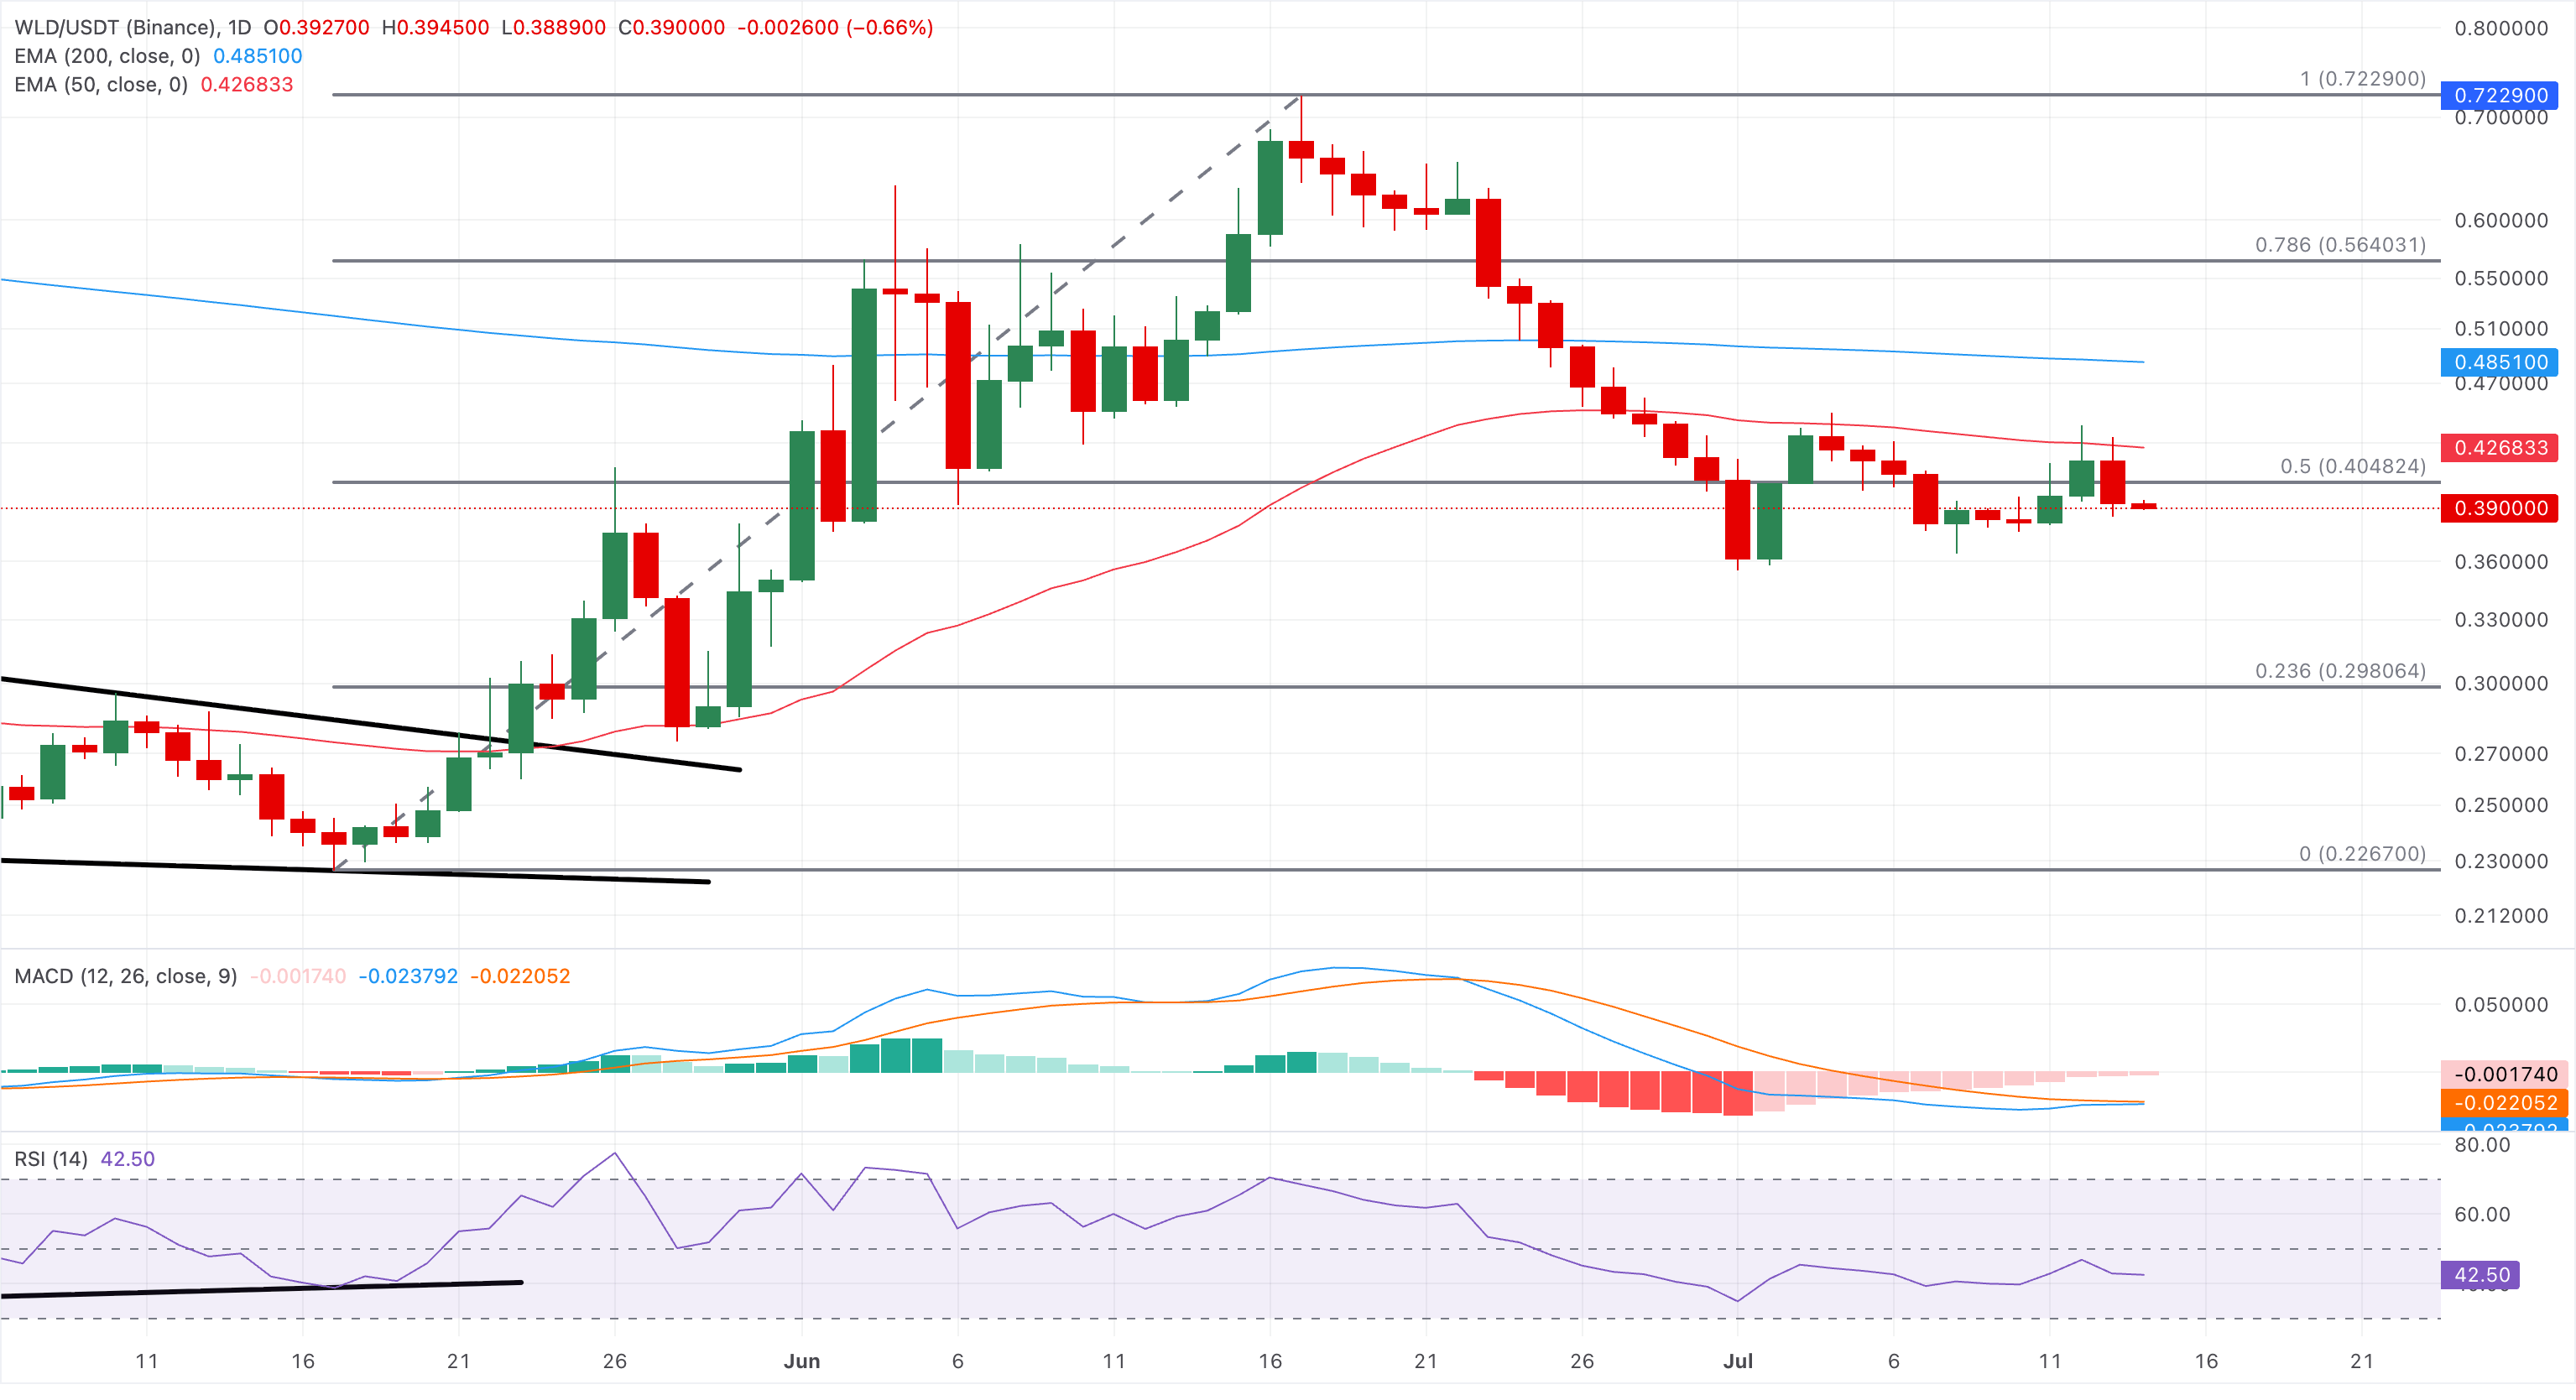
Looking up, the 50-day and 200-day EMAs at $0.4268 and $0.4851, respectively, serve as key resistance levels.
(The technical analysis of this story was written with the help of an AI tool. Know more.)
Recommended Articles


