


Bitcoin Price Prediction: BTC Reclaims $62K Amid Iran Tensions — Is the Bottom In?
Bitcoin has been showing incredible resilience. Just when you thought the market was about to crash into oblivion, it completely flips the script. That is exactly what we witnessed over the last few days. Bitcoin dipped hard, panicked the masses, and then surged right back past the $62,000 mark.
The Bitcoin resilience is remarkable as it occurs right as geopolitical tensions between Iran and the United States spiked. The U.S. and Iran have exchanged strikes, which would normally trigger a massive sell-off. However, Bitcoin has remained above $62k, which has led investors and traders to ask the big question: Is the market bottom finally in?
Iran and U.S. Tension Heats Up After New Strikes
Just a month after a peace deal between Iran and U.S. was announced, both countries have exchanged strikes. President Donald Trump openly declared the peace agreement “over” during a NATO summit.
In response to the latest series of attacks by U.S. forces over the weekend, Iran has attacked American military bases in several Gulf countries. The recent attacks has raised tensions over the Strait of Hormuz. It also adds more questions to the future of the potential peace deal.
Oil prices immediately surged by nearly 5% on Monday morning. When the initial headlines flashed on trading screens, many expected the Bitcoin price to tumble. Despite losing the $64,000 level, the BTC price has remained above the critical $62,000 support level.
What the Technical Charts Are Telling Us
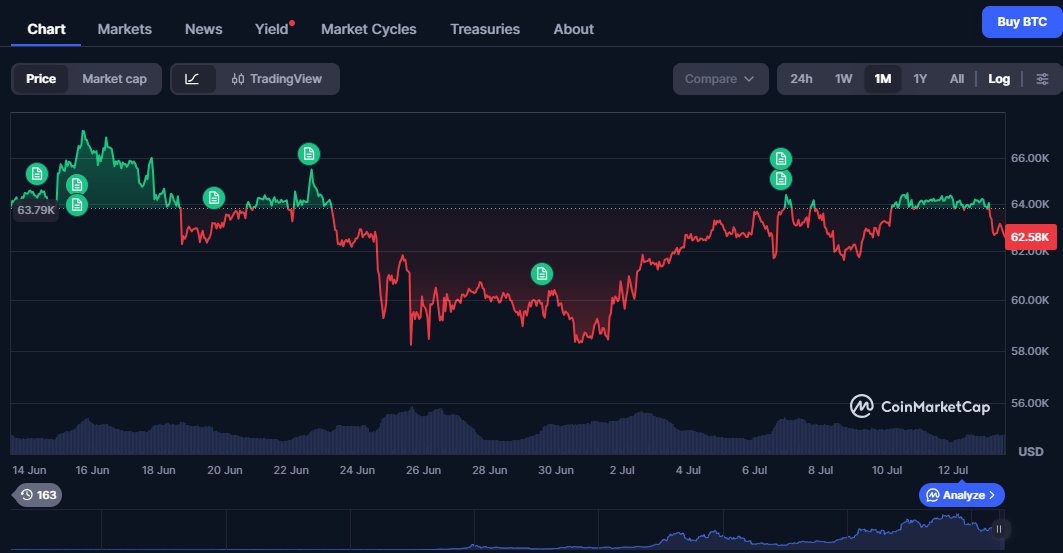
Holding $62,000 is more than a nice psychological victory for the bulls. It is a vital technical milestone. The $60,000 to $61,000 price range has acted as a massive battleground over the last few months. Breaking below it temporarily was a trap.
 Sourece: CoinMarketCap
The last time BTC price dropped below this level, we saw a crash to the $58k level. Bitcoin price above this level means buyers have absorbed the initial selling pressure. If the price of bitcoin is above this zone, the initial selling force has been taken out of the market. The chart looks better than it does on the daily time frame when Bitcoin is trading above $62,000.
The next big horizontal resistance is just about $64,000. Once the bulls get past that hurdle, then we'll likely see a quick return to all-time highs. But without keeping $62,000, it's safe to assume that Bitcoin price will continue to rise. Sellers may be running out of steam.
On-Chain Data Shows Smart Money Is Buying
If you want to know where the market is going, you have to look behind the curtain. While Bitcoin ETFs have been bleeding, on-chain data metrics reveal a very clear trend. Whale wallets did not panic sell during the drop.
Last week, Bitfinex reported that addresses holding 1,000 BTC or more added more than 270,000 BTC over two weeks while the spot premium. While the Bitcoin price has been struggling, whales added more than $16.7 billion of BTC in a 2-week window.
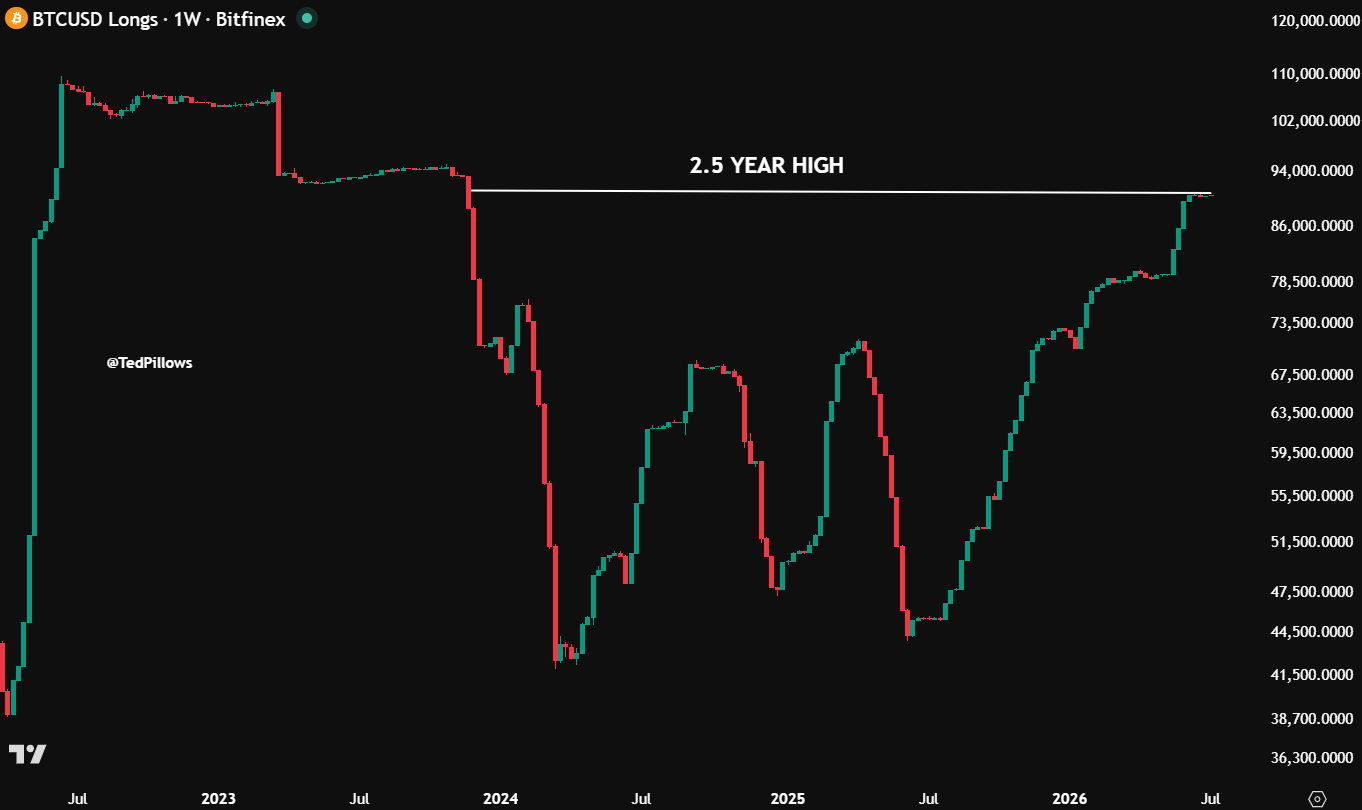
Ted Pillows confirms this trend. The analyst reports that whales have been building their long BTC positions. They historically do this during a downtrend. Now, Bitfinex whales’ $BTC long positions are now at a 2.5-year high.
 Source: TradingView
Is the Bitcoin Bottom Finally Confirmed?
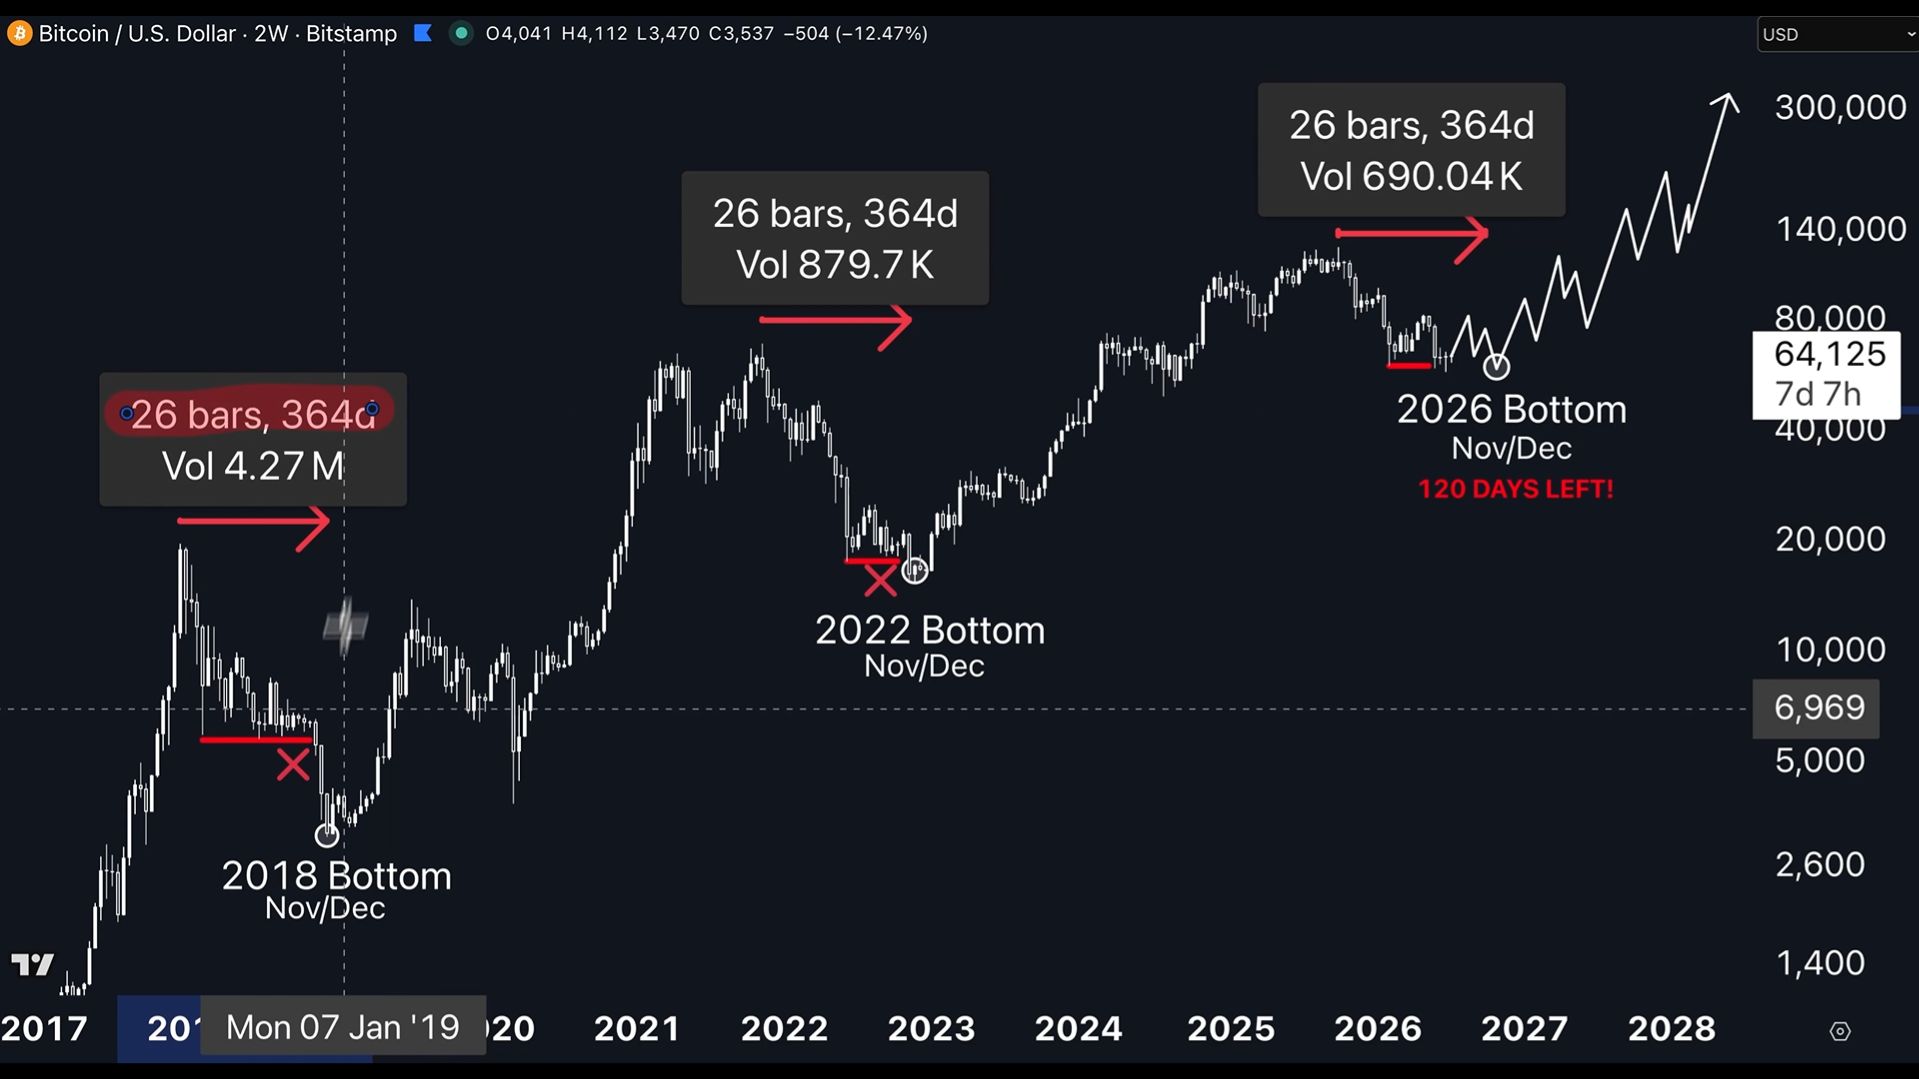
Let us look closely at market history. While Bitcoin has weathered the geopolitical scare perfectly, there’s a lot of evidence that suggests that the bottom is not in yet. Based on Bitcoin’s historical 4-year cycles, it takes 364 days from an all-time high to the bottom.
 Source: TradingView
It has happened in every single bull-bear cycle since Bitcoin launched. Based on this, there’s still 120 days left in this bear cycle. Coinvo Trading predicts that Bitcoin will continue ranging until late 2026 before we will see a bottom.
Several other traders including Ted Pillows and Ardizor share this same sentiment. According to Ardizor, Bitcoin has one last major capitulation to experience before any form of bull market can take place. Based on this prediction, Bitcoin could fall to $53,000 before we see a rally to a new all-time high.
The Bottom Line
Based on Bitcoin’s historical performance, we can conclude that the bottom is not yet in. However, reclaiming $62,000 under immense global pressure is a massive show of macroeconomic strength. It proves that buying demand below $60,000 is incredibly sticky.
While the bottom may not be perfectly locked in yet, bears are running out of steam. If you have been waiting for a true sign of market resilience, this is it. Keep your eyes on the upcoming weekly close. That print will tell the real story for the rest of the quarter. Stay cautious, but do not ignore this strength.
Recommended Articles


