


BNB Price Forecast: BNB nears channel top as bulls test breakout
- BNB nears the upper boundary of the horizontal channel on Friday, a firm close above suggests a bullish move.
- On-chain data backs a bullish bias with large orders, cooling conditions and buy-side dominance.
- However, mixed sentiment in the derivatives market continues to limit BNB’s upside momentum.
BNB (BNB), formerly known as Binance Coin, is nearing the upper boundary of its horizontal channel at $687 on Friday, where a breakout would signal a bullish move ahead. Strengthening on-chain data supports this bullish case. However, mixed sentiment among the traders in the derivatives market may continue to cap BNB’s upside momentum despite the improving spot-market structure.
On-chain data supports a bullish bias
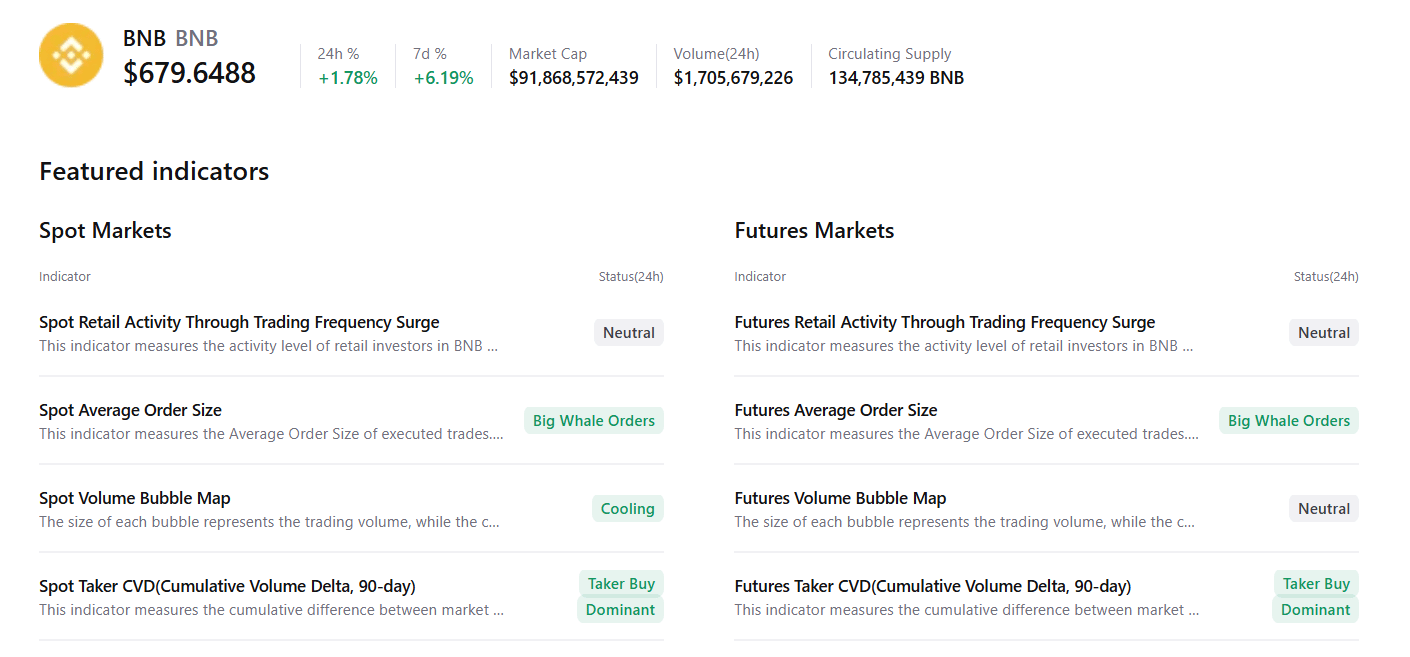
CryptoQuant summary data shows a bullish tilt. BNB’s spot and futures markets show large whale orders, cooling conditions and buy-side dominance with mostly neutral conditions across other metrics, suggesting a potential upside move.
Mixed derivatives metrics cap breakout
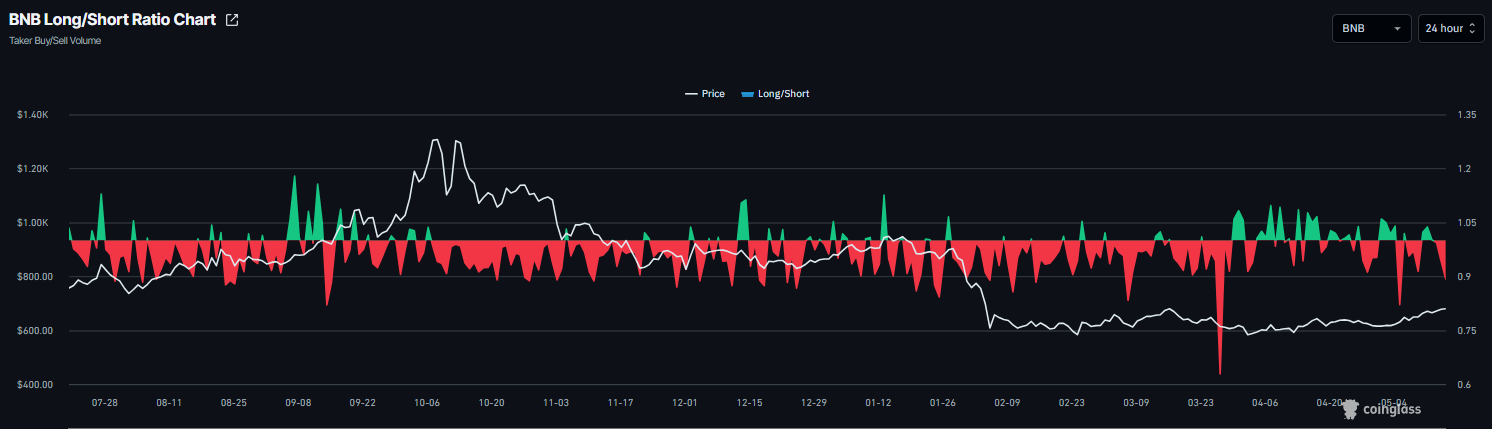
On the derivatives side, BNB data shows mixed sentiment. CoinGlass’ long-to-short ratio for BNB reads 0.89 on Friday. This ratio, being below one, reflects bearish sentiment in the market, as more traders are betting on the asset’s price to fall.
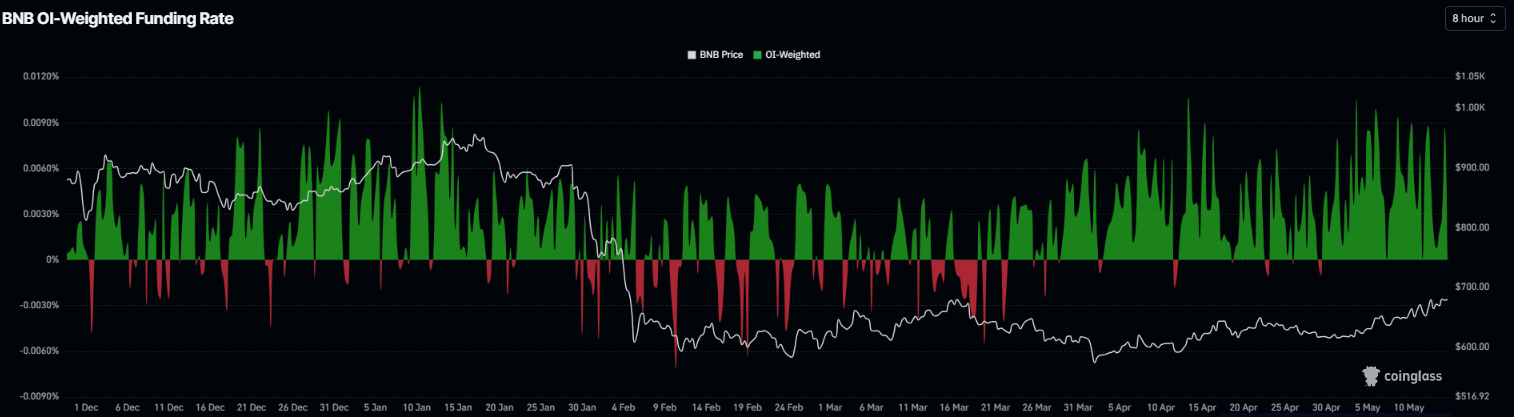
Meanwhile, the funding rates support improving sentiment. CoinGlass’ OI-Weighted Funding Rate data for BNB flipped positive on April 30 and has been positive, reading 0.006% on Friday. This positive rate indicates that longs are paying shorts and projecting a bullish sentiment.
This combination suggests indecision among investors in Binance Coin and a lack of clear directional bias, which limits the likelihood of a sustained breakout.
BNB Price Forecast: BNB on the verge of a breakout
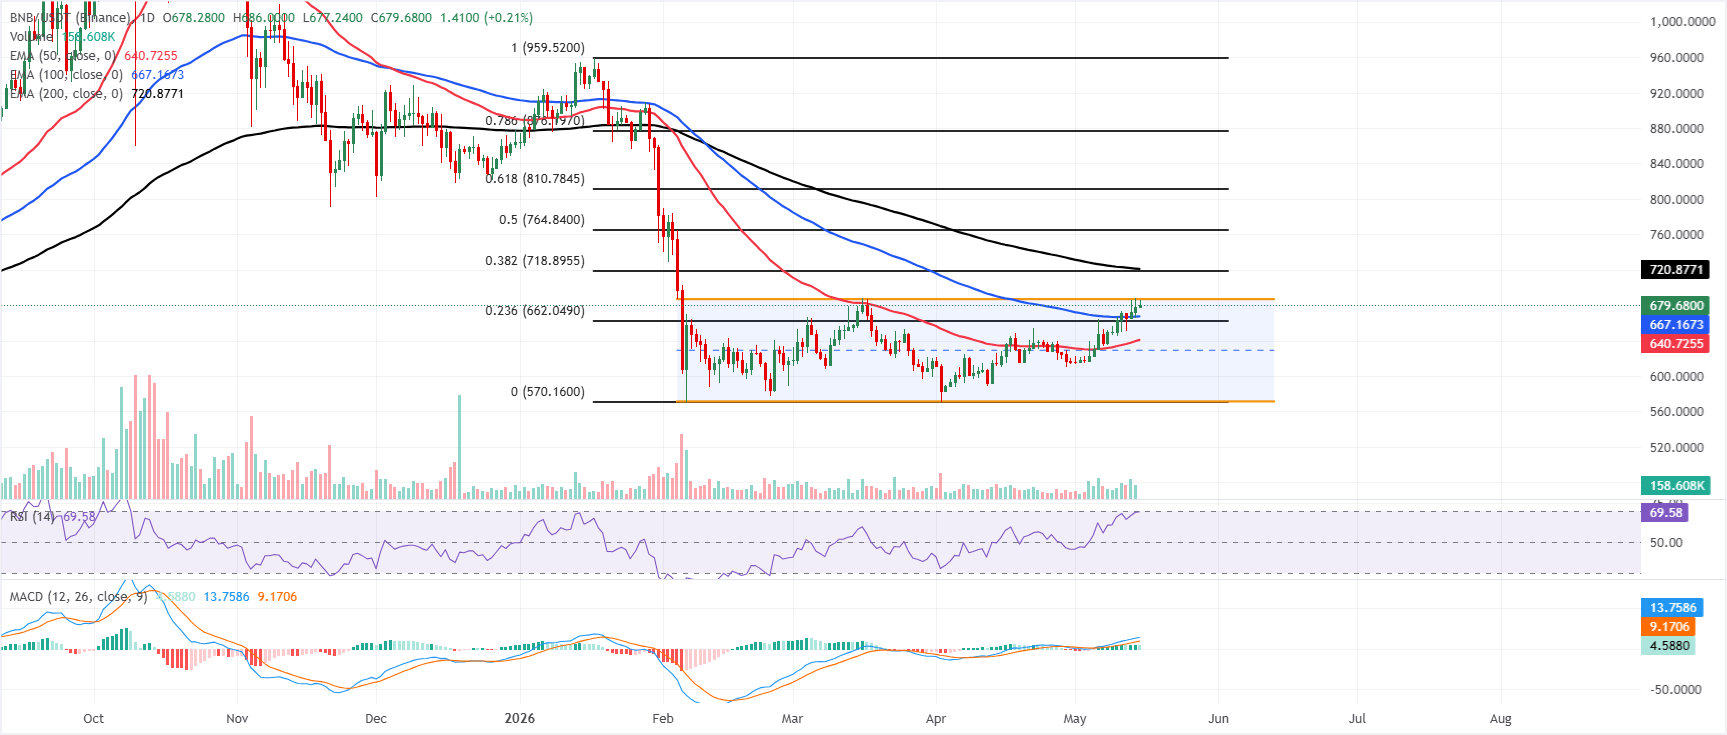
BNB is trading at $679 on Friday, maintaining a constructive bullish bias as it sits above the 50-day and 100-day Exponential Moving Averages (EMAs) at roughly $640.72 and $667.16, respectively. BNB is advancing within a downward parallel channel and is now pressing into the upper half of the structure, while the 200-day EMA near $720.87 remains a medium-term cap overhead.
Momentum remains robust, with the Relative Strength Index (RSI) on the daily chart near 70 and the Moving Average Convergence Divergence (MACD) line holding in positive territory, suggesting that buyers retain control but are nearing overbought conditions.
On the topside, initial resistance is seen at the channel top around $687.30, followed by a confluence of higher hurdles at the 38.2% Fibonacci retracement of the broader downswing near $718.90 and the 200-day EMA at about $720.87; sustained gains above these levels would open the way toward $764.84 and then $810.78.
On the downside, the 100-day EMA provides immediate support at $667.16 and the 23.6% Fibonacci retracement around $662.05, with the 50-day EMA further down near $640.72; a deeper pullback toward the channel floor and cycle base in the $570.75–$570.16 area would only come into focus if these nearer supports give way.
(The technical analysis of this story was written with the help of an AI tool.)
Recommended Articles


