

Dogecoin Price Forecast: Retail demand supports cautious push toward $0.10

Source Fxstreet
  • Dogecoin holds near $0.1000 on Friday, struggling to extend its 4% gains from the previous day. 
  • Resurfacing retail demand leads to positional buildup in DOGE derivatives, driving Open Interest to $1.39 billion. 
  • The technical outlook for DOGE is cautiously bullish, targeting the 100-day EMA at $0.1063.

Dogecoin (DOGE) is trading in the red below $0.1000 at press time on Friday, struggling to extend Thursday’s 4% recovery. The original meme coin is regaining retail strength as the broader market risk sentiment improves. Technically, DOGE should surpass its 100-day Exponential Moving Average (EMA) at $0.1063 for an extended recovery. 

Dogecoin’s gradual return amid broader market sentiment recovery

Dogecoin’s demand in the leverage market is heating up as waning risk-off sentiment in the broader market builds retail appetite for meme coins. CoinMarketCap data shows the CMC Fear and Greed Index at 55, hovering at neutral-to-greed levels and up from 32 on April 1, which indicated fear. Typically, a boost in market sentiment creates favorable conditions for meme coins to regain strength.
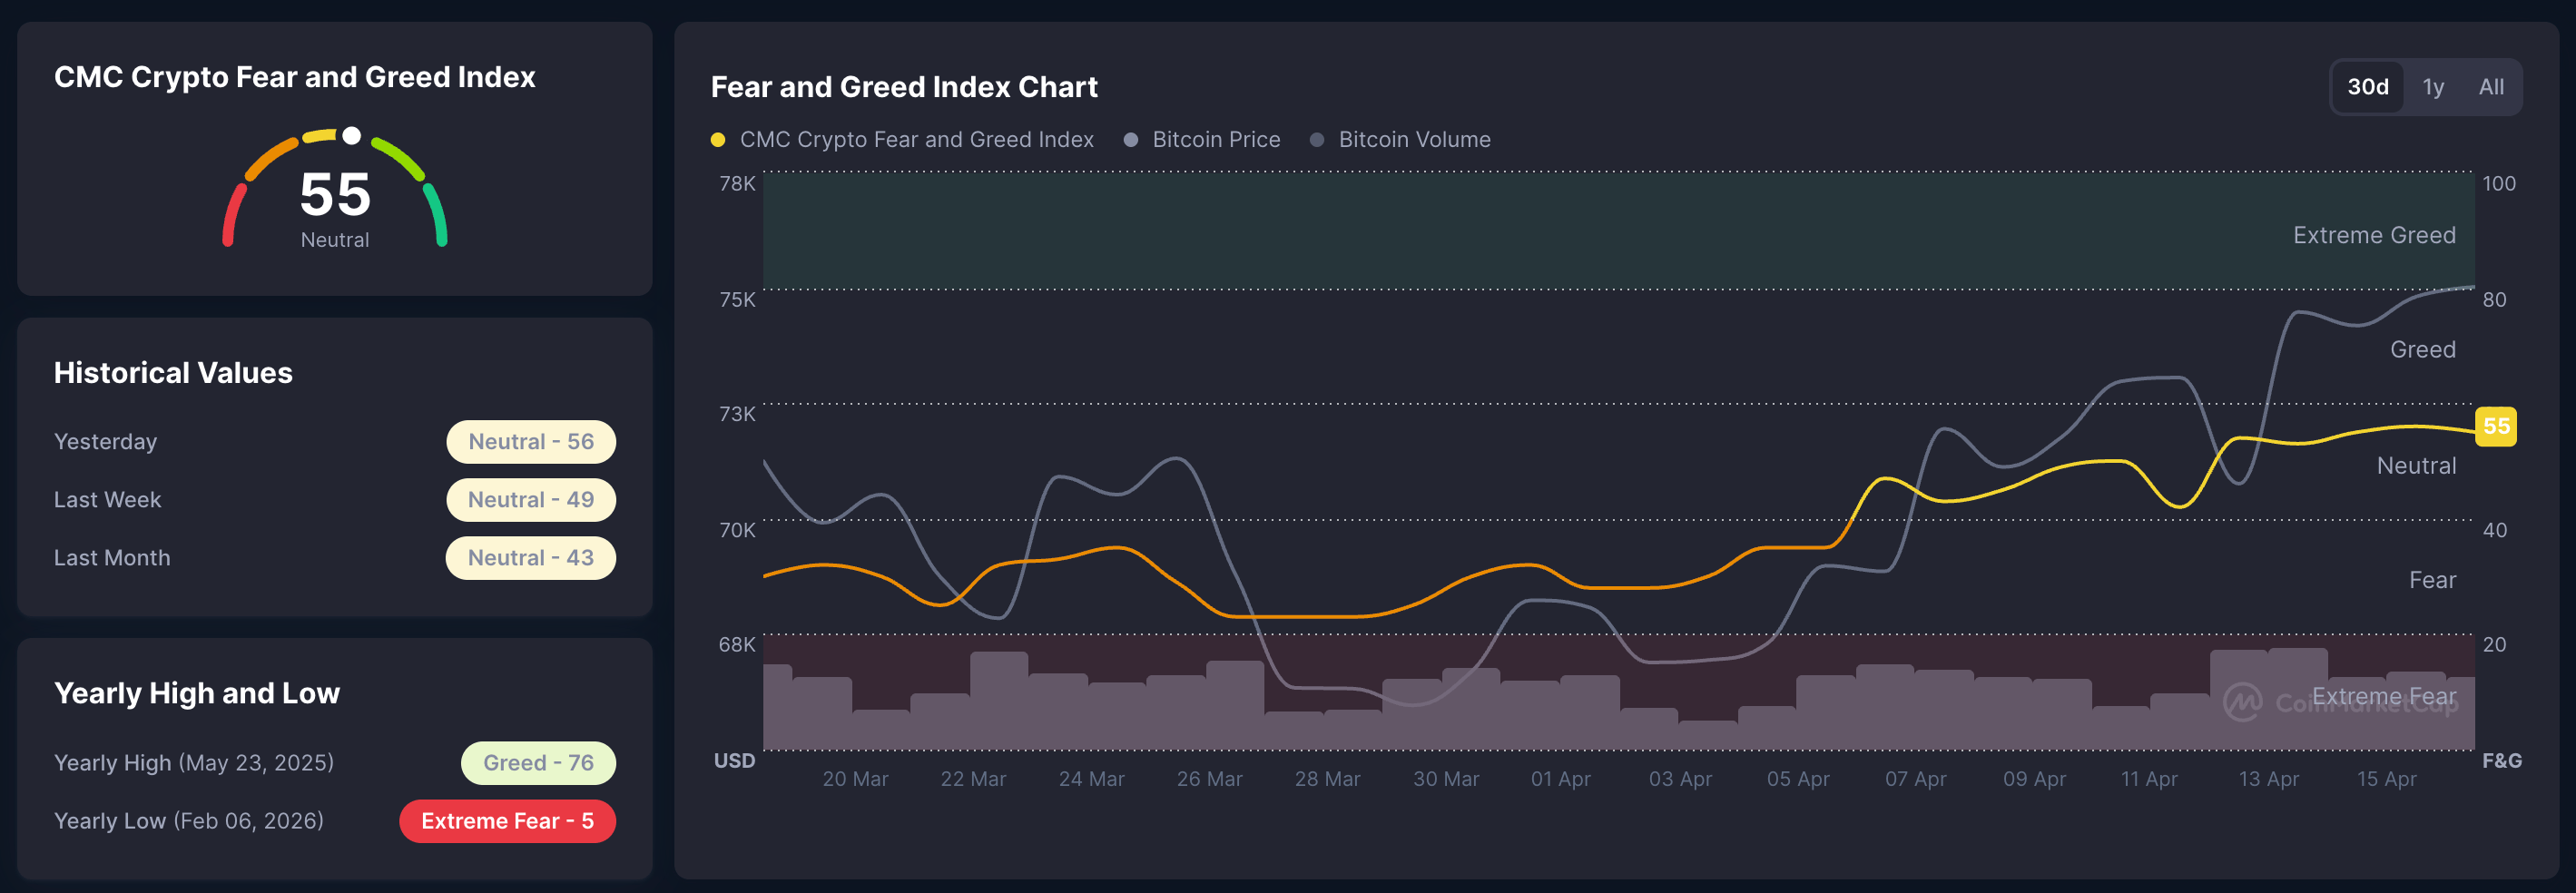
CMC Crypto Fear and Greed Index. Source: CoinMarketCap

On the derivatives side, a surge in DOGE futures Open Interest (OI) to $1.39 billion, from $1.21 billion on Thursday, reaffirms the renewed risk-driven positional buildup. 
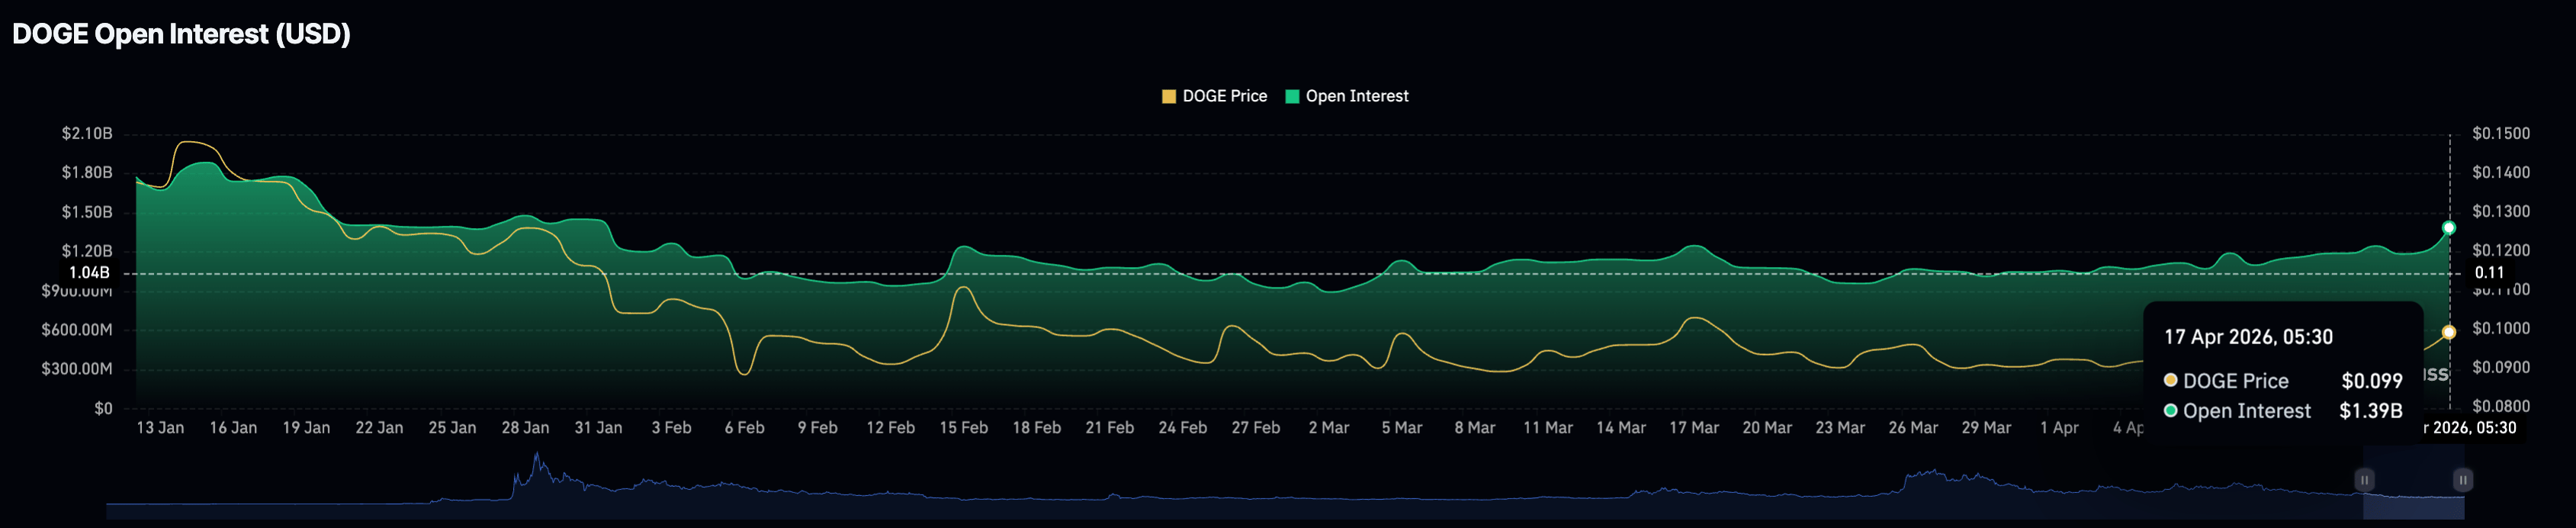
DOGE Open Interest data. Source: CoinGlass

Will DOGE extend its rally above $0.10?

Dogecoin holds gains above the recently broken 50-day EMA at $0.09588, suggesting a modestly constructive near-term tone. However, the descending 100-day and 200-day EMAs suggest a broader downtrend.

Momentum indicators back the near-term improvement, with the Relative Strength Index (RSI) near 60 rising above its midline on the daily chart. At the same time, the Moving Average Convergence Divergence (MACD) marginally crosses above the zero line, with positive histogram bars, hinting that buyers are regaining the upper hand.

On the topside, initial resistance is aligned with the 100-day EMA near $0.1063, and a daily close above this barrier would open the way toward the more meaningful resistance level marked by the December 31 low at $0.1161 and the 200-day EMA at $0.1290.
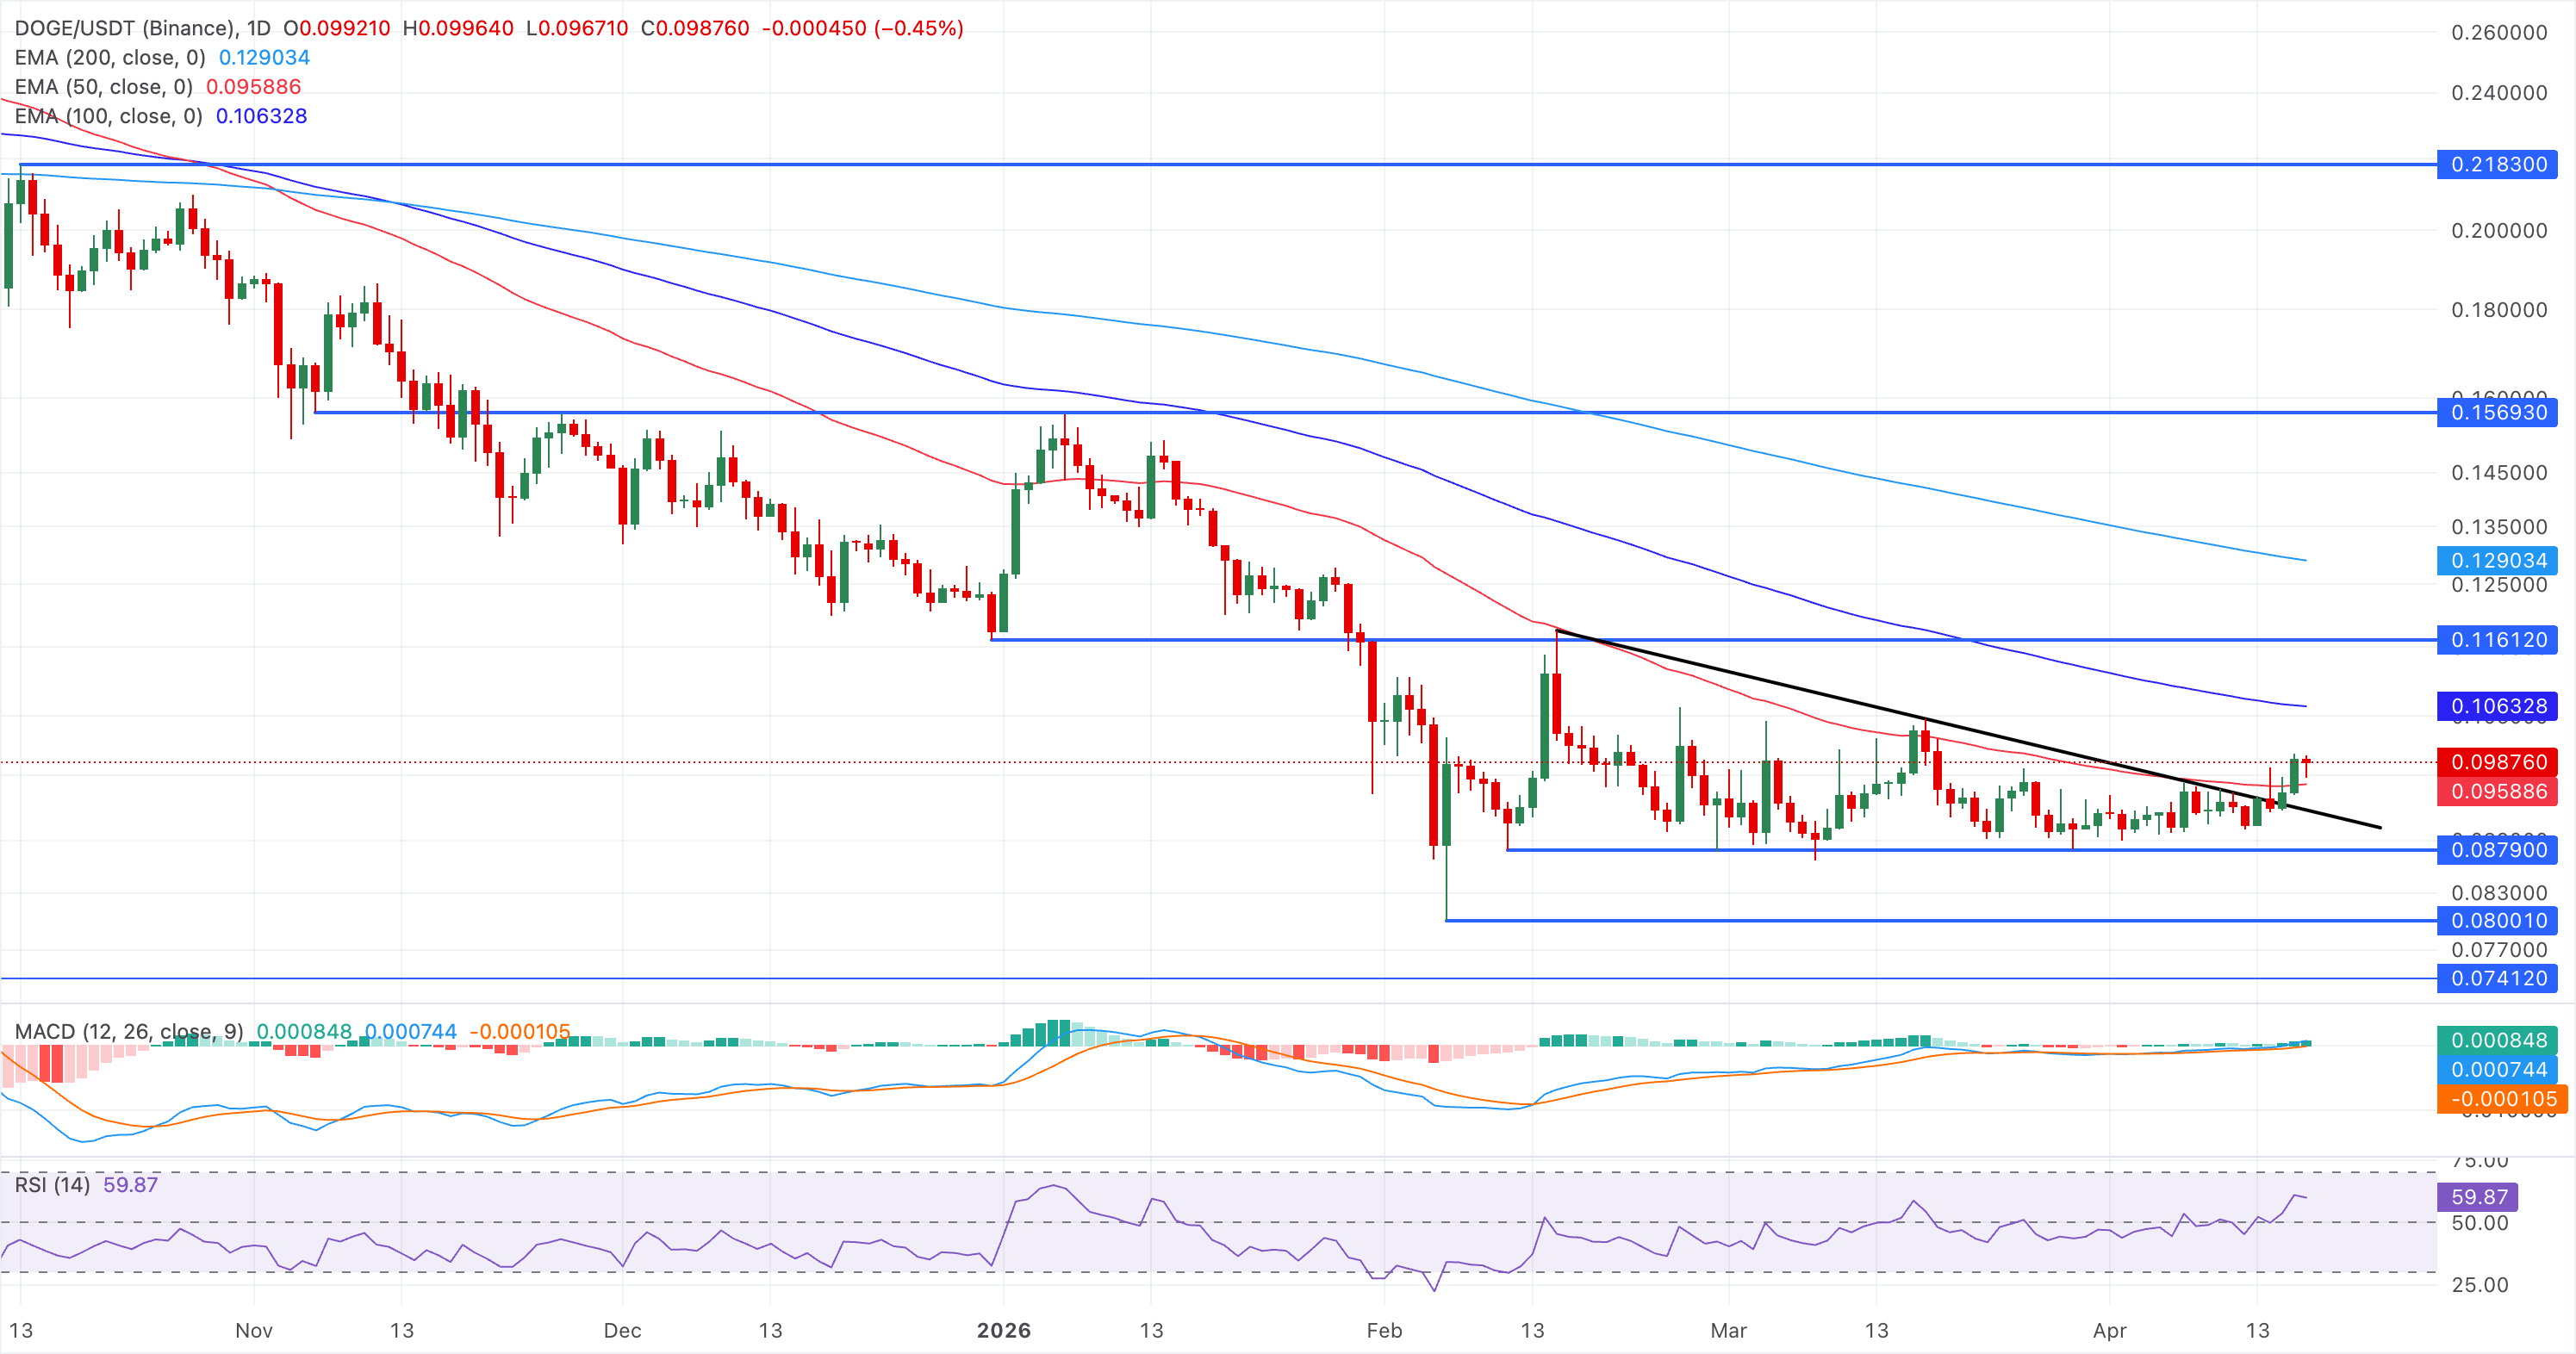
DOGE/USDT daily price chart.

On the downside, any pullback is likely to find initial demand at the 50-day EMA at $0.09588, ahead of the former downtrend line, now support, at $0.0928.

(The technical analysis of this story was written with the help of an AI tool.)

Disclaimer: For information purposes only. Past performance is not indicative of future results.
placeholder
Gold Price Analysis (XAU/USD): Gold Falls to 6-Month Low as Inflation Fuels Rate Hike Bets, A Buying Opportunity or a Falling Knife? Gold hit a 6-month low on Fed rate hike bets. However, strong central bank buying and technical indicators suggest potential tactical bounces and long-term accumulation windows.
Author  Mitrade Team
6 Month 12 Day Fri
Gold hit a 6-month low on Fed rate hike bets. However, strong central bank buying and technical indicators suggest potential tactical bounces and long-term accumulation windows.
placeholder
XRP Price Prediction for July 2026: Can Buyers Finally Break the Downtrend?XRP (XRP) price trades near $1.05, caught between a year-long downtrend and a sudden burst of buying.July has historically rewarded XRP holders. This year the month arrives with on-chain accumulation
Author  Beincrypto
6 Month 30 Day Tue
XRP (XRP) price trades near $1.05, caught between a year-long downtrend and a sudden burst of buying.July has historically rewarded XRP holders. This year the month arrives with on-chain accumulation
placeholder
Smart Money is Leaving Nvidia for This AI Chip StockNvidia stock price keeps sliding, yet the usual dip buyers are missing. Institutional money flow on the stock is the most negative of any major chip name, which means big investors are stepping back i
Author  Beincrypto
6 Month 30 Day Tue
Nvidia stock price keeps sliding, yet the usual dip buyers are missing. Institutional money flow on the stock is the most negative of any major chip name, which means big investors are stepping back i
placeholder
What to Expect From Ethereum (ETH) in July 2026Ethereum (ETH) enters July 2026 trading near $1,570, close to multi-month lows, after recording its first run of three consecutive red quarterly candles in its history.On-chain data and price charts n
Author  Beincrypto
7 Month 01 Day Wed
Ethereum (ETH) enters July 2026 trading near $1,570, close to multi-month lows, after recording its first run of three consecutive red quarterly candles in its history.On-chain data and price charts n
placeholder
Intel Price Forecast: Nvidia Picked Xeon 6, Invested $5B, Yet Analysts Still Trail INTCIntel Corporation (NASDAQ: INTC) sits at $140.05, holding firm on the ascending trendline within the 2H timeframe. The RSI indicator is currently reading 55.21, positioning it as neutral-
Author  TradingKey
7 Month 02 Day Thu
Intel Corporation (NASDAQ: INTC) sits at $140.05, holding firm on the ascending trendline within the 2H timeframe. The RSI indicator is currently reading 55.21, positioning it as neutral-
Related Instrument
goTop
quote