


Gold edges lower as Middle East conflict boosts the US Dollar
- US-Iran hostilities lift WTI, reviving inflation and Fed risks.
- Ten-year yields climb as markets price year-end hike odds.
- Fed blackout leaves jobs data and PMIs as catalysts.
Gold price edges down some 0.19% on Monday as hostilities between the US and Iran extended, following a short-lived truce that began after both countries agreed to a ceasefire, which was broken nine days ago. At the time of writing, XAU/USD trades at $4,011.
XAU/USD slips as rising Oil, yields and Dollar pressure Bullion
The escalation of the Middle East conflict is weighing on Gold prices amid high energy prices, sparked by fears of a disruption in Oil supplies. The US attacked military targets for the ninth straight day near the Strait of Hormuz, while Iran hit US military assets in Gulf states. At the same time, Ansar Allah, an Iran-linked political/military organisation, declared a naval blockade on Saudi Arabia.
On the news, Crude prices, namely US benchmark West Texas Intermediate (WTI) trimmed some of its earlier losses, shifted positive and is up 0.33%, at $82.05 per barrel. Consequently, the US 10-year Treasury yield — which inversely correlates with Gold — is up nearly five basis points to 4.598%, a headwind for the yellow metal.
The US Dollar Index (DXY), which tracks the American Dollar’s value against six currencies, is up 0.19% at 100.94.
Last week, the Federal Reserve’s (Fed) Vice Chair, Philip Jefferson, said he is open to raising rates if there is no progress toward disinflation. On Friday, Cleveland Fed President Beth Hammack expressed concern about persistent high inflation, emphasising that “inflation is too high." She noted the labour market is solid, with good growth and stable consumer spending.
Money markets are pricing 82% odds of an interest rate hike by year-end, yet for the July meeting there is a nearly 79% chance of holding rates unchanged.
Next week, the US economic docket will feature jobs data and S&P Global Flash PMIs as Fedofficials entered their blackout period ahead of the July 29 policy meeting.
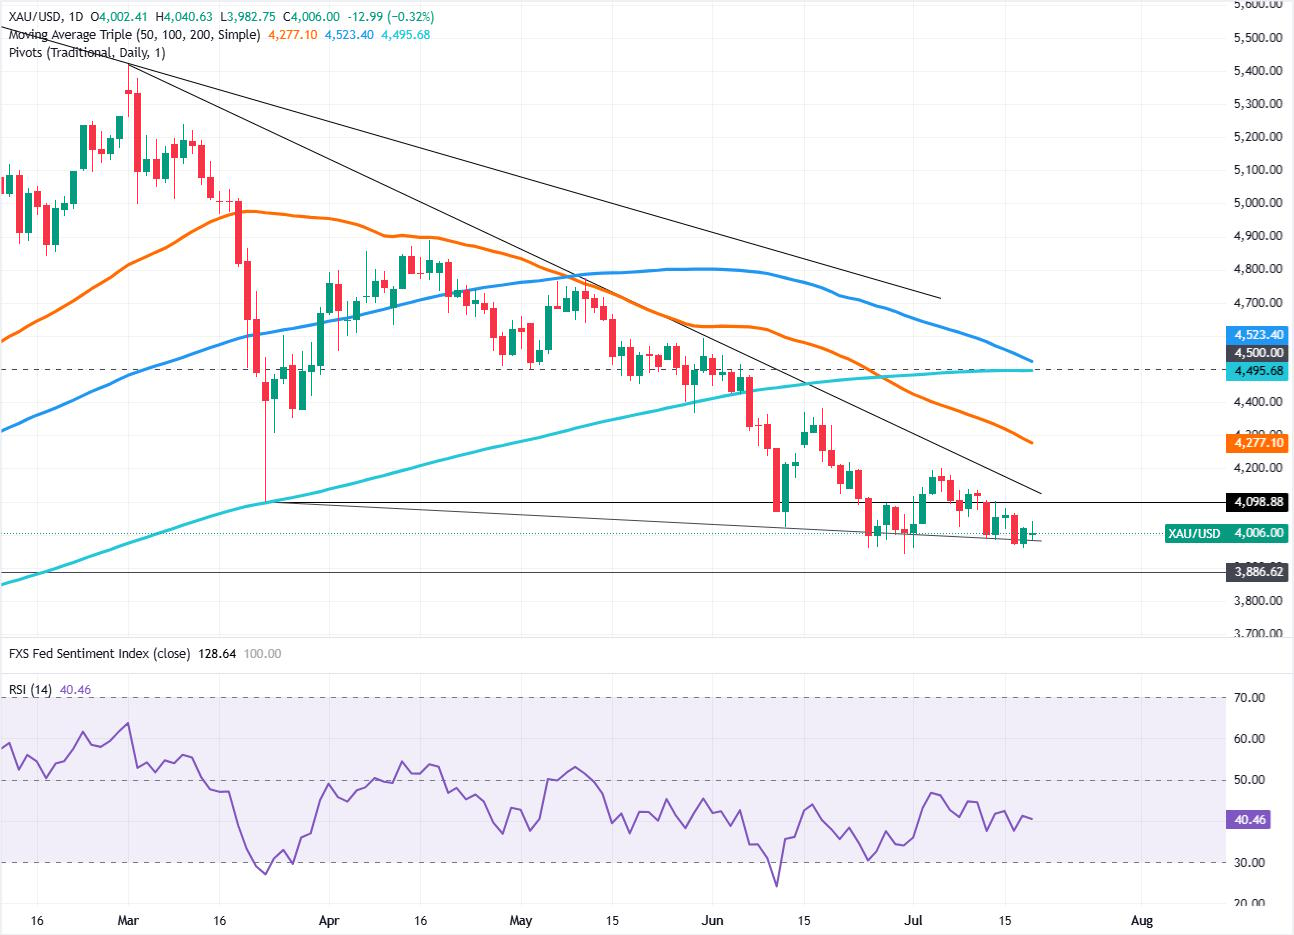
XAU/USD technical outlook: Gold price remains bearish, eyes on $3,900
Gold remains downwardly biased with price action respecting the ongoing successive series of lower highs and lower lows. Also, momentum remains tilted downward as depicted by the Relative Strength Index (RSI), which is bearish.
For a bearish continuation, XAU/USD must drop below the July 17 low of the day (LOD) at $3,959. A breach of the latter will expose the $3,900 psychological level, ahead of the October 28, 2025 mark at $3,886.
To reverse upward, Bullion must break a descending trendline between $4,125 and $4,175. Success could target the 50-day Simple Moving Average (SMA) at $4,291, with the 200-day SMA at $4,495 as the next hurdle. Surpassing this could lead to $4,500.
Gold FAQs
Gold has played a key role in human’s history as it has been widely used as a store of value and medium of exchange. Currently, apart from its shine and usage for jewelry, the precious metal is widely seen as a safe-haven asset, meaning that it is considered a good investment during turbulent times. Gold is also widely seen as a hedge against inflation and against depreciating currencies as it doesn’t rely on any specific issuer or government.
Central banks are the biggest Gold holders. In their aim to support their currencies in turbulent times, central banks tend to diversify their reserves and buy Gold to improve the perceived strength of the economy and the currency. High Gold reserves can be a source of trust for a country’s solvency. Central banks added 1,136 tonnes of Gold worth around $70 billion to their reserves in 2022, according to data from the World Gold Council. This is the highest yearly purchase since records began. Central banks from emerging economies such as China, India and Turkey are quickly increasing their Gold reserves.
Gold has an inverse correlation with the US Dollar and US Treasuries, which are both major reserve and safe-haven assets. When the Dollar depreciates, Gold tends to rise, enabling investors and central banks to diversify their assets in turbulent times. Gold is also inversely correlated with risk assets. A rally in the stock market tends to weaken Gold price, while sell-offs in riskier markets tend to favor the precious metal.
The price can move due to a wide range of factors. Geopolitical instability or fears of a deep recession can quickly make Gold price escalate due to its safe-haven status. As a yield-less asset, Gold tends to rise with lower interest rates, while higher cost of money usually weighs down on the yellow metal. Still, most moves depend on how the US Dollar (USD) behaves as the asset is priced in dollars (XAU/USD). A strong Dollar tends to keep the price of Gold controlled, whereas a weaker Dollar is likely to push Gold prices up.
Recommended Articles


