


Gold swings around $4,000 as conflicting Middle East headlines drive markets
- Gold trades in a volatile range as shifting Middle East headlines keep markets on edge.
- A stronger US Dollar and firmer Oil prices cap gains in the precious metal.
- Technically, XAU/USD keeps a bearish bias below the $4,200 resistance level, with sellers eyeing a break below $4,000.
Gold (XAU/USD) trades in a volatile range on Monday as markets react to conflicting headlines from the Middle East. At the time of writing, XAU/USD trades around $4,010, little changed on the day after climbing to an intra-day high of $4,040.
The metal climbed earlier in the day after both Iran and the United States (US) signalled that diplomacy was still possible despite the continued military strikes. Iranian Foreign Ministry spokesperson Esmaeil Baghaei said intermediaries had exchanged messages with Tehran in recent days and that negotiations with the US could be pursued in line with Iran’s national interests.
“I think we’re always open to diplomacy. It has to be real. It has to be a deal that they’re willing to live by,” US Secretary of State Marco Rubio said.
The comments pushed the US Dollar (USD) and Oil prices lower, helping Gold gain ground. However, markets quickly priced a fresh geopolitical risk premium after Reuters reported that Yemen’s Iran-aligned Houthis had declared an immediate naval blockade against Saudi Arabia.
In reaction, the US Dollar recovered all its earlier losses, while Oil prices rebounded from intraday lows and traded near a one-month high, limiting Gold’s upside.
The US Dollar Index (DXY), which tracks the Greenback’s value against a basket of six major currencies, trades near 100.90 after recovering from an intraday low of 100.65.
Meanwhile, hawkish Federal Reserve (Fed) expectations remain a major headwind for the non-yielding metal as higher Oil prices keep inflation risks elevated. In recent days, several Fed officials have stressed their commitment to bringing inflation back to the 2% target. Markets therefore expect at least one interest-rate hike this year.
The US economic calendar is relatively quiet this week, with Initial Jobless Claims due on Thursday and the preliminary July Purchasing Managers Index (PMI) data scheduled for Friday. Fed officials have entered their blackout period ahead of next week’s monetary policy meeting, leaving geopolitical headlines as the main driver for Gold in the near term.
Technical analysis: Bearish bias holds below $4,200
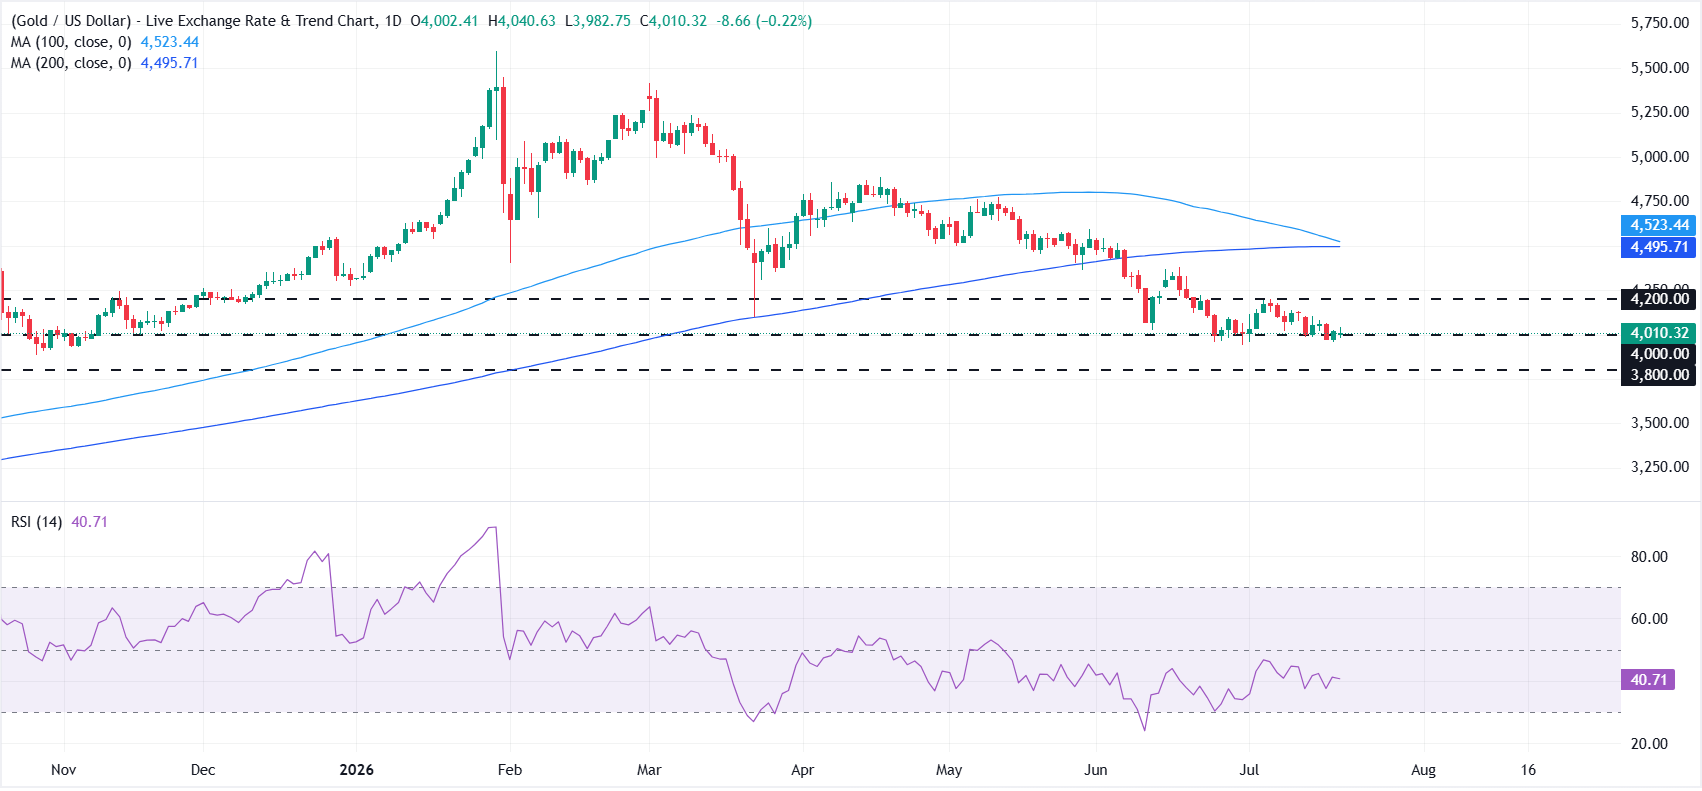
On the daily chart, XAU/USD remains in a bearish stance, trading well below the 200-day simple moving average (SMA) at $4,495.69 and the 100-day SMA at $4,523.
The pair has slipped back under the previously highlighted $4,200 resistance area, while the Relative Strength Index (RSI) around 40 suggests weak but not extreme downside momentum, reinforcing the notion of a market that stays capped by overhead supply rather than oversold.
On the topside, initial resistance is now seen at $4,200, with the 200-day SMA at $4,495 followed by the 100-day SMA at $4,523 forming a broader medium-term ceiling.
On the downside, immediate support is located near $4,000, ahead of a lower structural floor at $3,800. A decisive break beneath these levels would open the door to a deeper corrective leg in the metal.
(The technical analysis of this story was written with the help of an AI tool. Know more.)
Gold FAQs
Gold has played a key role in human’s history as it has been widely used as a store of value and medium of exchange. Currently, apart from its shine and usage for jewelry, the precious metal is widely seen as a safe-haven asset, meaning that it is considered a good investment during turbulent times. Gold is also widely seen as a hedge against inflation and against depreciating currencies as it doesn’t rely on any specific issuer or government.
Central banks are the biggest Gold holders. In their aim to support their currencies in turbulent times, central banks tend to diversify their reserves and buy Gold to improve the perceived strength of the economy and the currency. High Gold reserves can be a source of trust for a country’s solvency. Central banks added 1,136 tonnes of Gold worth around $70 billion to their reserves in 2022, according to data from the World Gold Council. This is the highest yearly purchase since records began. Central banks from emerging economies such as China, India and Turkey are quickly increasing their Gold reserves.
Gold has an inverse correlation with the US Dollar and US Treasuries, which are both major reserve and safe-haven assets. When the Dollar depreciates, Gold tends to rise, enabling investors and central banks to diversify their assets in turbulent times. Gold is also inversely correlated with risk assets. A rally in the stock market tends to weaken Gold price, while sell-offs in riskier markets tend to favor the precious metal.
The price can move due to a wide range of factors. Geopolitical instability or fears of a deep recession can quickly make Gold price escalate due to its safe-haven status. As a yield-less asset, Gold tends to rise with lower interest rates, while higher cost of money usually weighs down on the yellow metal. Still, most moves depend on how the US Dollar (USD) behaves as the asset is priced in dollars (XAU/USD). A strong Dollar tends to keep the price of Gold controlled, whereas a weaker Dollar is likely to push Gold prices up.
Recommended Articles


