


Gold Price Trend Forecast: June CPI Plus Fed Chair Congressional Testimony, Can Gold Price Hold Above $4,000?
TradingKey - As of the Asian session on July 14, gold ( XAUUSD) prices consolidated around the $4,000 mark, briefly slipping below $4,000 intraday to hit a low of $3,983.23. Looking at the market action, gold prices plummeted 2.87% yesterday, dragged down by the escalating crisis in the Strait of Hormuz. During the session, prices briefly fell below $4,000 to $3,986.64, but the closing price managed to hold above the $4,000 level, ending at $4,001.01. This suggests that the $4,000 mark has become a key battleground for bulls and bears. For investors, the primary focus today will be the U.S. June CPI data.
Escalating US-Iran Tensions Lift Oil Prices, Gold Faces Heavy Downward Pressure
From a fundamental perspective, the core factor dragging gold prices lower recently is the re-escalation of tensions between the US and Iran, which has driven up oil prices and heated up inflation expectations. Trump recently stated that the US will take control of the Strait of Hormuz and plans to levy fees on cargo passing through the region to cover security costs. This statement implies that US involvement in the Strait of Hormuz is shifting from "ensuring navigation" to a more direct control arrangement. Meanwhile, the US has also reimposed a maritime blockade on Iran and taken action targeting Iran's military capabilities related to the strait. On the other hand, Iran insists on its dominant authority over the transit rules of the strait, viewing US actions as a direct challenge to its regional interests.
Following the news, the crude oil market surged. On Monday, WTI ( USOIL) crude oil closed up 9.08% at $77.99; Brent ( UKOIL) crude oil closed up 10.76% at $83.31. During the Asian session on Tuesday, oil prices extended yesterday's gains and moved higher again, with WTI crude touching an intraday high of $80.42 and Brent crude rising to $85.64, pushing both major oil benchmarks above the $80 mark.
The surge in oil prices has reignited market concerns over a secondary shock of energy prices on US inflation. For gold, rising oil prices push up inflation expectations, which could force the Federal Reserve to maintain interest rates higher for longer, or even retain the possibility of further policy tightening, potentially driving US Treasury yields upward. Since gold itself is a non-yielding asset, any rise in US Treasury yields increases the holding cost of gold, thereby putting downward pressure on gold prices.
June CPI and Fed Chair Congressional Testimony: How Will Gold Prices React?
Notably, the US is set to release June CPI data today. The market generally expects that headline CPI for June may cool from May due to a prior pullback in energy prices, with some forecasts showing year-on-year headline CPI falling from 4.2% in May to around 3.8% to 3.9%, while year-on-year core CPI could ease slightly to around 2.8%. However, what the market is truly focusing on is whether core inflation remains sticky and whether a rebound in energy prices will alter the inflation trajectory over the coming months.
If the June CPI falls short of expectations, especially if the month-on-month core CPI slows significantly, the market may scale back Federal Reserve rate hike expectations, which could drive down the US dollar and Treasury yields and provide rebounding momentum for gold. Conversely, if the CPI beats expectations or core inflation remains stubborn, the market may reprice 'higher for longer' interest rates, keeping gold under pressure. Considering that the current US-Iran tensions have already pushed up oil prices, investors' sensitivity to inflation data has risen markedly, and there is weak appetite to chase gold higher ahead of the CPI release.
In addition, the market will focus on Fed Chair Warsh's semi-annual monetary policy report hearing before Congress, which represents a key policy signal window roughly an hour and a half after the CPI release. For the gold market, participants will watch whether Warsh interprets the CPI as 'transitory fluctuations' or 'evidence warranting further policy tightening.' If he emphasizes that inflation remains above the 2% target and that vigilance is still needed over energy prices and core services inflation, the market may interpret this as a hawkish signal, with the rising US dollar and Treasury yields continuing to suppress gold. Conversely, if he acknowledges cooling employment and slowing economic momentum, and hints that the Fed needs to rebalance between inflation and growth, gold could find short-term support.
Gold Price Trend Analysis: $4,000 Becomes Key Point for Bulls and Bears
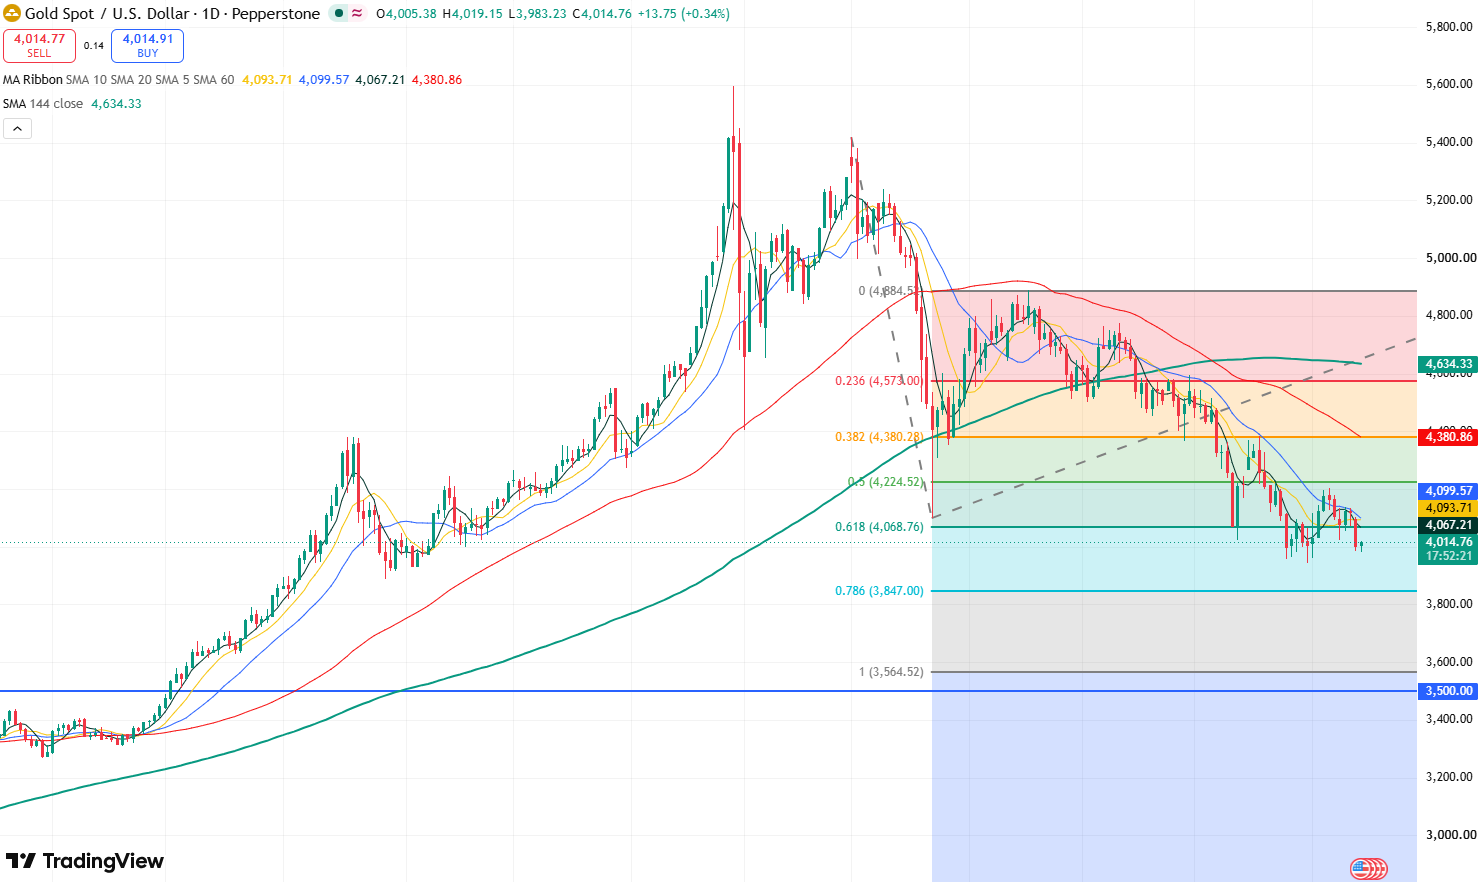
Gold Price Daily Chart, Source: TradingView
From gold's daily chart, the overall recent movement of gold prices exhibits a clear trend of lower highs and lower lows on the candlestick chart, meaning that the near-term trend for gold is biased to the downside. However, gold has been trading above $4,000 since late June; although it briefly dipped below $4,000 during this period, the closing price has consistently held above the $4,000 mark, indicating strong support at this level as bulls and bears battle here.
Currently, if today's closing gold price confirms a break below $4,000, further downside will open up, with the primary downside target testing $3,900, and potentially falling further toward the $3,500 support level. Conversely, if gold continues to hold above $4,000, a short-term bottom would be confirmed as established, and the price could stage a technical rebound, first testing the resistance at $4,200, with the next resistance level at $4,360 further up.
Recommended Articles


