


WTI Crude Oil Price Forecast: US-Iran Conflict Escalates, Oil Price Rally Targets $80
TradingKey - As of the early Asian trading session on July 13, WTI crude oil ( USOIL) prices surged. Affected by the escalation of the US-Iran conflict over the weekend, the market has re-incorporated the risk of supply disruptions in the Strait of Hormuz into its trading logic, with WTI crude oil rising over 4% and reaching an intraday high of $74.66.
US-Iran Conflict Escalates, Driving Oil Price Surge
From a fundamental perspective, the core driver behind today's surge in oil prices is the escalation of the US-Iran conflict. On Friday, the market briefly believed that transit through the Strait of Hormuz might gradually resume, causing oil prices to pull back amid profit-taking and expectations of supply recovery. However, renewed military clashes between the US and Iran over the weekend shifted the market's assessment of short-term supply security.
According to the latest reports, the US and Iran launched reciprocal missile and drone attacks over the weekend, further expanding the scope of the conflict. Iran also extended its strikes to targets near Gulf nations such as Qatar and the UAE, while the US continued to launch retaliatory strikes against Iran-related military facilities. Because these areas are closely linked to Middle East crude exports, Gulf tanker routes, and the Strait of Hormuz, the market immediately ratcheted up the crude oil risk premium.
The Strait of Hormuz remains the most sensitive variable for current oil prices. The waterway is responsible for transporting a significant portion of the world's crude oil and liquefied natural gas (LNG). Once transit is disrupted, energy exports from countries including Saudi Arabia, Iraq, Kuwait, the UAE, and Qatar could be affected. Iran once claimed to have closed the Strait of Hormuz and stated that some vessels were attacked for navigating unauthorized routes. Although Trump indicated that commercial vessels could still pass through, vessel-tracking data showed that the number of ships transiting the strait on Sunday fell to its lowest level in nearly five weeks.
Overall, the previous decline in oil prices was primarily built on the logic of "contained conflict, resumed transit through the strait, and gradual return of supply"; now, however, new military actions have challenged this logic. As long as actual transit volumes through the Strait of Hormuz fail to recover, rising tanker insurance costs, shipping delays, and concerns over supply disruptions will continue to support oil prices.
WTI Crude Oil Price Analysis: Oil Prices May Rebound to $80
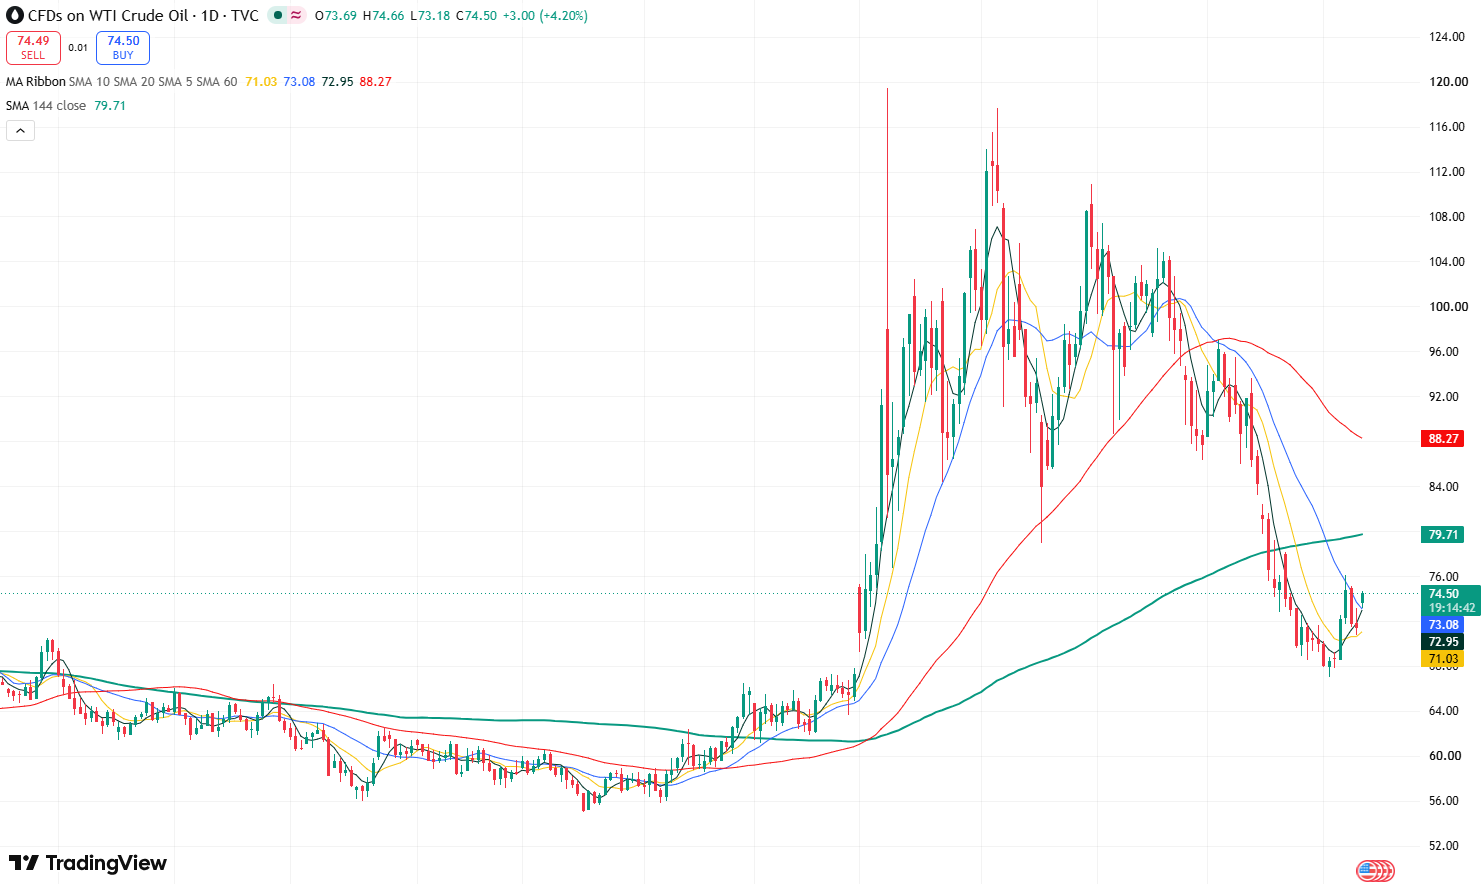
WTI Crude Oil Daily Chart, Source: TradingView
Looking at the daily chart of WTI crude oil, supported by the reignited conflict in the US-Iran situation, oil prices recently rebounded rapidly and stabilized above $70, surging to as high as $76.08 last week before pulling back for two consecutive days. However, the weekly closing price still held firmly above $70, indicating that short-term market sentiment is tilted toward the bulls. Meanwhile, under the impact of the further escalation of the US-Iran situation over the weekend, bullish sentiment in the market has been further amplified, significantly increasing the probability of short-term oil prices continuing to rise.
Currently, driven by news, oil prices opened higher today and broke through the resistance of the 20-day moving average, further opening up the upside. The next target will be to test the recent rebound high of $76.08, and further up is the $80 threshold. If oil prices can stage a strong break above $80, they may further test the resistance level around $86.
Conversely, if oil prices pull back today and close below $73, it would mean that prices remain capped by the 20-day moving average, and the downward correction may continue in the short term. The primary downside target will be to test the support zone of $71-$70. If this zone fails to hold, oil prices could head further down to test the $60 threshold.
Recommended Articles


