


Silver Price Forecast: XAG/USD jumps to near $59 as US Dollar declines
- Silver price climbs to near $59.00 amid weakness in the US Dollar.
- Higher oil prices due to renewed Middle East hostilities have de-anchored inflation expectations again.
- The FOMC minutes show that officials are concerned over high inflation risks.
Silver price (XAG/USD) is up over 1% to near $59.00 during the European trading session on Thursday. The white metal gains as the US Dollar (USD) faces selling pressure despite multiple tailwinds.
At press time, the US Dollar Index (DXY), which tracks the Greenback’s value against six major currencies, trades 0.25% lower to near 100.80.
US Dollar Price Today
The table below shows the percentage change of US Dollar (USD) against listed major currencies today. US Dollar was the weakest against the New Zealand Dollar.
| USD | EUR | GBP | JPY | CAD | AUD | NZD | CHF | |
|---|---|---|---|---|---|---|---|---|
| USD | -0.24% | -0.28% | -0.18% | -0.10% | -0.18% | -0.58% | -0.33% | |
| EUR | 0.24% | -0.04% | 0.04% | 0.13% | 0.09% | -0.31% | -0.09% | |
| GBP | 0.28% | 0.04% | 0.07% | 0.17% | 0.12% | -0.27% | -0.04% | |
| JPY | 0.18% | -0.04% | -0.07% | 0.07% | 0.05% | -0.38% | -0.13% | |
| CAD | 0.10% | -0.13% | -0.17% | -0.07% | -0.04% | -0.44% | -0.21% | |
| AUD | 0.18% | -0.09% | -0.12% | -0.05% | 0.04% | -0.39% | -0.17% | |
| NZD | 0.58% | 0.31% | 0.27% | 0.38% | 0.44% | 0.39% | 0.23% | |
| CHF | 0.33% | 0.09% | 0.04% | 0.13% | 0.21% | 0.17% | -0.23% |
The heat map shows percentage changes of major currencies against each other. The base currency is picked from the left column, while the quote currency is picked from the top row. For example, if you pick the US Dollar from the left column and move along the horizontal line to the Japanese Yen, the percentage change displayed in the box will represent USD (base)/JPY (quote).
Technically, a lower US Dollar makes the Silver price a favorable risk-reward bet for investors.
The US Dollar struggles to get support despite renewed high United States (US) inflation concerns amid the restart of the war in the Middle East.
Rising oil prices due to the exchange of attacks between the US and Iran, and strikes on Iranian infrastructure have refreshed global upside inflation risks.
In the FOMC minutes of the June policy meeting, released on Wednesday, the bottom line was that policymakers see inflation as dominant risk and favored monetary tightening moving ahead.
Going forward, the next major trigger for the US Dollar will be the US Consumer Price Index (CPI) data for June, which will be released on Tuesday.
Silver technical analysis
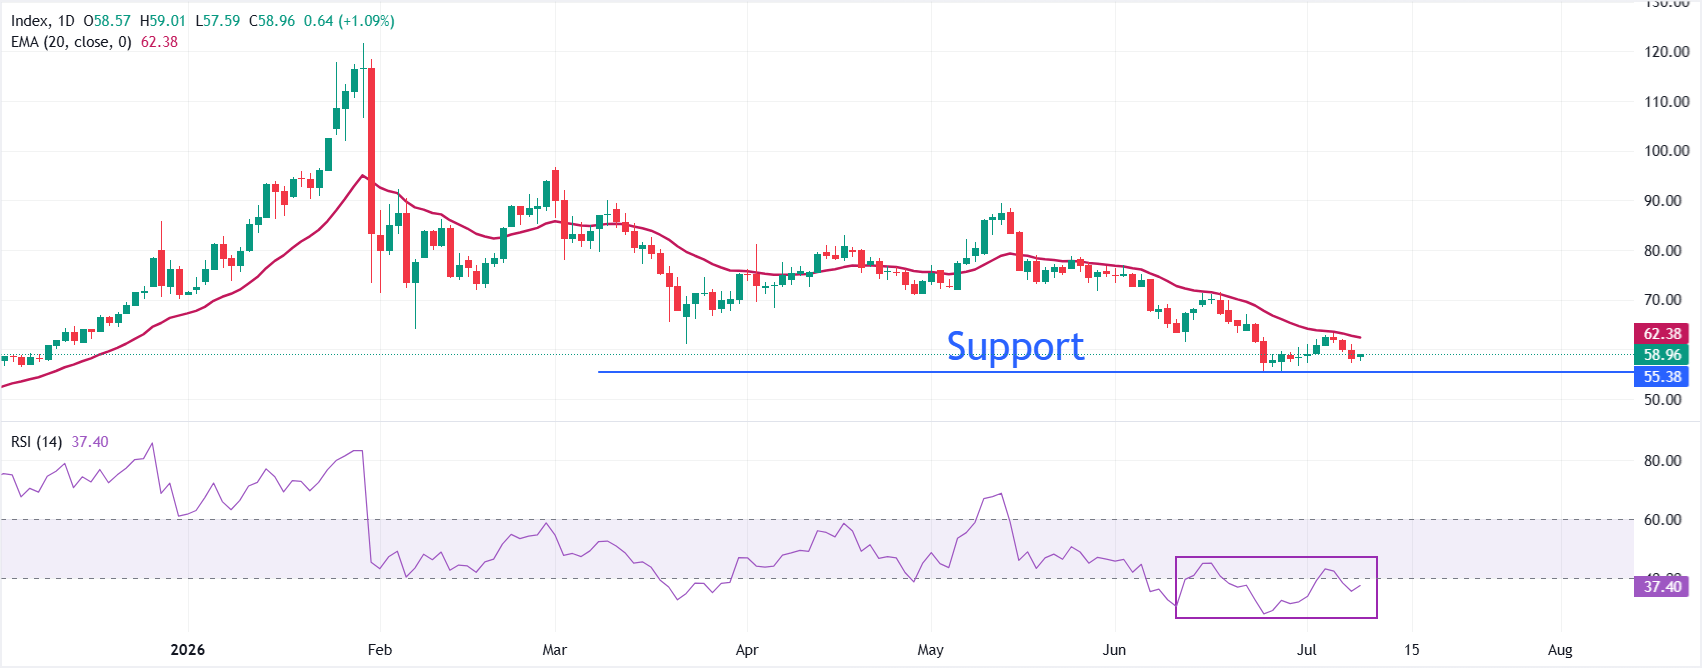
XAG/USD trades higher at around $59; however, it retains a bearish near-term bias as spot holds beneath the 20-day exponential moving average (EMA) at $62.38. The downside tilt is reinforced by the Relative Strength Index (14) hovering around 37, which stays below the neutral 50 line but above oversold territory, suggesting persistent selling pressure without capitulation.
On the topside, initial resistance is the round-level of $60.00, followed by the 20-day EMA at $62.38. Looking down, the Silver price could enter a fresh downside leg if it declines below the June 24 low at $55.63.
(The technical analysis of this story was written with the help of an AI tool. Know more.)
Silver FAQs
Silver is a precious metal highly traded among investors. It has been historically used as a store of value and a medium of exchange. Although less popular than Gold, traders may turn to Silver to diversify their investment portfolio, for its intrinsic value or as a potential hedge during high-inflation periods. Investors can buy physical Silver, in coins or in bars, or trade it through vehicles such as Exchange Traded Funds, which track its price on international markets.
Silver prices can move due to a wide range of factors. Geopolitical instability or fears of a deep recession can make Silver price escalate due to its safe-haven status, although to a lesser extent than Gold's. As a yieldless asset, Silver tends to rise with lower interest rates. Its moves also depend on how the US Dollar (USD) behaves as the asset is priced in dollars (XAG/USD). A strong Dollar tends to keep the price of Silver at bay, whereas a weaker Dollar is likely to propel prices up. Other factors such as investment demand, mining supply – Silver is much more abundant than Gold – and recycling rates can also affect prices.
Silver is widely used in industry, particularly in sectors such as electronics or solar energy, as it has one of the highest electric conductivity of all metals – more than Copper and Gold. A surge in demand can increase prices, while a decline tends to lower them. Dynamics in the US, Chinese and Indian economies can also contribute to price swings: for the US and particularly China, their big industrial sectors use Silver in various processes; in India, consumers’ demand for the precious metal for jewellery also plays a key role in setting prices.
Silver prices tend to follow Gold's moves. When Gold prices rise, Silver typically follows suit, as their status as safe-haven assets is similar. The Gold/Silver ratio, which shows the number of ounces of Silver needed to equal the value of one ounce of Gold, may help to determine the relative valuation between both metals. Some investors may consider a high ratio as an indicator that Silver is undervalued, or Gold is overvalued. On the contrary, a low ratio might suggest that Gold is undervalued relative to Silver.
Recommended Articles


